3 Reasons the Market Correction Is Not Over
Recent bounces are likely bounces within an ongoing downtrend for equities in general.
You've reached your free article limit
You've read 0 of 1 free Pro articles.
Wednesday’s mixed market action for the major equity indexes left their index chart trends mostly on the bearish side of the scale as their primary downtrend lines remained intact. Only two are in neutral trends. Meanwhile, cumulative market breadth remains neutral.
Of note, investor sentiment (contrarian indicators) and forward 12-month valuation for the S&P 500, however, continue to suggest the recent correction may have further to go. Disappointing reports from some of the mega-cap names add more evidence to support our assumption.
As such, we believe the recent market bounce from its oversold levels is likely a bounce within an ongoing downtrend for equities in general. We remain cautious until enough evidence is presented that would imply said correction is likely complete.
Primary Downtrends Remain Intact
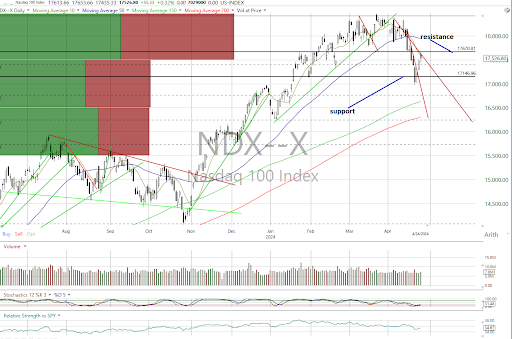
For a larger view click here.
On the charts, the major equity indexes closed mixed Wednesday with mixed internals on lighter trading volumes.
All closed near their session midpoints with the S&P 500, Nasdaq Composite, Nasdaq 100 (see above) and MidCap 400 posting gains as the rest declined.
We would highlight that the only index trading above its primary downtrend line is the DJIA as the rest remain below and intact.
Cumulative market breadth is unchanged and neutral for the All Exchange, NYSE and Nasdaq.
We will honor said trends until they suggest otherwise.
Detrended Rydex Ratio Returns to Bearish Projection
Looking at the data, the 1-Day McClellan Overbought/Oversold Oscillators remain neutral (All Exchange: +2.17 NYSE: +5.81 Nasdaq: +1.25).
The percentage of S&P 500 issues trading above their 50-day moving averages (contrarian indicator) rose to 45% and is neutral.
We would note the detrended Rydex Ratio (contrarian indicator) has shifted back to bearish from its one-day neutral reading. It’s back on a red light.
The Open Insider Buy/Sell Ratio is neutral at 46.5.
Leveraged ETF sentiment was -5.0, remaining neutral.
This week’s AAII Bear/Bull Ratio (contrarian indicator) rose to 0.62 turning neutral from its previous bearish signal as the number of bulls declined.
However, the new Investors Intelligence Bear/Bull Ratio (contrary indicator) remains on a bearish warning as bulls outweigh bears by 3 to 1.
So, two of the three sentiment data points are bearish.
Valuation
The forward 12-month consensus earnings estimate for the S&P 500 from Bloomberg rose to $243.51 per share from $243.06. Yet, its forward P/E multiple at 20.8x remains well above the “rule of 20” ballpark fair value of 15.4x. We reiterate that a 500-basis point premium remains a significant cause for concern.
The S&P's earnings yield is 4.8%.
The 10-year Treasury yield rose to 4.65%. Its trend is bullish with support at 4.49% and resistance at 4.7%.
The U.S. dollar, via the UUP ETF, closed higher at $28.82 and in a bullish trend. Support is $28.49 and $29.08 resistance.
Bottom Line
Given the combination of overvaluation, market sentiment being too bullish and the charts mostly in downtrend, there is nothing to suggest at this point that the current correction is over.