Walmart Beats, But Could Investors Still Be Left Holding the Bag?
This cash flow beast of a retailer just topped expectations on the top and bottom lines, but is there a risk for investors?
You've reached your free article limit
You've read 0 of 1 free Pro articles.
Question: Where do budget-conscious consumers shop during tougher economic times?
Question: What retail chain became the giant it is by courting the lower- and middle-income consumer?
Question: Where does the middle- and higher-income consumer turn when shopping at boutique-style and higher-end shops becomes a bad move for them?
That's right. The answer to all of these questions is Walmart WMT. The chain has become the comfort-food equivalent of shopping for one's household for the necessities of everyday life. Always there. Always fair.
On Thursday morning, on-again, off-again Sarge favorite Walmart posted fiscal second-quarter financial results, revealing adjusted earnings per share of $0.67 (GAAP EPS: $0.56) on revenue of $169.335 billion -- top- and bottom-line numbers that beat Wall Street's expectations. The sales print not only beat Wall Street by almost $2 billion, but reflected annual growth of 4.8%.
Comparable U.S. sales increased 4.2%, easily topping expectations for growth of 3.4%. Transactions were up 3.6% as the average ticket grew 0.6%. Global eCommerce sales were up 21%, led by store-fulfilled pickup and delivery, while the global advertising business grew 26% overall including 30% growth for Walmart Connect.
Long-time readers know that I have been a fan of the business, but not so much of the balance sheet for quite some time. I did come into this release long the equity.
Operations
As revenue was growing 4.8% to $169.335 billion (on net sales growth of 4.7% and membership driven growth of 16%), the cost of those sales grew 4.1% to $126.81 billion, on a gross margin that improved from 24% to 24.4%. Operating expenses increased 6.5% to $34.585 billion, leaving unadjusted operating income of $7.94 billion (+8.5%). Operating margin improved from 4.56% to 4.73%. After accounting for interest, taxes and other income and losses, net income attributable to shareholders comes to $4.711 billion, or $0.56 per diluted share, down from $0.97 a year ago. The difference between the two is largely due to investment income and losses outside of operations.
Business Unit Performance
Walmart U.S.: Net sales grew 4.1% to $115.3 billion, as comp sales increased 4.2% from the year-ago comp. Transactions increased 3.6% as the average ticket grew 0.6%. eCommerce contributed a rough 300-basis points to that comp. Segment operating income increased 7.8% to $6.6 billion.
Walmart International: Net sales grew 7.1% to $29.6 billion, or 8.3% to $29.9 billion in constant currency. Segment operating income increased 14.3% to $1.4 billion, or 15.7% to $1.4 billion in constant currency.
Sam's Club: Net sales grew 4.7% to $22.9 billion, or 5.5% to $20 billion ex-fuel. Comp sales (ex-fuel) increased 5.2% from the year-ago comp. Transactions increased 6.1% as the average ticket decreased by 0.8%; eCommerce contributed a rough 230 basis points to that comp. Segment operating income increased 11.5% to $600 million.
Guidance
For the current quarter, net sales are seen increasing by 3.25% to 4.25%. Estimates were for something close to 3.85%, so this can be seen as a little on the light side. Operating income is seen growing between 3% and 4.5% resulting in an expected adjusted EPS of $0.51 to $0.52. Wall Street was looking for $0.54.
Full year guidance is more encouraging. For the full fiscal year, Walmart sees net sales increasing by 3.75% to 4.75% (above original guidance of 3% to 4%), producing operating income growth of 6.5% to 8% (up from original guidance of 4% to 6%). The firm now sees full year adjusted EPS of $2.35 to $2.43, up from original guidance of $2.23 to $2.37
Fundamentals
For the first six months of the fiscal year, Walmart generated operating cash flow of $16.357 billion. Out of that number came capital spending of $10.507 billion, leaving free cash flow of $5.85 billion. Out of that number, Walmart repurchased $2.072 billion worth of common stock and paid out $3.336 billion in cash dividends to shareholders. The rest was put toward debt repayment.
Turning to the balance sheet, Walmart ended the period with a cash position of $8.811 billion and inventories of $55.611 billion to put current assets at $76.51 billion. Current liabilities add up to $95.26 billion, including debt maturing within a year of $4.69 billion. While there is enough cash on hand to handle the short-term debt load, the current ratio stands at an unsightly 0.80, and a quick ratio of 0.22. Now, with retailers, we do not really look at quick ratios, as the business is inventory-centric, but we really do not like to see current ratios below the 1.0 level.
Total assets amount to $254.44 billion, including goodwill of $27.93 billion. There are no other intangible assets listed. At 11% of total assets, this is not a problem. Total liabilities less equity comes to $163.875 billion, including longer-term debt of $35.364 billion. As I have mentioned roughly four times a year for many years. I like Walmart's business; I struggle with this balance sheet.
My Take
The retailer stands with a lot of debt on hand and really not that much cash. That said, Walmart remains a cash flow beast. While I am sure that management would like to preserve the $0.83 per year dividend that yields 1.2%, I would have no problem seeing Walmart divert the rest of that free cash toward debt repayment and away from the repurchase of common stock. The current authorization left $14.5 billion as of quarter's end. That would do a lot to improve the quality of this balance sheet.
All that said, the business is outperforming expectations, and full-year projections have, still quite conservatively, been increased. This retailer is primed for what will likely be, if I am right about a tough economy, a banner next year or two.
Nice two year run, ain't it?
The stock, after this gap "up" opening, now runs well above all of its key moving averages. Relative strength is suddenly knocking on the door of becoming technically overbought. The daily Moving Average Convergence Divergence indicator, after posturing itself bearishly for about a month, has reversed and now looks bullish with the 12-day exponential moving average crossing above the 26-day EMA and the histogram of the 9-day EMA moving above the zero-bound.
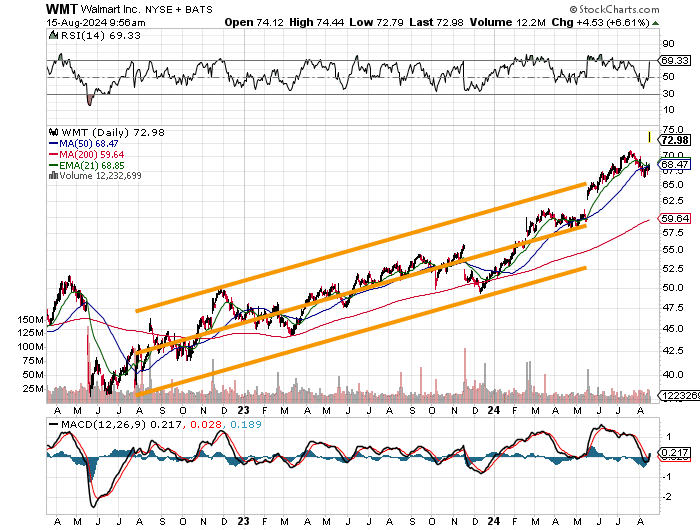
If one considers the central trendline of this Pitchfork model to be the pivot, the long Walmart crowd can optimistically target $88.
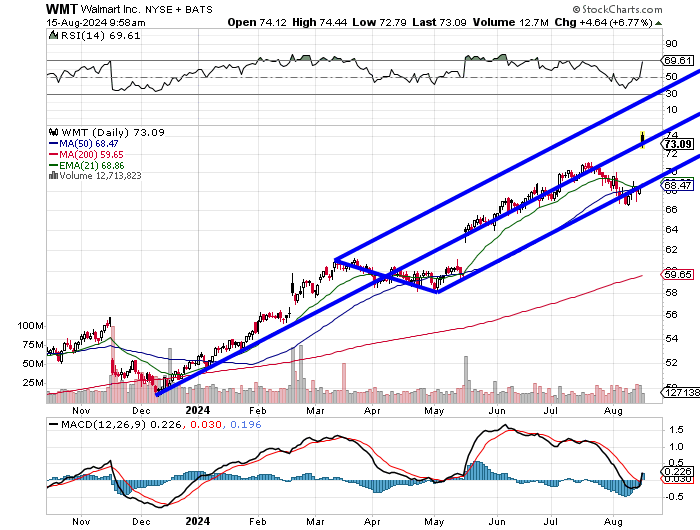
We do know that there is support at the lower trendline that runs concurrently at the moment with the stock's 50-day simple moving average. Losing that lower trendline would be my panic level for now.
Readers will have to keep in mind that there are now two unfilled gaps in the stock's recent past. That would be the one from this morning and the one from back in May that would need to see the shares trade at $59 to fill. That is a risk.
At the time of publication, Guilfoyle was long WMT equity.
