Two Methods of Scaling Stock Charts
Here's when and why each should be used.
You've reached your free article limit
You've read 0 of 1 free Pro articles.
Each day on TheStreet Pro subscribers see me break down the charts and indicators of individual stocks, ETFs, currencies, commodities and the like. However, I also like to provide more "educational" content that helps explain technical analysis from a higher view — and that forms the basis of my work here analyzing the markets and securities.
There are two methods of scaling the various kinds of charts you can work with — arithmetic or logarithmic price scales. Both of these methods are important and it is good to know when and why each should be used. Better software packages permit both scaling methods.
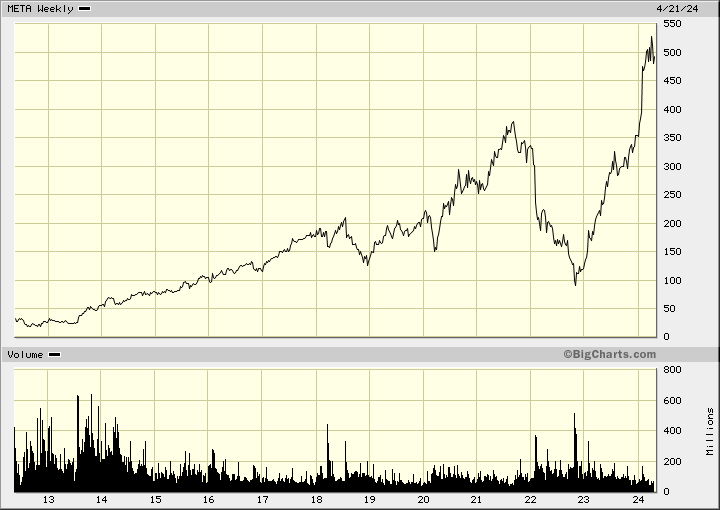
Arithmetic Scaling
The majority of charts you will encounter will be displayed on an arithmetic scale, which plots the units of measure using the same vertical distance. The distance from 1 to 2 will be the same distance between 11 and 12 or 32 and 33.
The scale that runs up the right or left side of the graph is designed to encompass a particular range. This method of plotting prices is fine in most instances, but long-term movements tend to need adjustment.
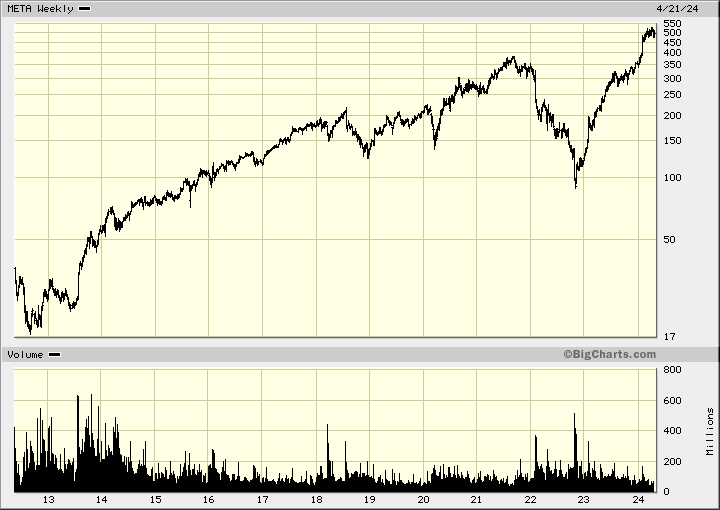
Logarithmic Scaling
Logarithmic (or log or ratio scale) charts are often used for a quick check of relative performance as well as long-term trend analysis. Securities plotted on a logarithmic scale use identical vertical distances on the chart to show identical percentage moves. Some of the high-flying technology stocks have soared from their IPO prices and looking at the moves as percentages may put them in perspective.
Think about the movement of the Dow Jones Industrial Average (DJIA) over the past 100 years. Today, a move of 100, 200, 300 or even 400 points in a day seems like a normal fluctuation.
With the DJIA trading around 40,000 a 1-400 point swing is only 1%. In the early 1930s, when the DJIA was on its way down from around 300 to 40 or 50 points, a 10-point swing could have been a 20% or 25% move.
More Technical Analysis Education
- Overcoming the Pitfalls in Real-World Technical Analysis
- Moving Averages Don't Lie. Here's How to Use Them
- How to Use Price Momentum to Spot Turning Points
Because of the higher levels of the popular stock market averages today compared to only 20 or 30 years ago, movements in the major averages are now displayed in points and in percentage changes by the financial media.
Another key characteristic of logarithmic charts is that intermediate and long-term trend lines are rarely penetrated unless a trend reversal of more than just a passing significance is developing.
Employees of TheStreet are prohibited from trading individual securities.