Spotify: How Does Potential Upside of 16% Sound?
The shares are firmly above the rising 50-day moving average line and above the rising 200-day moving average line.
You've reached your free article limit
You've read 0 of 1 free Pro articles.
Shares of Spotify SPOT were upgraded Monday by TheStreet's Quant Ratings service. When I wrote about SPOT on December 28 I said "Traders looking to go long SPOT should be patient and see if prices successfully retest the rising 50-day moving average line before hitting the buy button."
The shares got a little closer to the 50-day line in early January, so let's check the prices again.
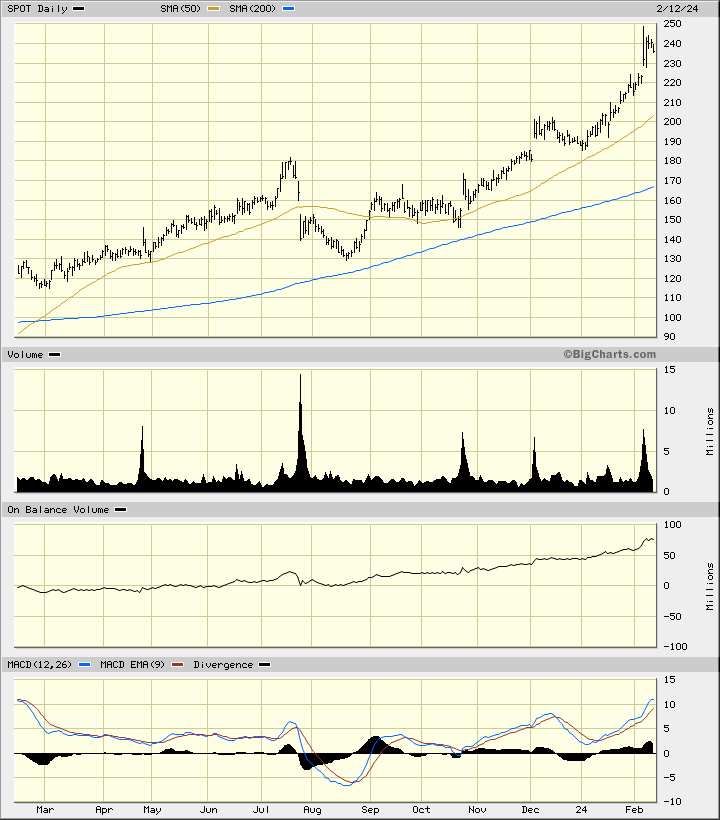
In the daily bar chart of SPOT, below, I can see that the shares dipped into early January and then started a strong rise into February. The stock is firmly above the rising 50-day moving average line and above the rising 200-day moving average line.
The On-Balance-Volume (OBV) line shows us a steady rise the past year. The Moving Average Convergence Divergence (MACD) oscillator is in a bullish alignment above the zero line.
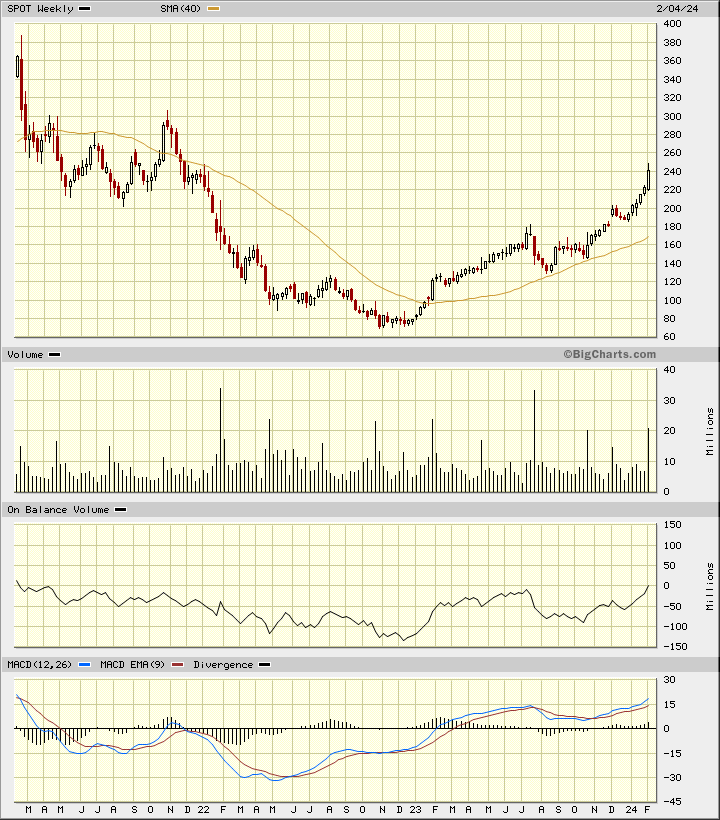
In the weekly Japanese candlestick chart of SPOT, below, I see a positive-looking setup. Prices are in an uptrend and trade above the rising 40-week moving average line.
The OBV line shows gains for more than a year now. The MACD oscillator is bullish.
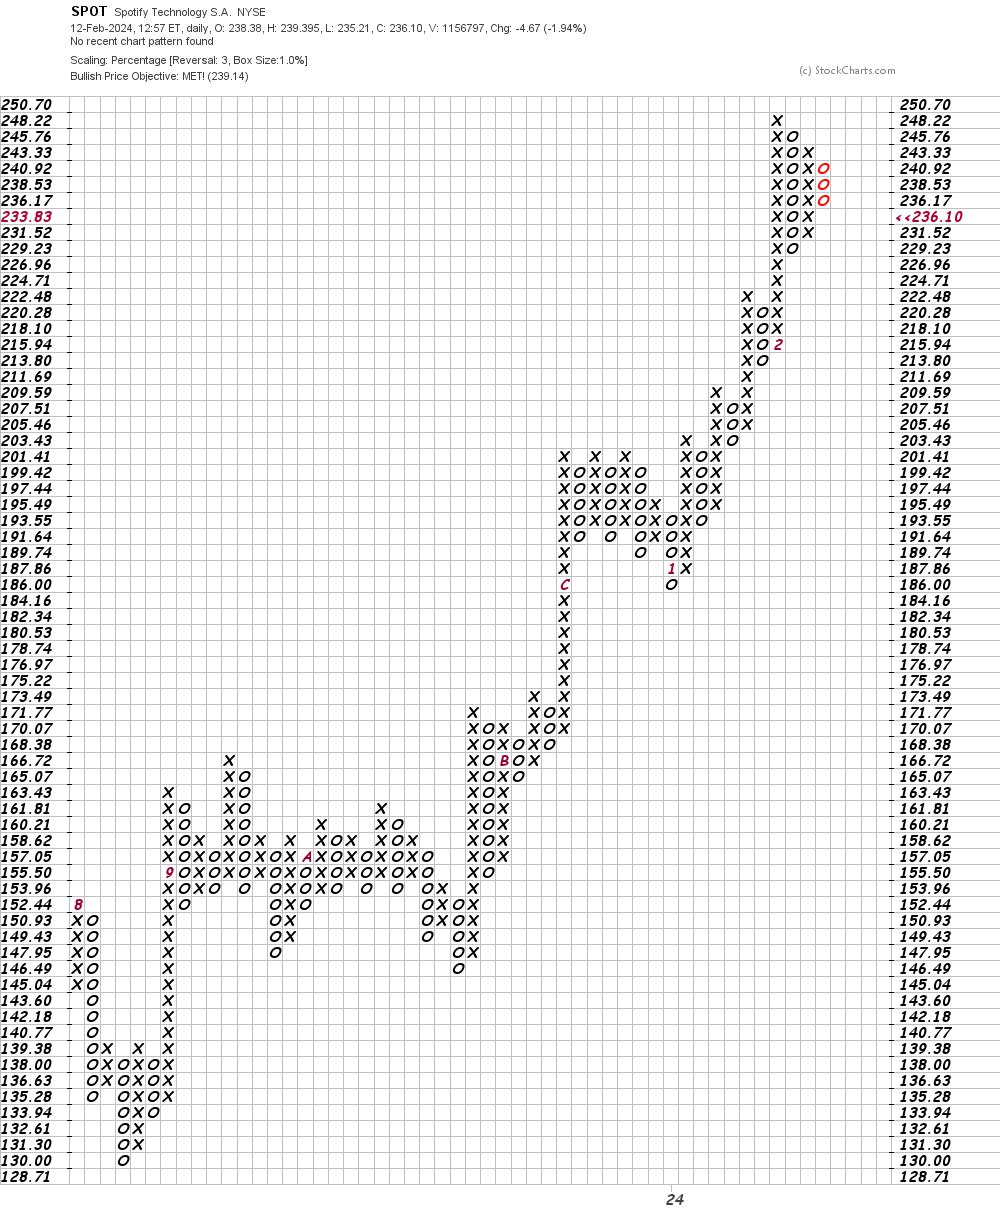
In this daily Point and Figure chart of SPOT, below, I can see that the shares reached and exceeded an upside price target in the $239 area.
In this weekly Point and Figure chart of SPOT, below, I used a five-box reversal filter, which suggests a price target in the $273 area.
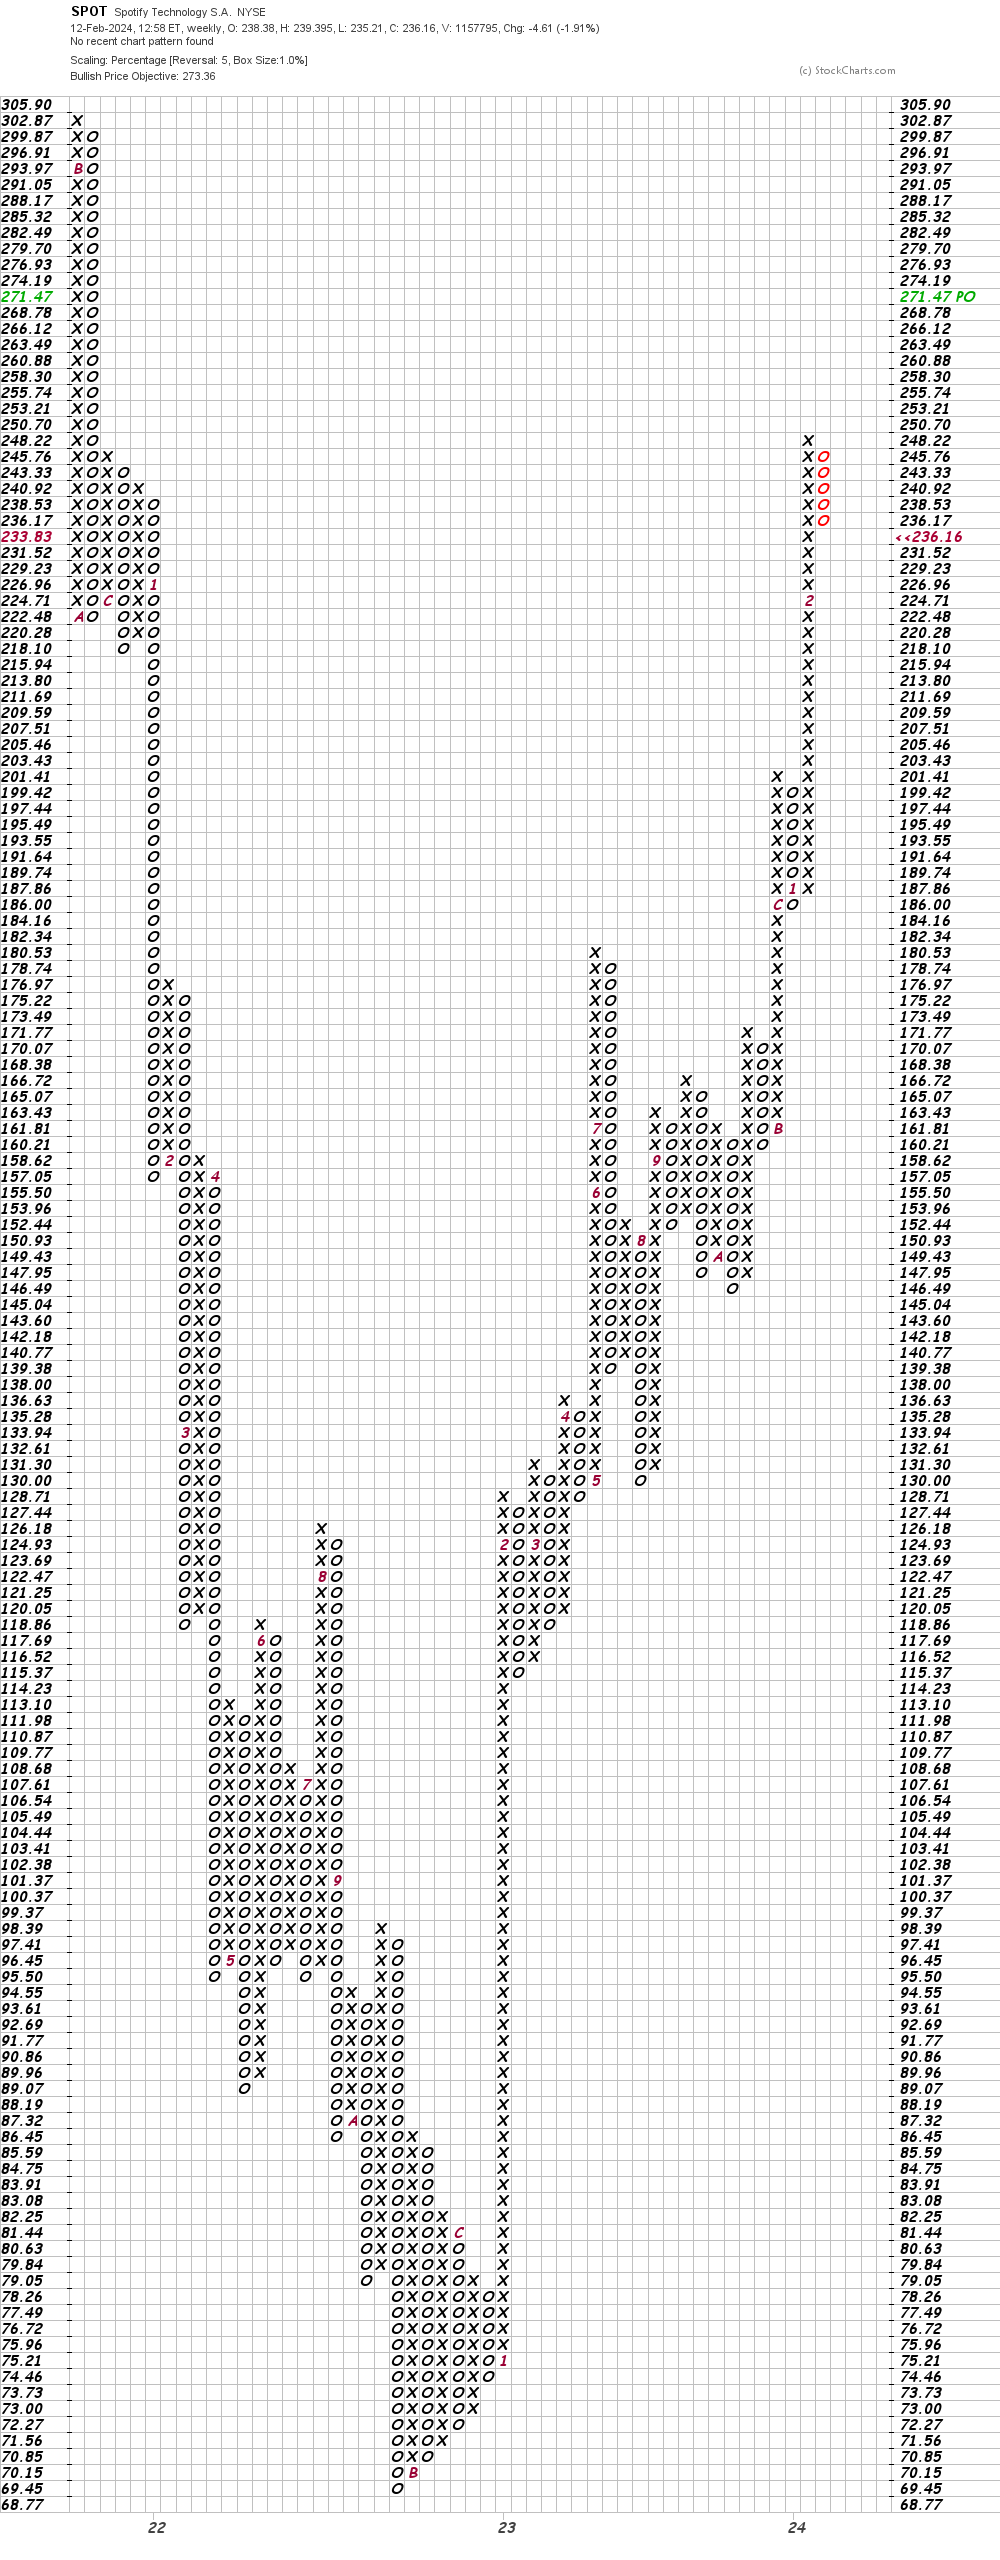
Bottom-line strategy: Traders who are long or looking to go long SPOT should risk to $215. The $273 area is my price target.
Employees of TheStreet are prohibited from trading individual securities.