I Underestimated Splunk's Upside, But Where Should Traders Step In?
SPLK was upgraded by TheStreet's Quant Ratings Service on Monday.
You've reached your free article limit
You've read 0 of 1 free Pro articles.
In my August 24 review of the charts and indicators of Splunk SPLK , I was not impressed and wrote that "Shares of SPLK were trading higher in the early going, but I am inclined to take a pass on this early strength." It turns out that SPLK continued to advance despite my reluctance.
SPLK was upgraded by TheStreet's Quant Ratings Service Monday, so let's go back to the drawing board.
In this updated daily bar chart of SPLK, below, I can see that prices have grinded higher the past two weeks. The trading volume has not increased on this trade higher and that is an issue. Prices are above the rising 50-day moving average line and above the 200-day line.
The daily On-Balance-Volume (OBV) line turned higher in the past two weeks to tell me that buyers of SPLK have been more aggressive than sellers. The Moving Average Convergence Divergence (MACD) oscillator is above the zero line but narrowing, which suggests that the trend-strength is weakening.
In this weekly Japanese candlestick chart of SPLK, below, I see a promising looking picture with no signs of a top reversal. Prices have worked higher after bouncing off the rising 40-week moving average line. The weekly OBV line has been steady since last September. The MACD oscillator is above the zero line.
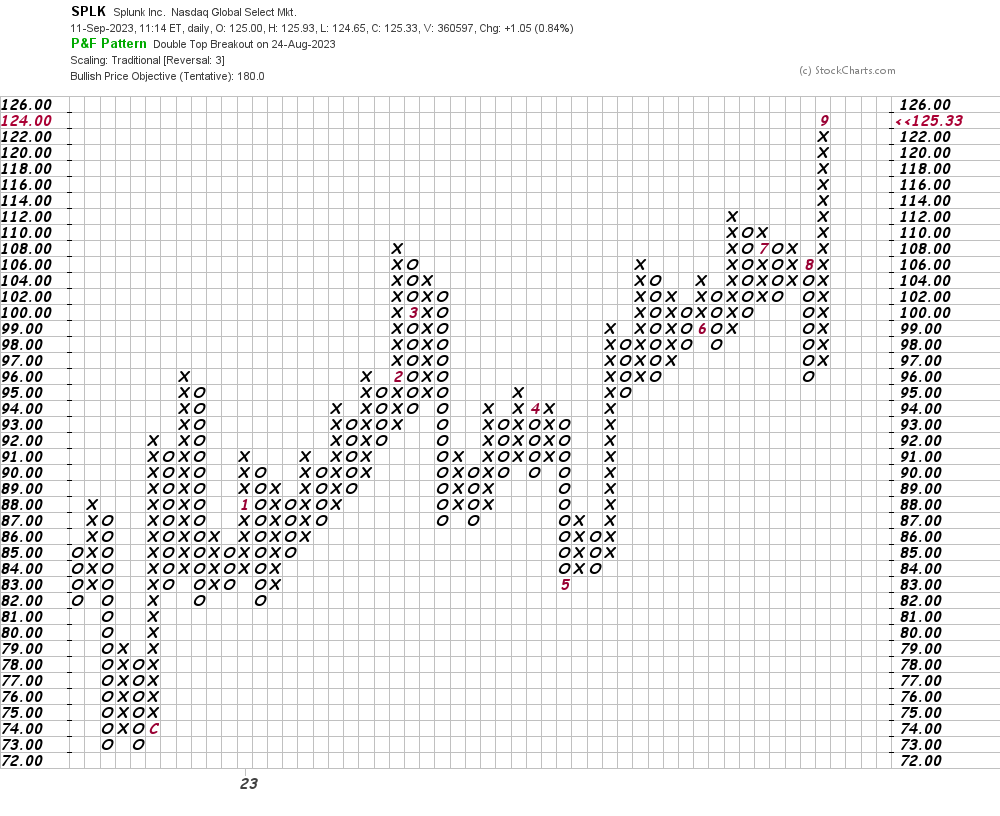
In this daily Point and Figure chart of SPLK, below, I can see that the software is projecting a price target in the $180 area.
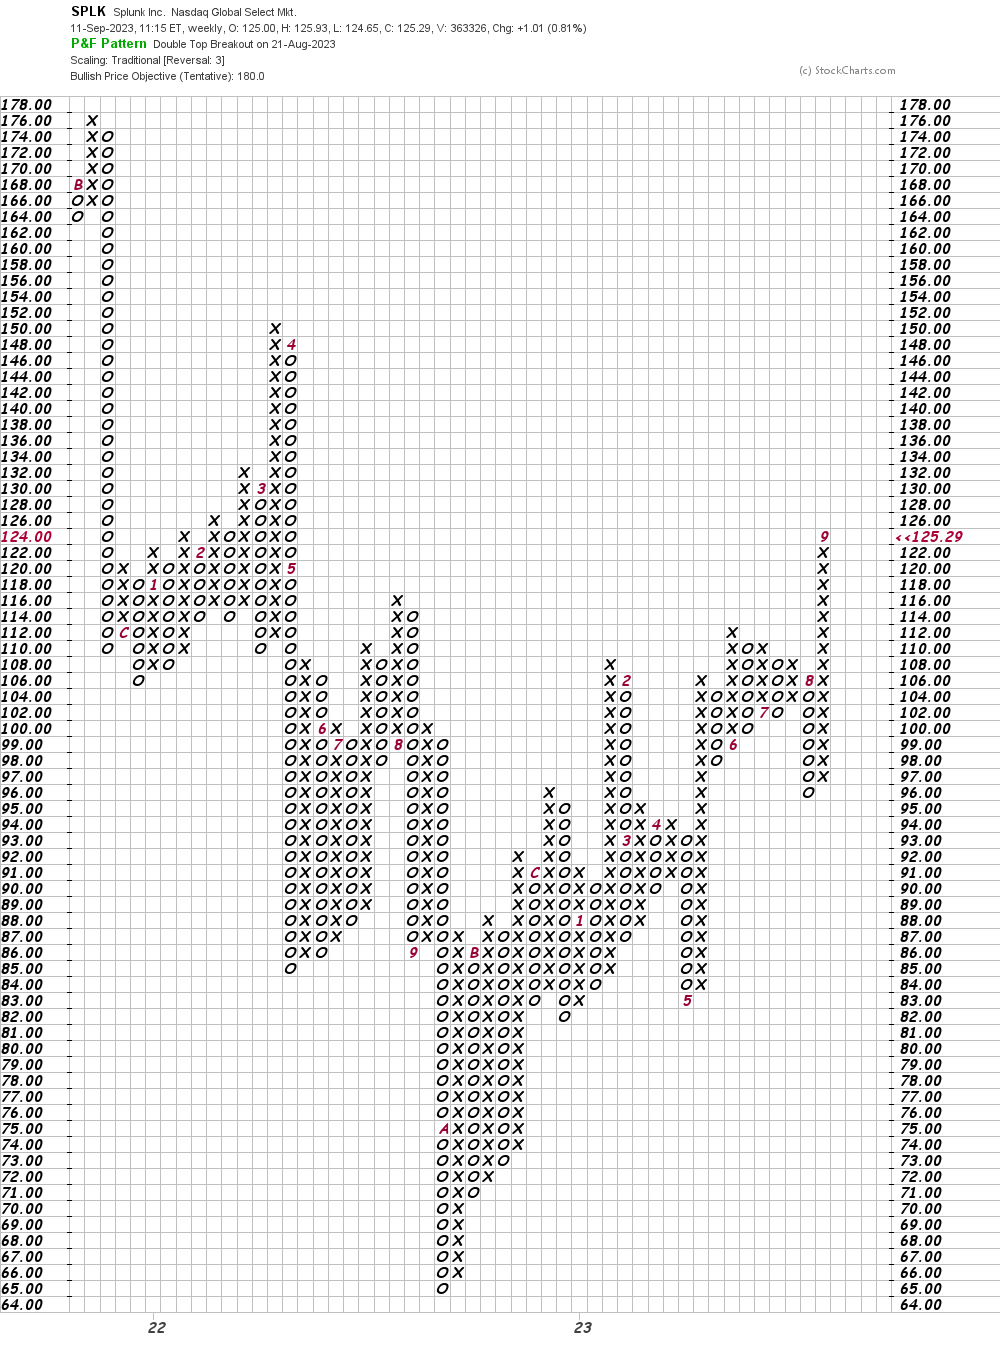
In this weekly Point and Figure chart of SPLK, below, I can see a price target of $180, just like the daily Point and Figure chart.
Bottom line strategy: I underestimated the upside on SPLK in my last review. SPLK looks like it can work higher but the question is where should we be a buyer - on a pullback to $120 risking to $112.
Employees of TheStreet are prohibited from trading individual securities.