At What Level Should Recent Nvidia Buyers Get Nervous?
If share prices gets below these levels we could see newer buyers get anxious.
You've reached your free article limit
You've read 0 of 1 free Pro articles.
If you do a Google search for Nvidia NVDA you get about 636,000,000 results (in just 0.53 seconds). Not as many as you might get on a search for Apple AAPL, but still a lot of attention.
One source I checked online told me that NVDA received 82 "Buy" ratings, six "Hold" Ratings, and two "Sell" ratings in the past month. This makes me wonder whether the boat is pretty full, so to speak.
Let's check out three NVDA charts.
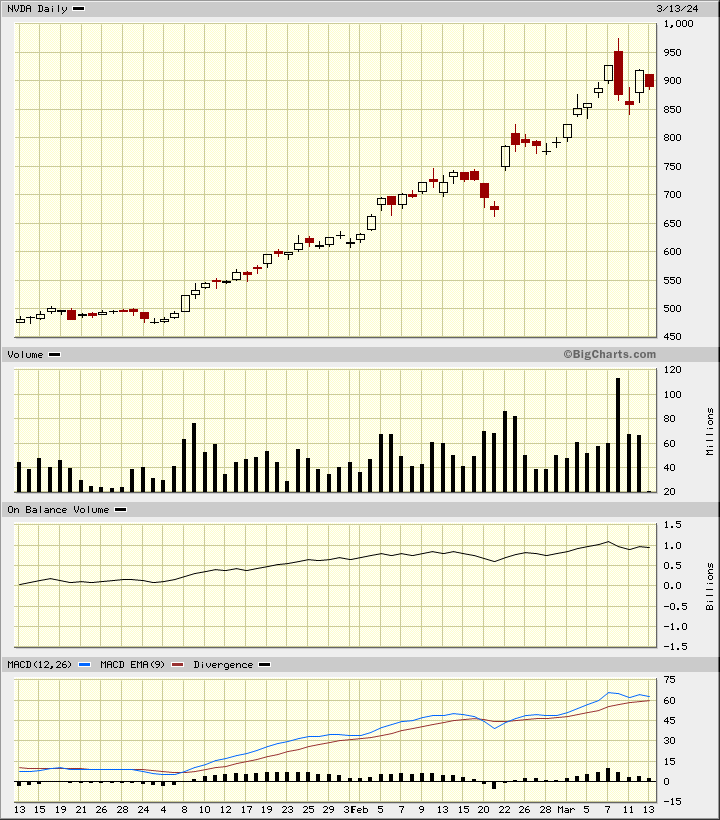
In this first chart I look at the last few "hectic" months. Notice the large bearish engulfing pattern last week? Notice the heavy trading volume when prices hit $950 per share? Notice how the Moving Average Convergence Divergence (MACD) oscillator narrowed in recent sessions telling us that the "trend strength" is weakening?
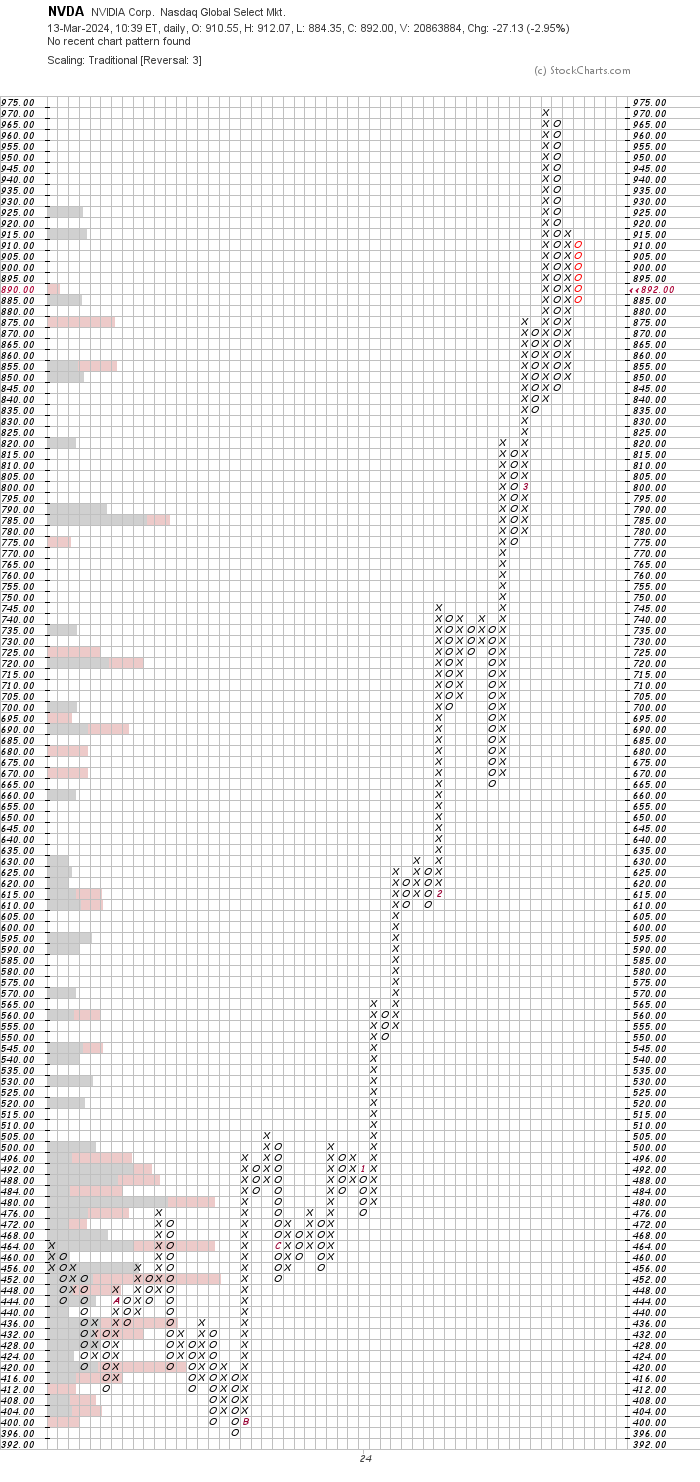
In this second chart of NVDA, below, I applied the Point and Figure approach with an overlay with volume at price. Notice the volume bars on the left scale at $915, $875 and $855? This tells me that if prices gets below these levels we could see recent buyers of NVDA get anxious.
In this third chart I present hourly candlesticks on NVDA over the past 10 days. Weakness below $855-$840 could cause further declines.
Bottom-line strategy: Wall Street likes "buy and hold" and you probably heard a chant of "own NVDA and don't trade it." All that is well and good but what if you did not buy NVDA two years ago or even one year ago? What if your cost basis is much higher?
At what level might you get nervous?
Asking for a friend.
Employees of TheStreet are prohibited from trading individual securities.