As MongoDB Tumbles to Test Key Moving Averages, Here's What Could Happen Next
Shares have moved higher over the past 12 months but it has taken a lot of patience and enduring many pullbacks.
You've reached your free article limit
You've read 0 of 1 free Pro articles.
Shares of MongoDB MDB tumbled Friday after the company's fiscal 2025 guidance disappointed investors. Let's check out the charts and indicators of this "open source NoSQL database management" company
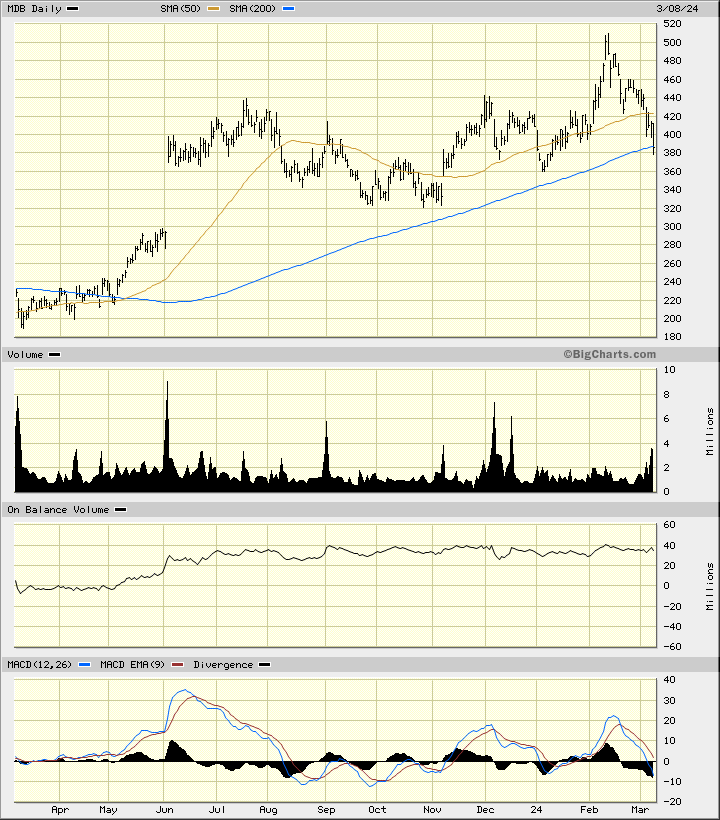
In the daily bar chart of MDB, below, I see a chart picture that looks hard to trade in real time. The shares have moved higher over the past 12 months but it has taken a lot of patience and enduring many pullbacks. Prices turned lower in early February and have broken below the rising 50-day moving average line and are now testing the rising 200-day moving average line.
Trading volume has started to increase in March while the daily On-Balance-Volume (OBV) line has been neutral/flat since the middle of 2023. The Moving Average Convergence Divergence (MACD) oscillator turned lower in early February and is close to crossing below the zero line now.
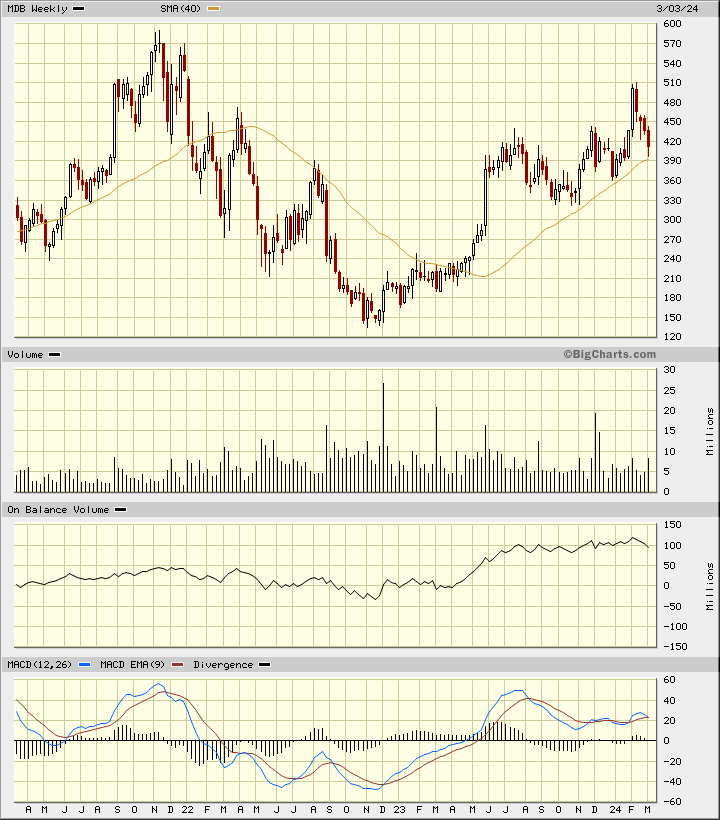
In the weekly Japanese candlestick chart of MDB, below, I see some weakness developing or playing out. The shares have declined to test the rising 40-week moving average line.
The weekly OBV line has turned lower and the MACD oscillator is crossing to the downside.
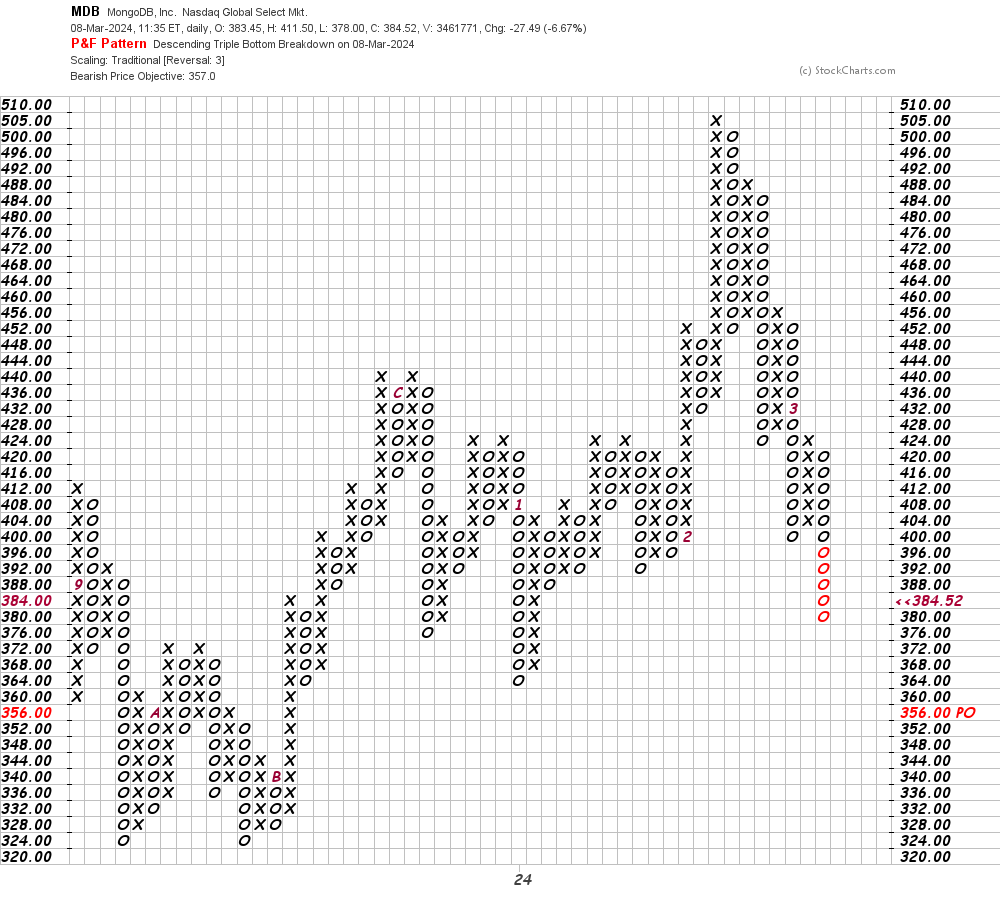
In this daily Point and Figure chart of MDB, below, I can see a downside price target in the $357 area.
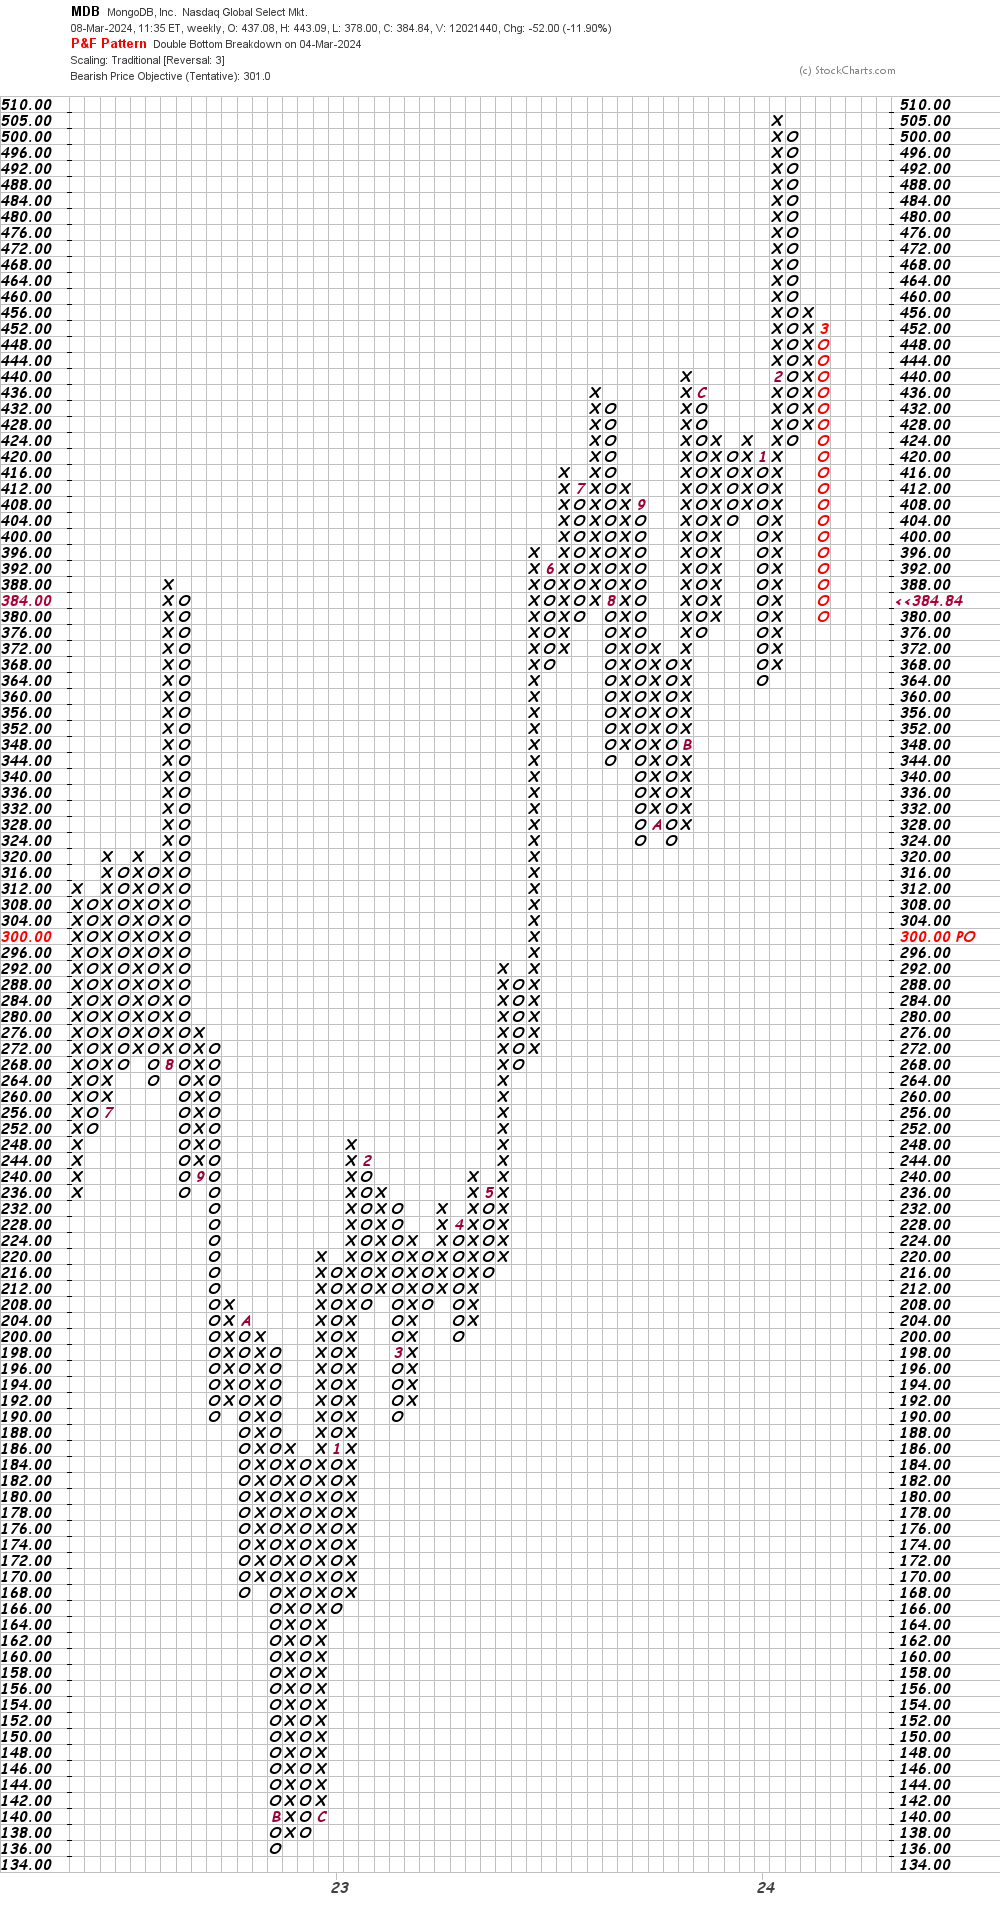
In this weekly Point and Figure chart of MDB, below, I can see a price target in the $301 area.
Bottom-line strategy: Overall the charts of MDB look vulnerable to further declines. Avoid the long side of MDB.
Employees of TheStreet are prohibited from trading individual securities.