Finally Oversold
With Wednesday’s drop, the S&P Short Range Oscillator has finally moved into an oversold (small) at -0.61%.
Position: None
BY Doug Kass · Jun 10, 2026, 7:00 PM EDT
With Wednesday’s drop, the S&P Short Range Oscillator has finally moved into an oversold (small) at -0.61%.
Position: None
BY Doug Kass · Jun 10, 2026, 7:00 PM EDT
I have restablished a trading long rental in the Indices:
* SPY $723.35
* QQQ $690.05
Position: Ling SPY (VS), QQQ (VS)
BY Doug Kass · Jun 10, 2026, 6:29 PM EDT
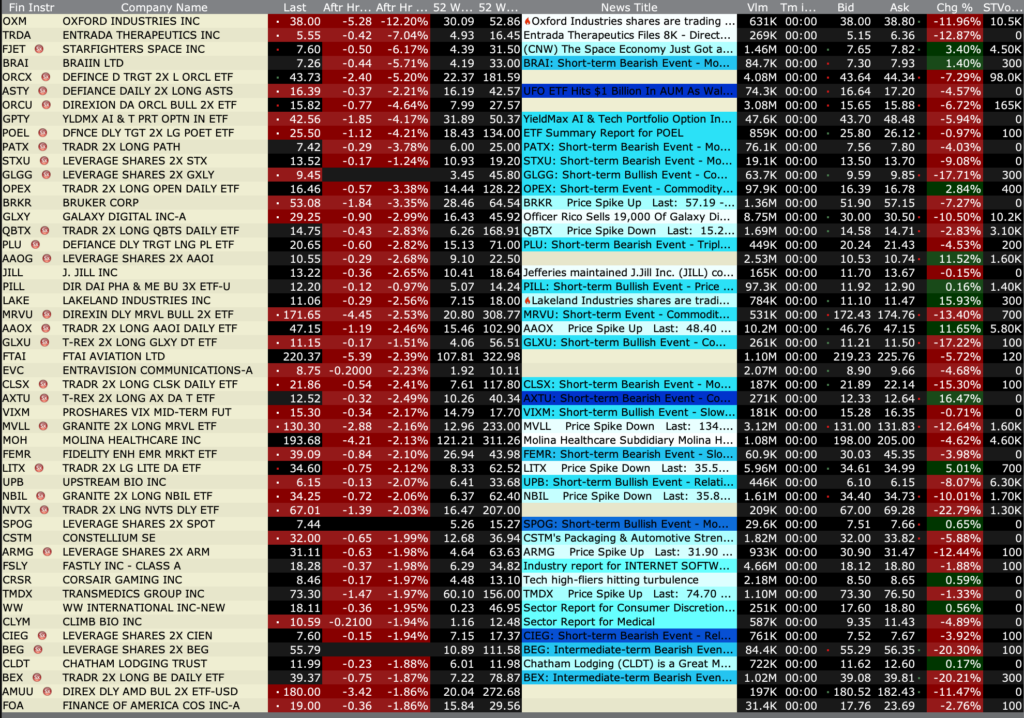
After-Hours % Advancers
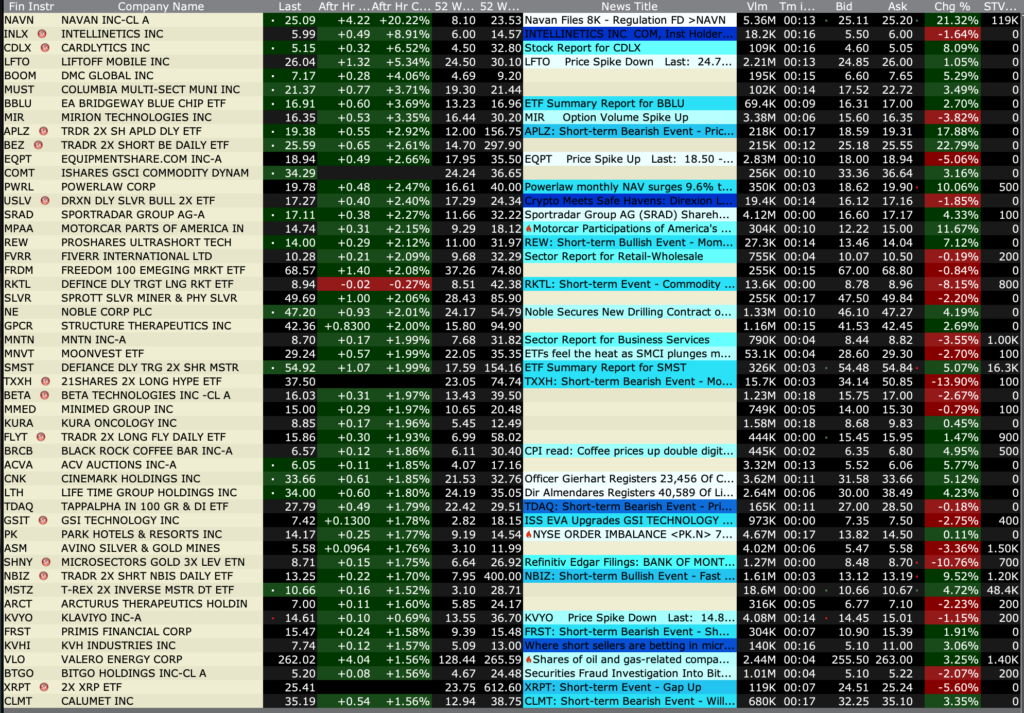
After-Hours % Decliners
Position: None
BY Doug Kass · Jun 10, 2026, 4:35 PM EDT
Closing Volume
– NYSE volume 7% below its one-month average
– NASDAQ volume 5% below its one-month average
– VIX index: up 12.23% to 22.30
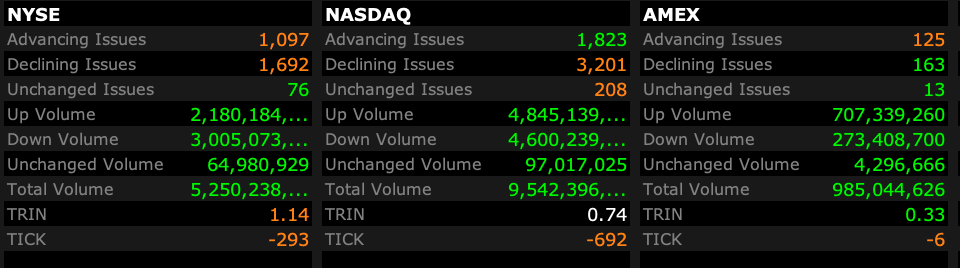
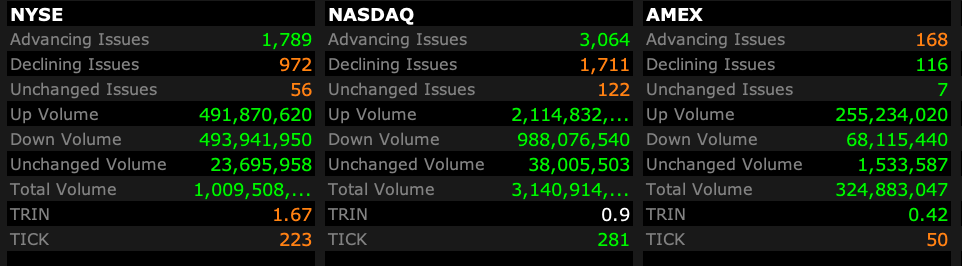
Breadth
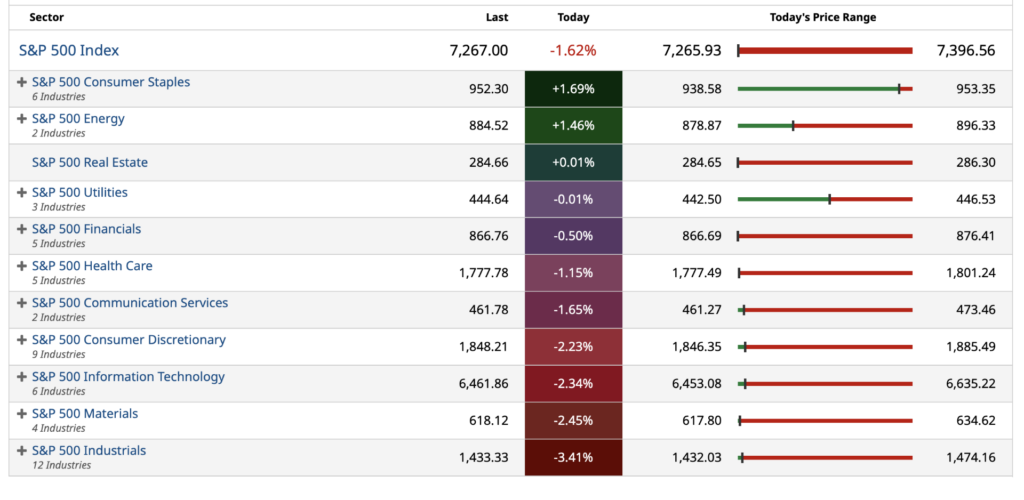
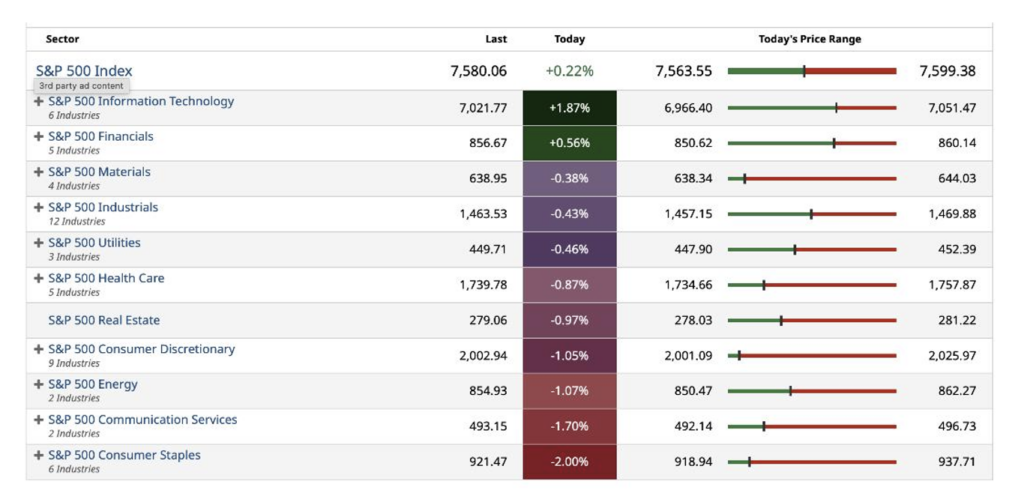
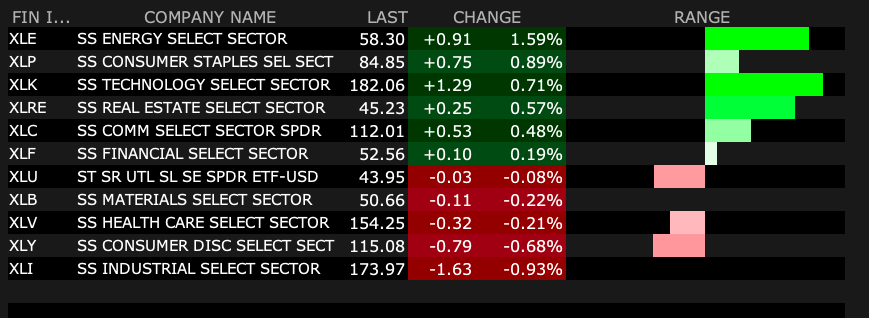
S&P 500 Sectors
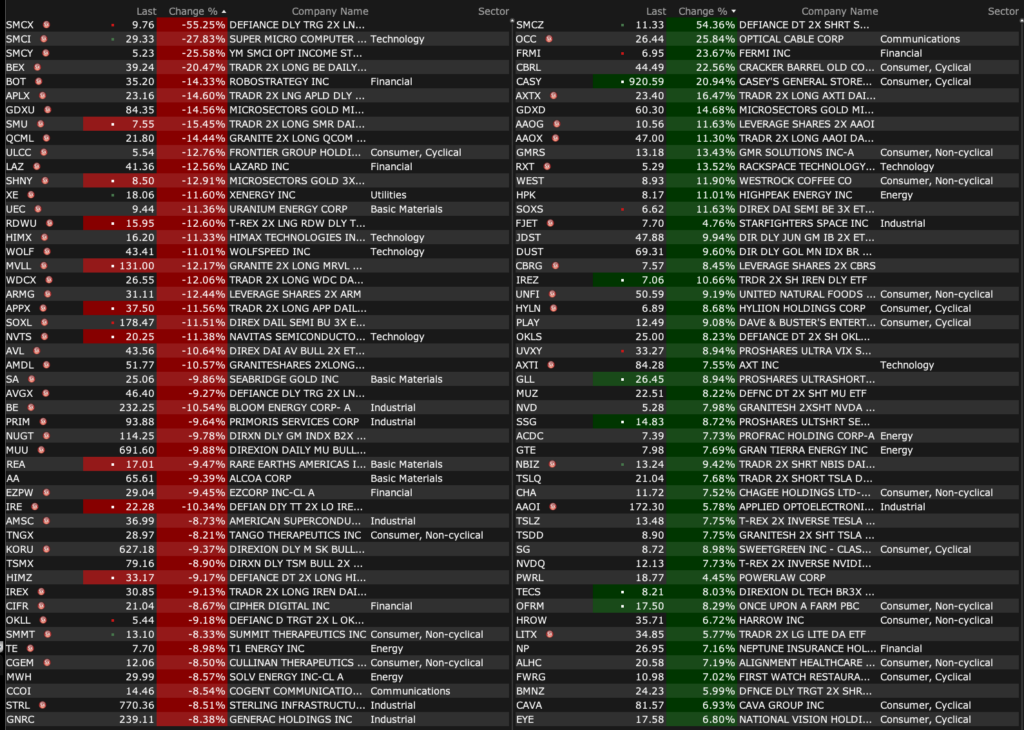
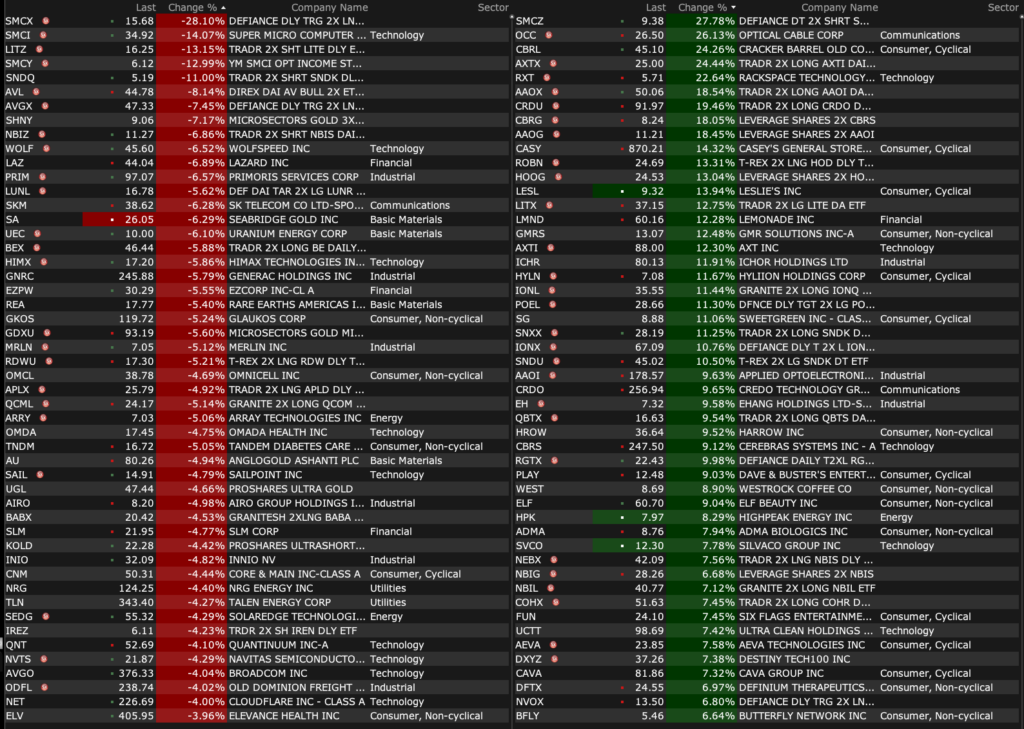
% Movers
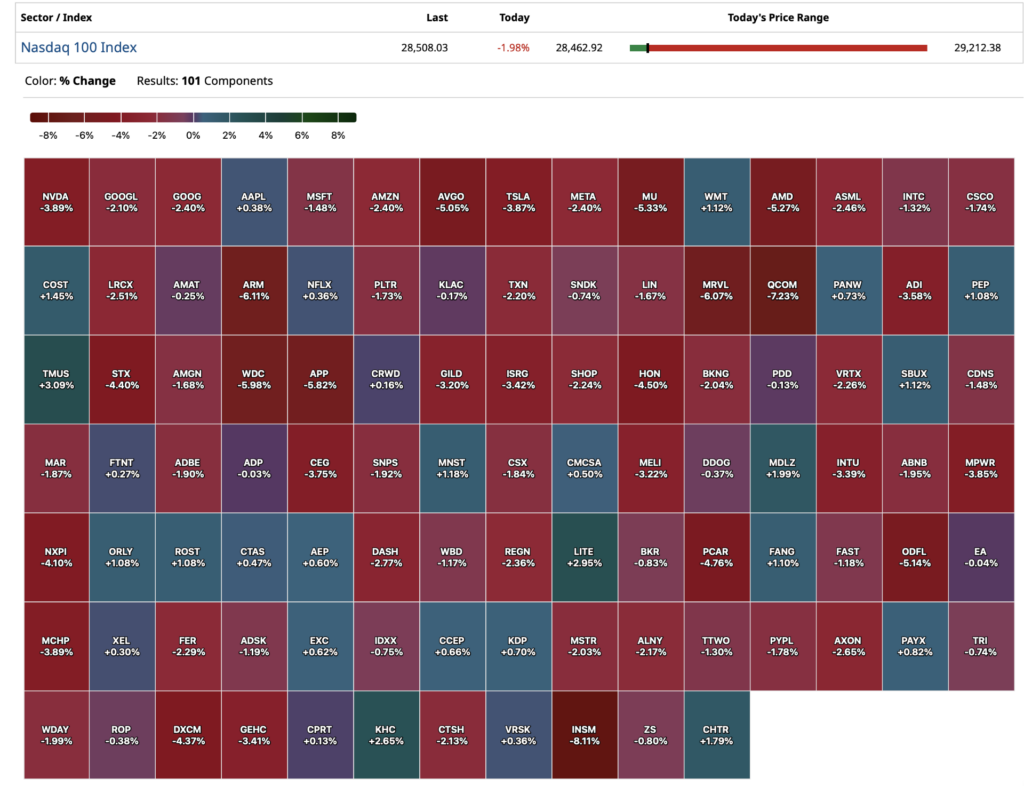
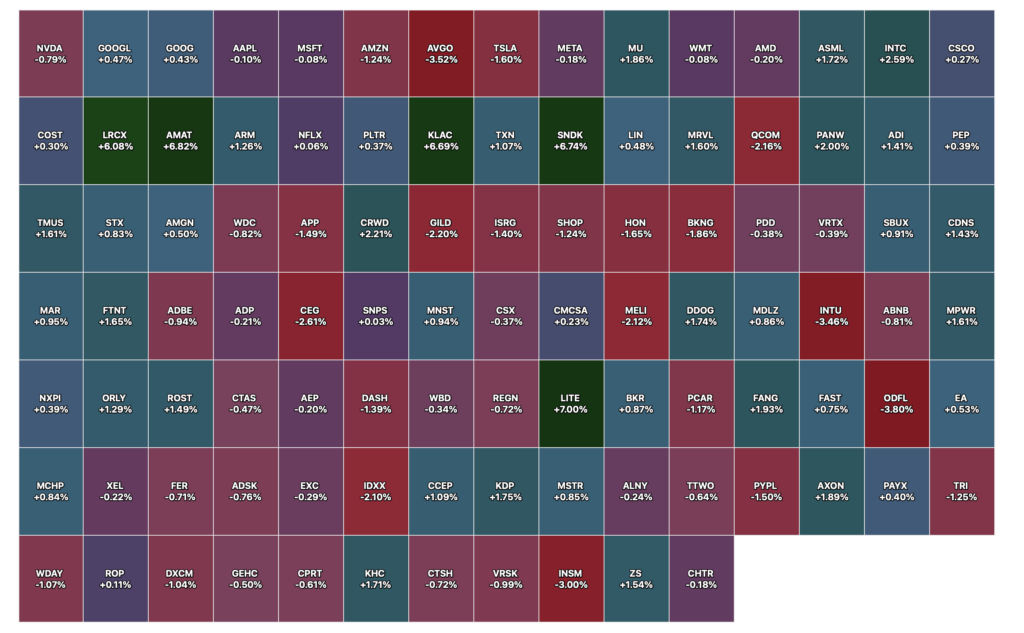
Nasdaq 100 Heat Map
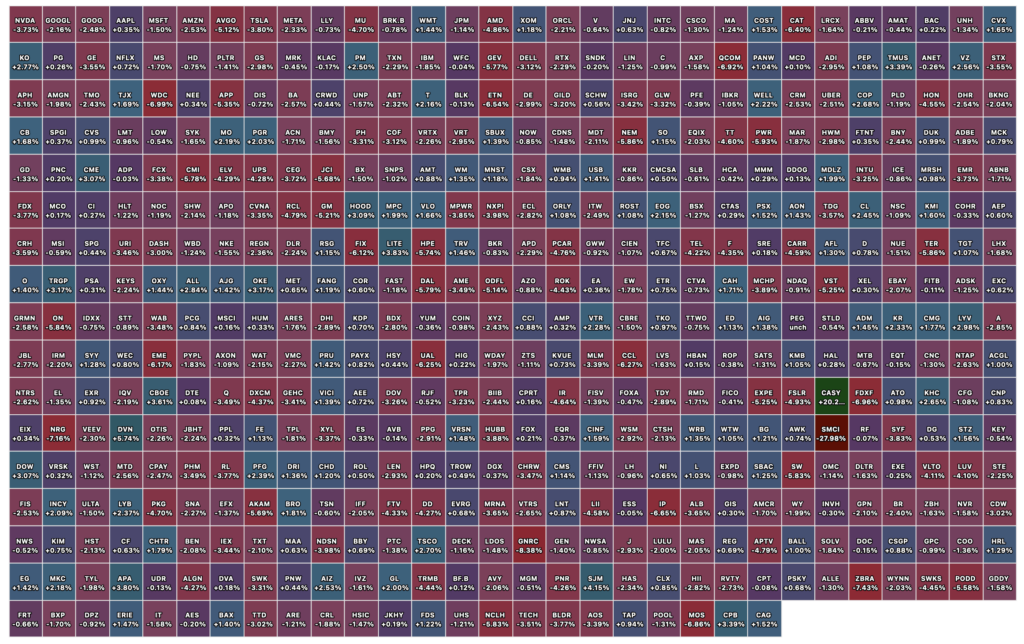
Closing S&P 500 Heat Map
Position: None
BY Doug Kass · Jun 10, 2026, 4:26 PM EDT
“There was this kid I grew up with – he was younger than me. Sorta looked up to me – you know. We did our first work together – worked our way out of the street. Things were good, we made the most of it. During Prohibition – we ran molasses into Canada – made a fortune – your father, too. As much as anyone, I loved him – and trusted him. Later on he had an idea – to build a city out of a desert stop-over for GI’s on the way to the West Coast. That kid’s name was Moe Green – and the city he invented was Las Vegas. This was a great man – a man of vision and guts. And there isn’t even a plaque – or a signpost – or a statue of him in that town! Someone put a bullet through his eye. No one knows who gave the order – when I heard it, I wasn’t angry; I knew Moe – I knew he was head-strong, talking loud, saying stupid things. So when he turned up dead – I let it go. And I said to myself, this is the business we’ve chosen – I didn’t ask who gave the order – because it had nothing to do with business!”
– Hyman Roth, Godfather (Part II) “This is the business we’ve chosen” – YouTube
Last night I had a discussion with someone in the investment business that everyone knows and that everyone expects. He is my godfather, so to speak, in the investment business.
I had asked him to constructively criticize my “It Is Not Different This Time” column which was published on June 2, 2026 and outlined my negative market outlook.
This friend/goat is not one that gives compliments easily. He is tough on his organization and even tougher on himself. He is worth billions of dollars and has one of the best investing records extant.
To my surprise, my source said the stacking and compilation of my charts and analysis was among the best macroeconomic distillation he has seen and is even using some of my arguments in a presentation on investing he is making in the coming weeks.
I don’t write this to gloat.
I spend a great deal of time developing my market view and communicating it to all of you. As you all know, I am often wrong and always in doubt.
My work is original, not the product of ChatGPT or Grok. It represents my primary analysis and is time consumptive (which explains why I start work at 4 AM every morning and typically end my day at around 630 PM).
Here is the complete column for emphasis — “I’m going to take a nap. When I wake up, if the money is on the table, I’ll know I have a partner. If it isn’t, I’ll know I don’t”:
——–
BY DOUG KASS · Jun 2, 2026, 11:30 AM EDT
* Market risks are greatly under appreciated in the current ‘Bull Market in Complacency’
* By my calculus there is 3-times or more downside than upside presently
Equities, contrary to our expectations, continued to ramp higher during the last month.
The last several weeks have felt like a battle in which I have felt much like the Greek mythological character Sisyphus who was punished by the gods for cheating death and who was condemned to eternally roll a boulder up a hill, only for it to roll back down each time. While the myth symbolizes the endless struggle and futility of human efforts, this morning’s opening missive incorporates what I believe to be a deteriorating fundamental economic and corporate profit proposition on top of stretched valuations – making me feel more like Elpis (the goddess of hope) than Sisyphus as I have growing confidence that my market expectations might be soon realized.
For the second month in a row, it was All Ai All The Time, with large-cap technology the dominant contributor to the market’s rise. Only ten companies contributed to 2/3 of the overall rally over the last eight weeks. (See our comments about the foul market breadth later in this commentary)
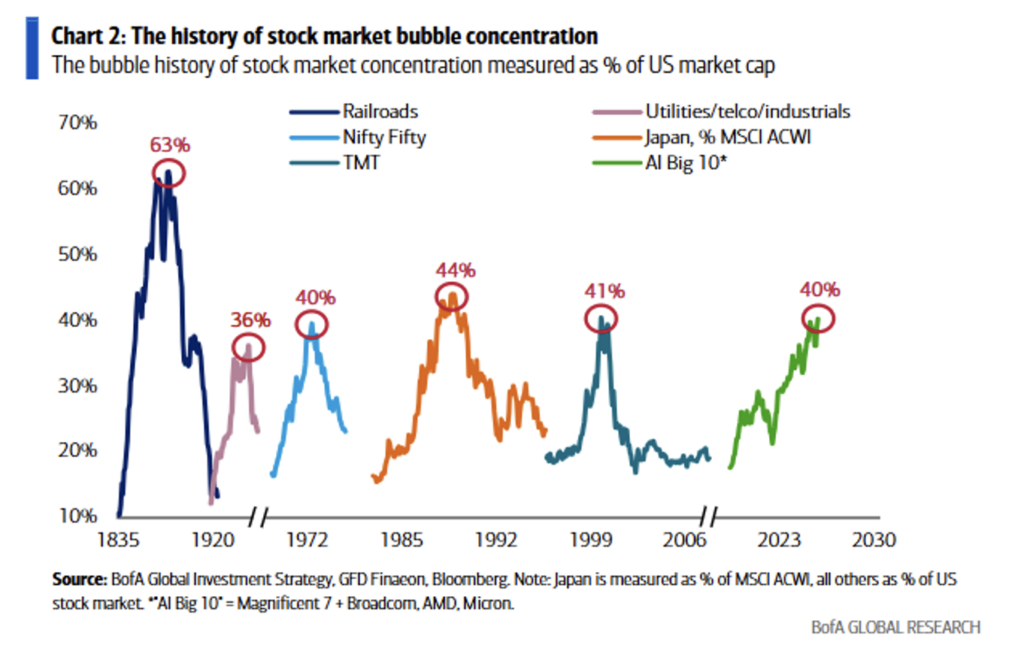
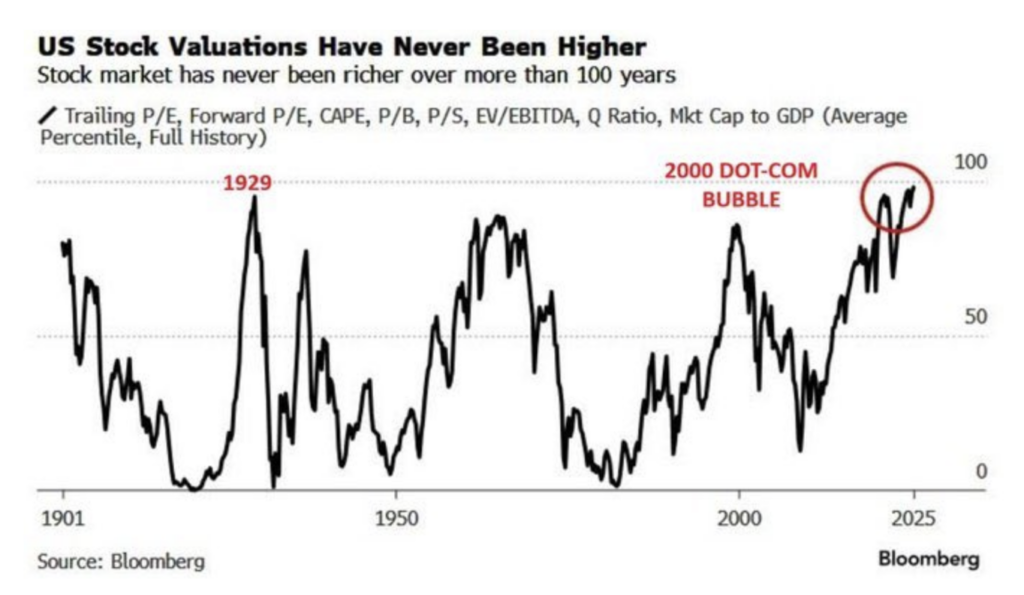
We have not seen a stock market this concentrated around a single theme in 150 years:
As the S&P Index made a new high last week, only 21 stocks also made record highs. By comparison, only 20 stocks made new highs at the March 2000 top. Beyond the aforementioned concentration levels, there has never been a more expensive market in history:
For these reasons and others, I continue to maintain a cautious investing posture in my investment partnership — sitting in a net short exposure.
As subscribers are aware, I have been defensively positioned for some time, in the belief that the reward vs. risk setup was unattractive. With the exception of the brief market dips in 2024 (April), 2025 (February) and 2026 (March) I have maintained my net short exposure. Disappointingly, that strategy did not allow us to take advantage of the opportunity set provided by the market advance over the last two years, which was a period in which caution became the most expensive position on Wall Street.
Despite the net short exposure and a wrong-footed investment view, on a positive note, through a combination of opportunistic trading, good risk control/management and some excellent shorts — we have had a long streak of positive monthly investment performance.
To me, the current AI-driven equity rally increasingly resembles a late-stage speculative bubble: extremely narrow market leadership, stretched valuations (in the 97% percentile), euphoric positioning (and absence of fear), collapsing volatility, massive IPO supply ahead and, of course, excessive concentration in mega-cap tech. Central banks still remain too loose globally, which is prolonging the bubble, but once policy tightening meaningfully bites, the unwind could resemble prior post-bubble rotations (with the historical analogs a combination of 1929, Japan 1989, Dotcom 2000 and China 2007 and The Great Recession (2008-09)).
As noted, I am increasingly confident that my concerns will be reflected in lower stock prices and in today’s commentary I will discuss the equity risk discount, a foundational part of my ursine market outlook.
An increasingly slender sector participation underscores the market’s narrowing leadership, as last Friday’s action demonstrated:
In this past week, the S&P has recorded four consecutive all-time highs while a majority of equities were actually falling. This has never happened before:
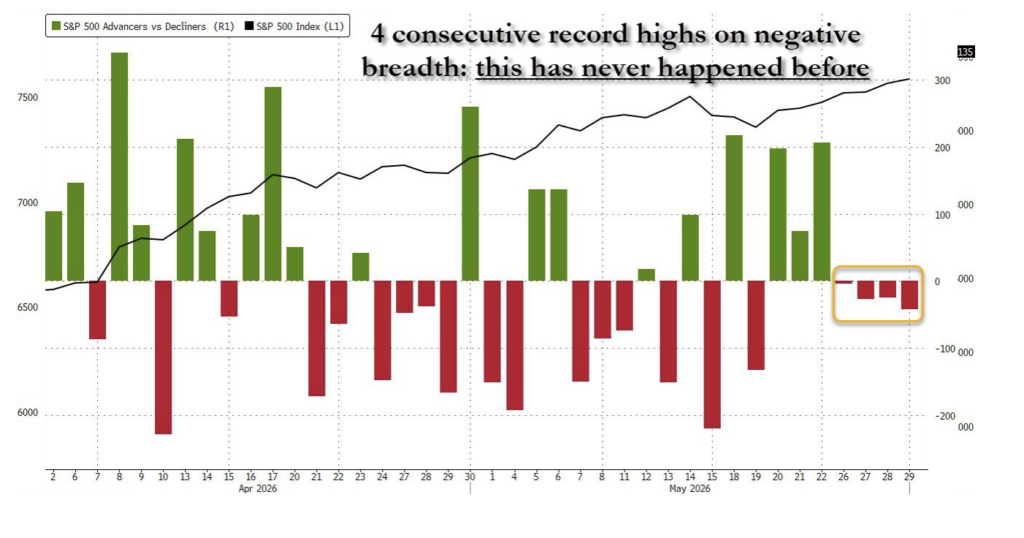
The S&P advance/decline line hasn’t made a new high since April 17, despite multiple all-time highs made by the Index. The last time we had such a divergence was November 2024 to February 2025 and that eventually led to a 20% drop:
Call me “old school,” but I continue to adhere to one of Bob Farrell’s 10 Lessons of Investing:
Lesson #7 Markets are strongest when they are broad and weakest when they narrow to a handful of blue-chip names.
Translation: Breadth is important. A rally on narrow breadth indicates limited participation and the chances of failure are above average. The market cannot continue to rally with just a few large-caps (generals) leading the way. Small- and mid-caps (troops) must also be on board to give the rally credibility. A rally that lifts all boats indicates far-reaching strength and increases the chances of further gains.
Last month I we wrote:
In our view, the markets have ignored the same conditions that set off the January-February selloff. None of the non-war issues that drove stocks lower have been resolved:
* Oil prices are off their highs but are likely to remain elevated because of the magnitude of the supply shock and continued uncertainties related to the Iran conflict.
* Inflation is now rising on a sequential monthly basis – and is higher than before the conflict in Iran.
* Interest rates will be higher for longer.
* The 2026 annual deficit will approach $2 trillion, neither political party show any signs of being fiscally responsible.
* The U.S. debt will hit $40 trillion this year – the cost of servicing the debt is over $1 trillion/year.
* With a burgeoning deficit, stiff debt load and persistent inflation, the Fed’s hands are tied.
* While private equity’s problems are not systemic, the leverage they brought us remains in place. KKR Private-Credit Fund Takes $560 Million Loss – WSJ
* The enormous amount of money spent on AI will probably never see an adequate return on investment. As noted by Stan Druckenmiller (again!), AI’s societal and transformative impact could rival the internet’s life-changing influence – and so may the stock market consequences (rhyme) be similar:
“If we were all sitting here in 1999 talking about the Internet, I don’t think anybody would have estimated it would be as big as it got in 20 years. And yet, if you bought the Nasdaq in ’99, it went down 80% before that all came to fruition. That’s not going to happen with AI. But it could rhyme – AI could rhyme with the Internet as we go through all this capital spending we need to do. The big payoff might be four to five years from now. So AI might be a little overhyped now but under-hyped long term.”
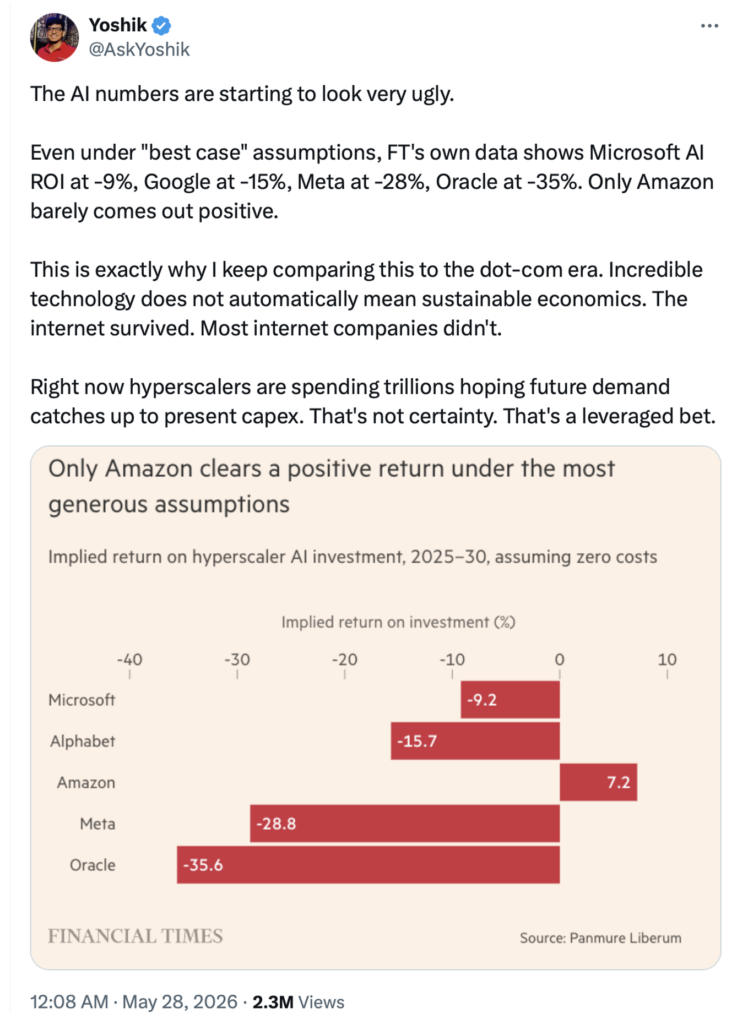
With 45% of the S&P Market Cap AI or AI-adjacent, What if the AI boom… goes in reverse? Panmure Liberum – Strategy
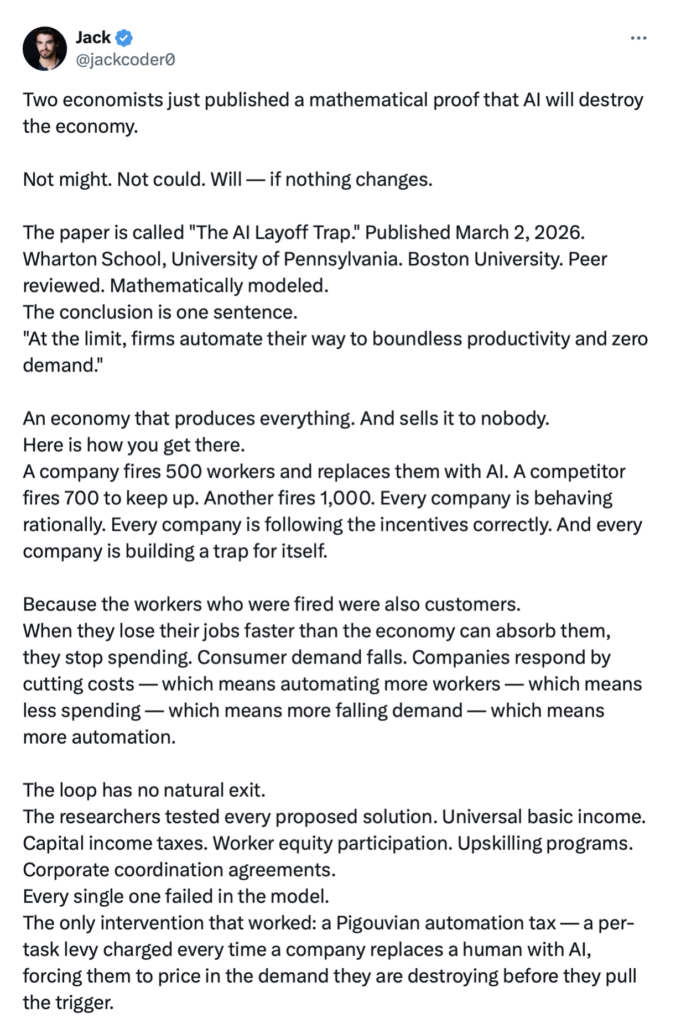
Or even worse, what happens if, at the limit (as two professors have recently written) companies “automate themselves to boundless productivity and zero demand – an economy that produces everything and sells it to nobody:
* Valuations are a terrible clock but a good weather forecast. That valuations are stretched is an understatement. See Cape Shiller above. The Buffett ratio (the total market capitalization divided by GDP) hit an all-time high this week). Most other traditional metrics indicate that equity valuations are in the 97 percentile.
* Many bulls highlight the improving strength in projected 2026 S&P EPS. They argue that this year’s robust growth in profits (at about +17%) – justify current valuations. However, if one takes out Nvidia (NVDA) and Micron (MU), 2026 S&P EPS growth falls to under +10%:
I am increasingly confident that our concerns (are multiplying and intensifying) will be reflected in lower stock prices and in today’s commentary, I will discuss one factor, the equity risk premium (now a discount), which incorporates some of the foundation of our ursine market outlook.
To borrow a phrase from Warren Buffett, the voting machine is overwhelming the weighing machine.
For nearly three years, the markets and its participants have ignored elevated valuations.
How much longer can the S&P 500 and the other major indices deliver upside when price-earnings multiples and equity risk premiums are in the 95th percentile or higher?
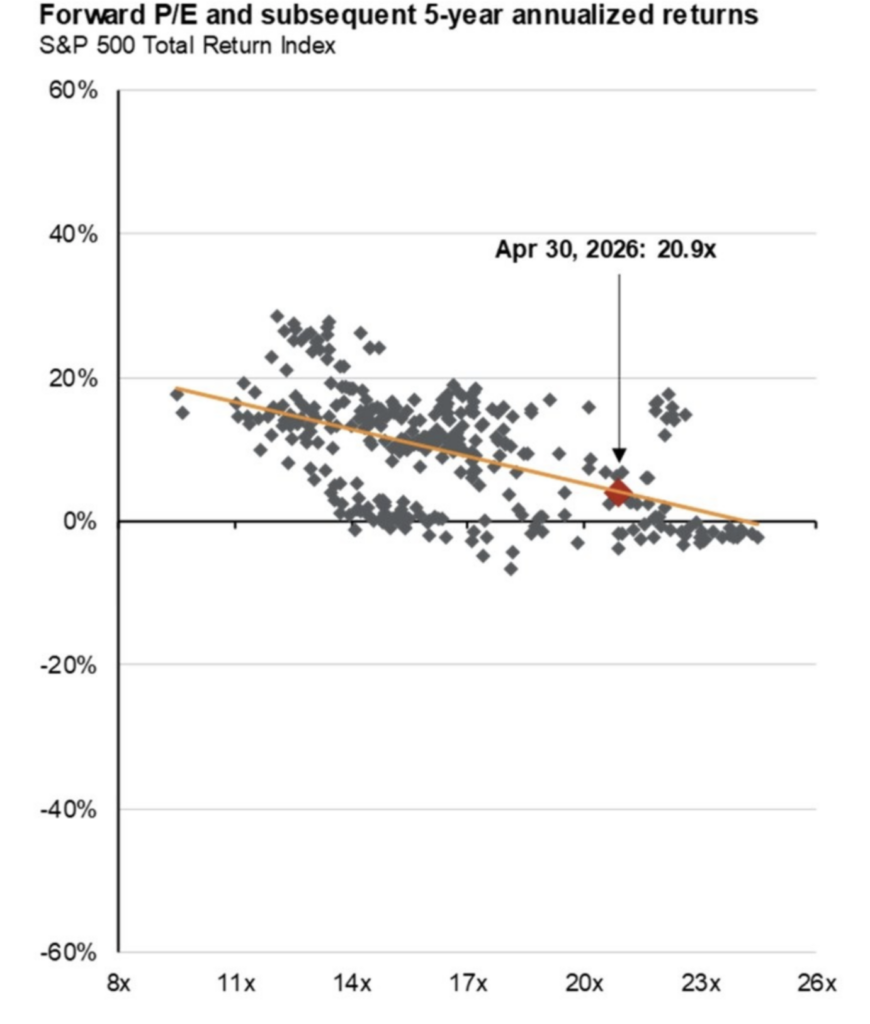
With consensus (I think overly optimistic!) 2026 S&P EPS at $330/share, the senior average trades at 23x and the equity risk premium is negative.
On projected 2027 S&P EPS consensus of $375/share (I think overly optimistic as well) the S&P trades at 20.5x and the equity risk premium is only at 50 basis points, both in the 93rd percentile.
The steady decline in the equity risk premium is a metric I pay very close because. Historically, it has been an excellent indicator future investment returns…
My focus on the ERP has contributed importantly to my incorrect market view and a missed opportunity set on the long side.
Let’s examine the equity risk premium, which is the difference between the S&P earnings yield (the inverse of the P/E ratio) and the risk-free rate (the 10-year Treasury note yield is typically used):
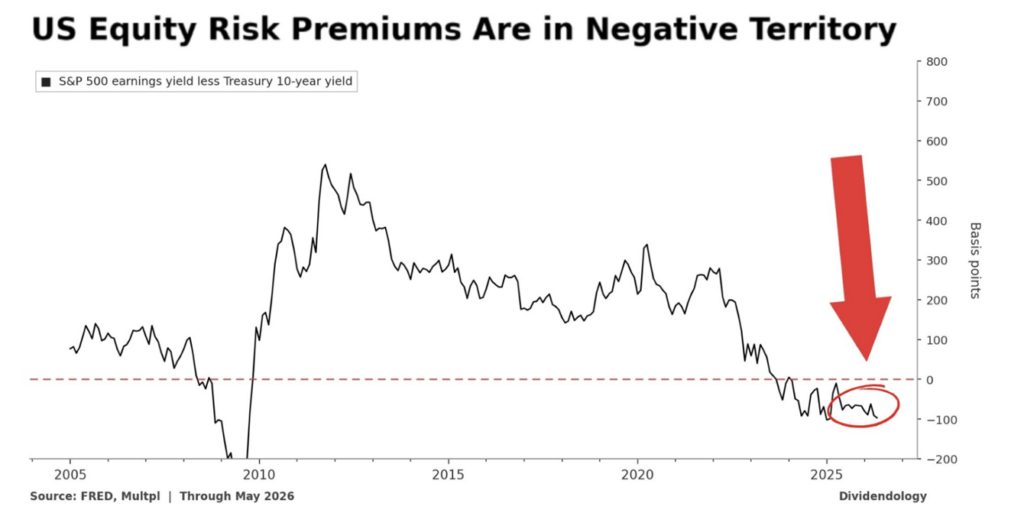
The equity risk premium tells us how much excess return investors are being paid to own stocks over a risk free Treasury bond.
Historically, equities typically offer a three-to-four percent premium over Treasuries. Such a premium makes sense because it compensates investors for volatility, drawdowns and uncertainty.
Right now, according to the chart above, the investor is being paid negative in equities vis a vis bonds. The ratio is saying that holding bonds is more risky than owning stocks — this is a radical notion, at an extreme! Again, this means:
1. Investors are not being paid extra to take on risk in stocks.
2. Stocks are offering similar or worse “yield” than bonds.
3. Valuations are materially stretched relative to interest rates.
Stated simply, this means that holders of equities are taking more risk for less reward (than bonds). When this has happened in the past (most notably during the dot-com bubble and leading up to The Great Recession in 2007-09), forward returns have been somewhere between non-existent and negative:
“What we learn from history is that we do not learn from history.”
– Benjamin Disraeli
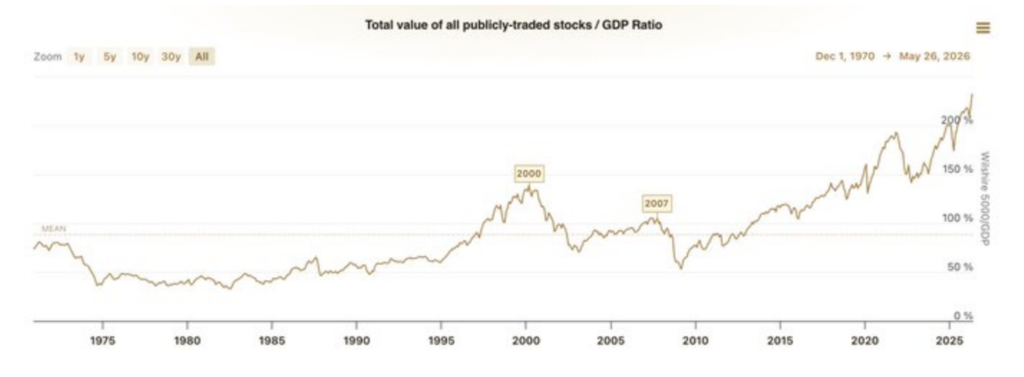
As noted earlier in this opener and based on historical metrics, there has never been a more overvalued market in history.
It is hard to understand why stocks have been impervious to elevated valuations (a record high in overvaluation in both the Buffett Indicator and a near record in Shiller’s CAPE ratio), as well as an equity risk discount. As an example, the Buffett Indicator (the total value of all publicly traded stocks divided by GDP) is at 236%, making this the most expensive stock market in history:
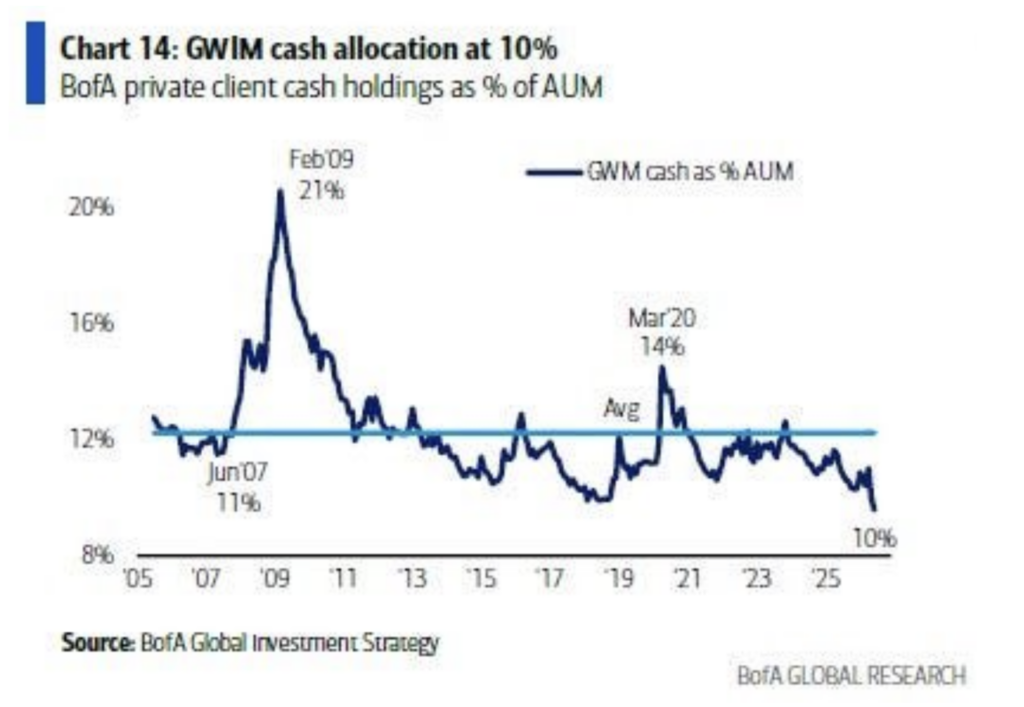
Investors are euphoric – BankAmerica’s private wealth clients hold the lowest amount of cash in two decades):
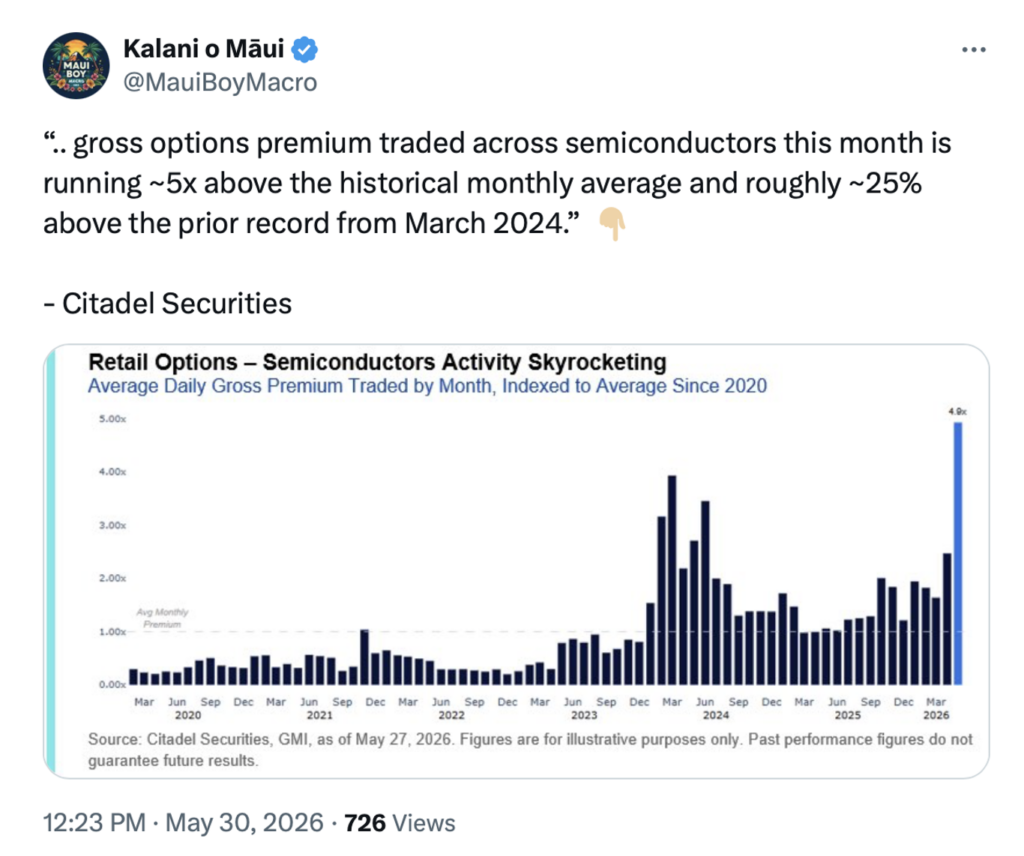
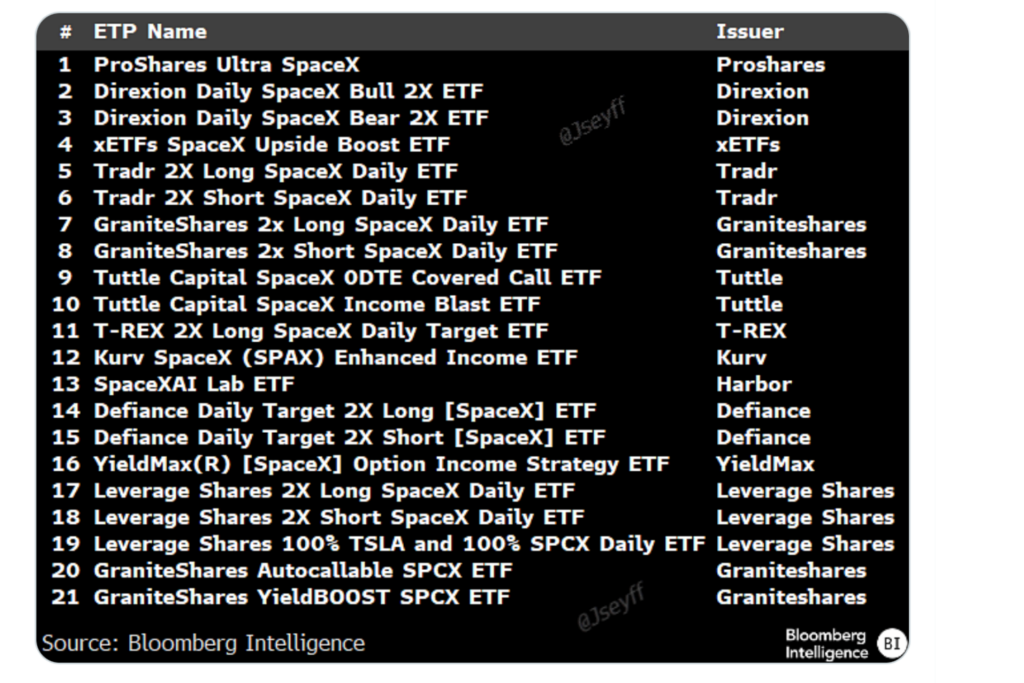
The market has become a casino – with more ETFs (many of them 2x leveraged) listed on the New York Stock Exchange than individual securities. ODTE (zero-day to expiration options) account for about 70% of total option activity.
Speculation is running amok:
Moreover, the markets are growing increasingly synthetic:
One answer for the recent market momentum is the dominance of passive products and strategies that worship at the altar of price. They know everything about price and nothing about value.
Other explanations are the euphoria in AI and the fear of missing out (FOMO).
Nonetheless, excessive valuations, excesses and the idea of a “new era” are nothing new — we have seen these at the top of other cycles (for reasons of overenthusiasm/heated speculation).
Finally, it is my strong view that the components of the equity risk premium suggest, at the very least, a mean reversion back towards the historical premium as 2027 EPS estimates come down and interest rates likely rise.
Let’s not forget when Berkshire Hathaway’s shares were suffering in late 1999 and many were questioning Warren Buffett’s investing philosophy (as they are currently with his near $400 billion cash hoard) — right before a more than -80% drawdown in the Nasdaq.
To me, it’s not different this time.
I continue to choose the weighing machine over the voting machine.
Positions: None.
——–
BY Doug Kass · Jun 10, 2026, 3:40 PM EDT
I’m supersizing MSOS now.
Position: Long MSOS (VL)
BY Doug Kass · Jun 10, 2026, 3:22 PM EDT
I have three consecutive research calls between 1:30 PM and 3 PM today
Back after.
Position: None
BY Doug Kass · Jun 10, 2026, 2:25 PM EDT
With S&P cash -59 handles (rallying almost 40 from the lows) I have sold out my index trading long rentals for a small profit:
* SPY $731.53
* QQQ $700.88
Position: None
BY Doug Kass · Jun 10, 2026, 2:11 PM EDT
With S&P cash -93 handles I am adding to my index trading longs:
* SPY $728.22
* QQQ $606.17
Position: Long SPY (S), QQQ (S)
BY Doug Kass · Jun 10, 2026, 1:46 PM EDT
I added to my trading long rental in the indices with S&P cash cash -73 handles, moving up from very small to small-sized:
* SPY $730.04
* &QQQ $697.76
Position: Long SPY (S), QQQ (S)
BY Doug Kass · Jun 10, 2026, 1:04 PM EDT
I’m back buying the indices with S&P cash -89 handles:
Position: Long SPY (VS), QQQ (VS)
BY Doug Kass · Jun 10, 2026, 11:57 AM EDT
All I can write is that please reread my opener on the market’s instability.
Positions: None.
BY Doug Kass · Jun 10, 2026, 11:35 AM EDT
– NYSE volume 16% below its one-month average;
– Nasdaq volume 8% below its one-month average;
– VIX index: up 3.77% to 20.62
Positions: None.
BY Doug Kass · Jun 10, 2026, 11:25 AM EDT
From Peter Boockvar:
The May headline CPI rose .5% m/o/m as expected and by .2% at the core level which was one tenth below the forecast. The y/o/y figures of 4.2% and 2.9% were as estimated due to rounding and up from 3.8% and 2.8% respectively in April. Energy prices jumped by 3.9% in the month led by a 7% rise in gasoline prices and now higher by 23.5% y/o/y. Electricity prices in particular rose by .6% m/o/m and 5.9% y/o/y. Food prices were up by .2% m/o/m and 3.1% y/o/y with ‘food away from home’ seeing a price gain of .3% m/o/m and 3.5% y/o/y, still exceeding ‘food at home’ where prices grew by .1% m/o/m and 2.7% y/o/y. The price of beef in particular fell back in May after the recent spike but still up 13% y/o/y.
Services inflation ex energy saw prices higher by .3% m/o/m and 3.4% y/o/y led again by rents. Owners’ Equivalent Rent rose .3% m/o/m after a .5% rise in the month before which was due to a calculation quirk. They are up by 3.3% y/o/y which is getting closer to reality for blended rents nationally. Rent of Primary Residence (which should replace OER) saw a price gain of .4% m/o/m and 2.9% y/o/y. Medical care prices rose by .3% m/o/m after two prior months of declines and up by 2.6% y/o/y. A statistical illusion continues to be how the BLS calculates health insurance as they tell us prices fell one tenth m/o/m and by 6.4% y/o/y. Obviously not real. Rather than measuring reality, they are measuring profit margins of health insurers.
Airline fares remain on fire, jumping by another 2.7% m/o/m and by 27% y/o/y. Hotel prices rose .5% m/o/m after a 2.8% spike in April and up by 5.1% y/o/y. Vehicle maintenance prices continued higher, up by .8% m/o/m and 6.1% y/o/y. We are getting some relief on auto insurance as prices here fell by 1.7% m/o/m and by 2% y/o/y.
Core goods prices were little changed again m/o/m, down one tenth and up by 1.1% y/o/y. Muted changes in car prices is the main factor. New car prices fell by .3% m/o/m and flattish y/o/y, up .2%. Used car prices were up by one tenth m/o/m and down 2% y/o/y. Apparel prices grew by another .3% m/o/m and by 4.8% y/o/y. I still think tariffs (as retailers stagger price increases) and now petrochemical and freight costs are flowing through. The prices of ‘household furnishings & supplies’ fell for a 3rd month, by .2% m/o/m but still up 2.4% y/o/y.
Watching out for the impact of higher computer memory prices, the price for ‘personal computers & peripheral equipment’ rose .2% m/o/m after a .9% spike last month and now up 1.3% y/o/y. These prices usually decline but depending on the hedonic adjustments with regards to the BLS. The price for ‘computer software & accessories’ were flat but after skyrocketing by 5% in April and 4% in March and up 14.5% y/o/y.
Bottom line, the data was about as expected but as mentioned earlier this morning, the full inflation story will only be complete after we see PPI tomorrow in light of the widespread cost pressures. Inflation remains the major economic pain point regardless of who has to absorb it. With the core rate miss relative to expectations, Treasury yields across the curve are down by 1 bp from where they were at 8:29am est. Inflation breakevens in the TIPS market are unchanged.
The fed funds futures market is pricing in a 96% chance of one rate hike by year end but we know so much depends on hearing where Kevin Warsh stands. While we all debate on what he wants to do, I think for the first time since Volcker, we are going to see more internal dissents in the coming years than we’ve seen over the prior decades since Greenspan when broad consensus was the goal.
Positions: None.
BY Doug Kass · Jun 10, 2026, 10:55 AM EDT
From the Wall Street Journal.
Positions: None.
BY Doug Kass · Jun 10, 2026, 10:45 AM EDT
Positions: None.
BY Doug Kass · Jun 10, 2026, 10:10 AM EDT
My only individual equity purchase this morning was adding to MSOS (MSOS) at $5.43.
Positions: Long MSOS VL
BY Doug Kass · Jun 10, 2026, 9:55 AM EDT

Anyone who has observed the market’s spectacular intraday volatility over the last four trading sessions should realize that something is amiss. The market is not behaving normally — it seems destabilized.
* Is it simply an overvalued market that is in the process of correcting?
* Is it an overvalued and concentrated market led by large-cap technology that is rotating into new leadership?
* Is it a signal that the AI revolution might face growing fundamental headwinds?
* Is the proliferation of leveraged ETFs and the growing acceptance of the market as a casino (with the ubiquitous presence of 0DTE options) undermining market stability, acting like an infant splashing around in a bathtub (violently moving from side to side)?
* Is it the consequences of the evolution of market structure (the tail wagging the dog), in which passive products and strategies dominate the investment landscape?
* Or, have the machines and algos “gone wild” (in dealing with a potential inflection point or price momentum change)?
To me, its all of the above — some of each.
We are likely entering a slippery slope — great for opportunistic traders, lousy for the buy-and-hold crowd.
Position: None
BY Doug Kass · Jun 10, 2026, 9:45 AM EDT
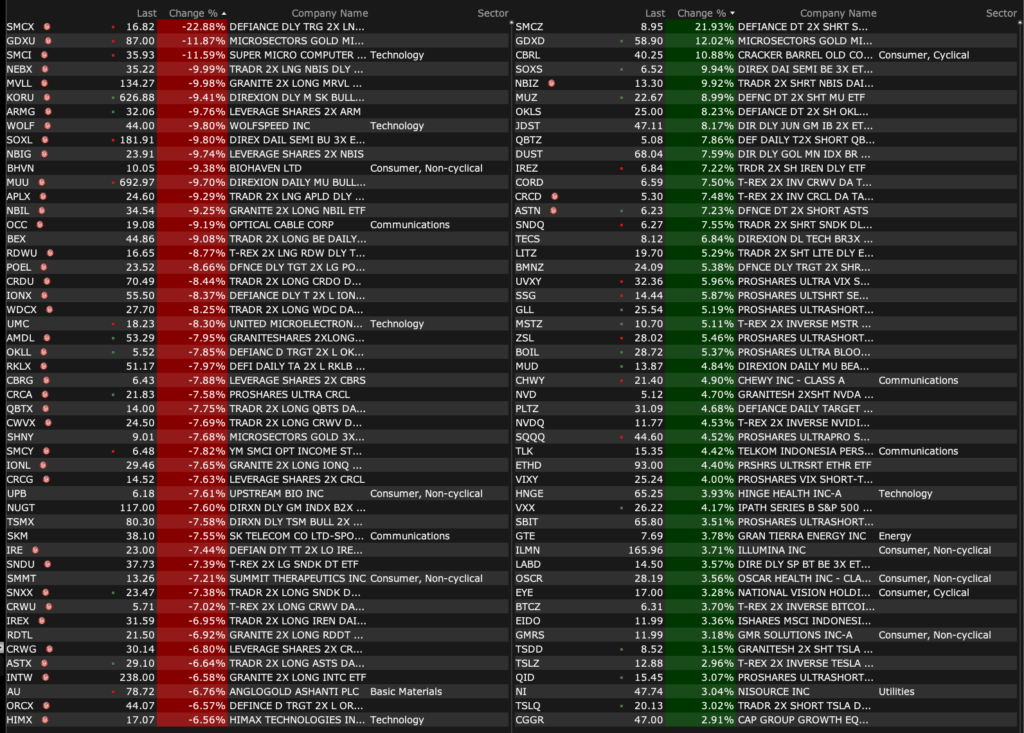
-CBRL +12% (earnings, guidance)
-LAKE +8.0% (earnings, color)
-BORR +4.2% (insider purchased ~$5M in common shares)
-OSCR +3.6% (Barclays Raised OSCR to Overweight from Equal Weight, price target: $35)
-ILMN +3.1% (JPMorgan Chase and Co Raised ILMN to Overweight from Neutral, price target: $185)
-CHWY +2.9% (earnings, guidance)
-DNTH -21% (Sanofi halts trial for peer autoimmune drug)
-SMCI -12% (announces $7B in equity and equity-linked financings)
-ARCB -8.2% (transport names lower follow Amazon launch of less-than-truckload freight offering for businesses)
-ODFL -5.6% (truckers lower lower follow Amazon launch of less-than-truckload freight offering for businesses)
-MU -4.8% (profit taking in sector)
-INTC -3.5% (sector weakness)
-BABA -2.8% (lower following report China prepping to spend ~2T yuan over 5-years building data centers to advance domestic AI industry, potentially threatening private cloud operators)
-CCL -1.7% (leisure names under pressure from geopolitical concerns)
Positions: None.
BY Doug Kass · Jun 10, 2026, 9:25 AM EDT
From Peter Boockvar:
While the markets mostly care about consumer price inflation, I don’t believe the inflation picture is complete by just looking at today’s CPI. Tomorrow’s PPI will be just as important with the difference being who is eating the widespread cost pressures and who is not. To print here again what the Beige Book said last week, “The ability to pass on higher costs remained mixed across sectors, particularly among consumer-facing firms.” Today’s headline CPI is expected to rise 4.2% y/o/y while PPI is expected to be up 6.4%. At the core level, consensus today is for a gain of 2.9% for CPI and by 5.4% for PPI.
China is seeing quite the spread between CPI and PPI. In May, CPI rose 1.2% y/o/y while PPI jumped by 6.3% y/o/y. Someone only looking at the former will tell me there is no inflation and then I offer the latter and say there certainly is plenty, just falling out on different parts of the economic chain in differing degrees.
On the heels of the massive equity raise done by Google and chatter about one coming from Meta, I thought the Bloomberg story today on Softbank was really interesting and maybe for the first time I can recall reflecting some questions being asked on valuations, or maybe just for Open AI. Not sure yet. The article said, “Softbank Group Corp.’s talks with potential creditors to raise at least $6 billion from a margin loan backed by its OpenAI stake have stalled, people familiar with the matter said, just weeks after the Japanese conglomerate cut its initial target from $10 billion.”
“It’s unclear why the margin loan discussions stalled. Borrowers and creditors can pause and revisit fundraising discussions for various reasons, and Softbank hasn’t elaborated on its plans, the people said.” The stock fell 8.3% overnight in Tokyo.
Casey’s General Store is one of my favorite earnings results and conference calls to go through because they touch consumers of all income levels with their convenience and gasoline station business. Over the years they have morphed from a business focused on the latter to one more on the former, and they have actually turned the company into a pizza shop in part. While a pizza fan, I have yet to try it. Let me know how it is if you have.
The earnings call is this morning and I will write about what they said tomorrow while this is from the earnings press release:
“Inside same store sales were up 5.5%, or 7.4% on a two year stack basis, driven by strong performance in whole pizzas as well as appetizers and sides in the prepared food and dispensed beverage category in addition to non-alcoholic beverages in the grocery and general merchandise category.
I’ve expressed my bullish stance on the stocks of some consumer staples names, particularly in food and was encouraged to see the Hormel earnings report a few weeks ago, Campbell’s the other day which was about as expected and now followed by JM Smucker yesterday and whose stock jumped by 10.4%.
Understand that a bombed out stock/sector can do better by having its fundamental picture be less bad. And when valuations are cheap, dividends, that are sustainable, are high, sentiment is awful, and the stock charts look ugly, it becomes I believe a fertile ground for opportunity.
They said of note:
“Total company net sales increased 6%, driven by growth in the Coffee, Away From Home, Pet Foods, and Frozen Handheld and Spreads segments.”
In their Coffee business, “We have demonstrated our ability to recover increased commodity costs through responsible pricing. Due to higher costs and the pass-through nature of the coffee category, we implemented price increases in May and August of calendar year 2025. Since then, price elasticity trends have been favorable relative to our initial expectations.” They are now seeing some pullback in green coffee commodity prices and they could reverse some of the price increases if sustained.
Uncrustables continues to do very well for them, with sales up 8% in the quarter and it is now a $1 billion brand.
In Pet Foods, I’m hearing again (from Petco, Colgate, and Chewy) how the cat business is doing better than dog, “net sales increased 2%, driven by continued momentum in cat food, partially offset by a decline in dog snacks.”
With respect to overall inflation, ex green coffee deflation and tariffs, “we do anticipate cost inflation of low single digits across the balance of our portfolio, and that’s largely coming through packaging, ingredients and transportation.”
Also yesterday were a few conferences where companies I follow spoke at. I’ve been highlighting here for months the ever rising cost of truck transportation and both JB Hunt and Schneider National talked about it yesterday.
From JB Hunt:
“Since 2022, we’ve been in an oversupplied overcapacity what would be called a freight recession.” That is so yesterday though with some pricing at “all time highs as indicators of capacity challenges as well as overall potential demand.” They see “industrial demand is solid. Customers are resilient.” I still think some of the demand strength is the pull forward of ordering and we’ll see at some point the extent.
“this industry is behind. It’s been four years in a cost inflationary environment and a rate deflationary environment. The industry is not healthy. It hasn’t generated the returns it’s needed to reinvest, and that has a catch-up aspect that’s going on right now. So the magnitude of what could happen from a catch-up perspective, but also going forward on what we need to execute is still in flight and in motion. So it could be significant as we said.”
From Schneider National:
“Well, I’d say demand, while there’s some pockets of strength, certainly, especially in what we’re seeing with production picking up a little bit, generally, it’s been stable is the way I would characterize it.” On some weakness, “home building, everything that goes into a home being created as well as automotive, perhaps not as strong as what it could be had we seen an interest rate decrease.”
“But, what we’ve seen the most activity is capacity exiting the market.”
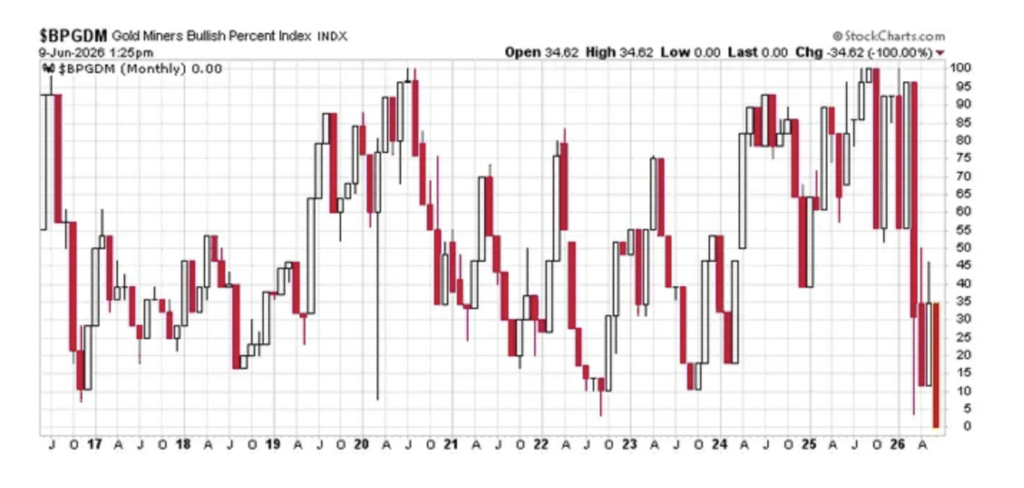
I’ve mentioned my belief that US Treasuries and sovereign bond markets in Europe too that are heavily foreign owned have been a source of funds for those countries seeing ever rising spending needs to cushion the blow of higher energy prices. I think gold has been a source of funds too and the pullback off the early year high continues. But, we’re now stretching it on a technical perspective.
If not aware, there is a technical gauge called the Gold Miners Bullish Percent Index which is a breadth indicator that vacillates between 0 and 100 with 30-70 being a normal range. Yesterday it closed at zero, and thus cannot get any worse. Also, the 14 day Relative Strength Index is down to 26, the lowest since October 2023.
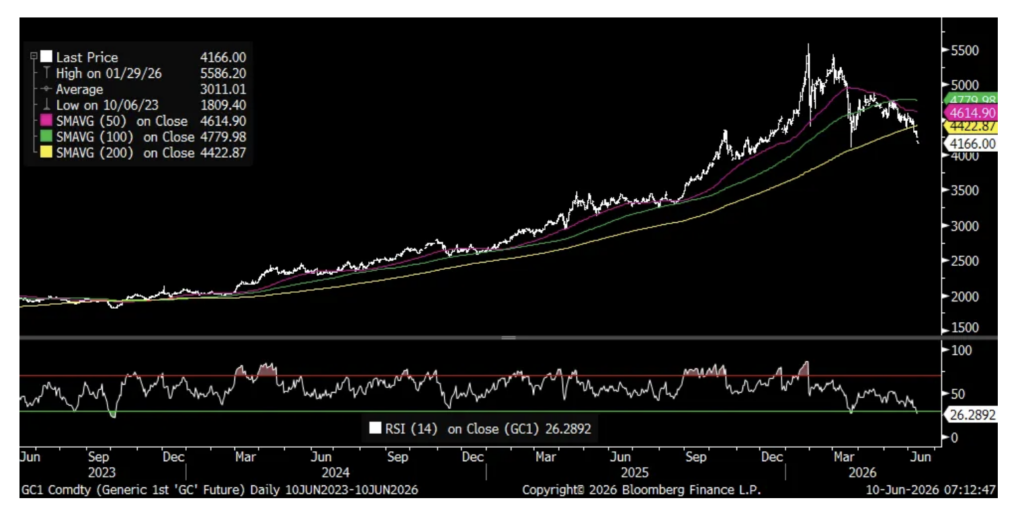
Gold (generic contract)
Not with help from lower mortgage rates as they were little changed from last week at 6.60%, purchase applications rebounded by 7.3% w/o/w after three weeks of declines. Refi’s rose 15.3% w/o/w after six weeks of declines
Positions: None.
BY Doug Kass · Jun 10, 2026, 9:15 AM EDT
Positions: None.
BY Doug Kass · Jun 10, 2026, 9:00 AM EDT
BY Doug Kass · Jun 10, 2026, 8:45 AM EDT
With S&P futures rallying to -56 handles I have sold my Index trading long rentals ahead of the inflation data for a very small profit:
* SPY (SPY) $731.68
* QQQ (QQQ) $699.18
Positions: none.
BY Doug Kass · Jun 10, 2026, 8:31 AM EDT
Positions: None.
BY Doug Kass · Jun 10, 2026, 8:25 AM EDT
11:00 a.m.: Treasury buyback announcement (cash mgmt);
11:30 a.m.: Treasury hosts a $69B 17-Week Bill Auction;
1:00 p.m.: Treasury hosts a $39B 10-Year Note Auction;
Positions: None.
BY Doug Kass · Jun 10, 2026, 8:16 AM EDT
Position: None
BY Doug Kass · Jun 10, 2026, 8:05 AM EDT
With S&P futures -84 handles and Nasdaq futures -480 handles, I am adding to my trading long rentals:
Position: Long SPY (VS), QQQ (VS)
BY Doug Kass · Jun 10, 2026, 7:50 AM EDT
Position: None
BY Doug Kass · Jun 10, 2026, 7:45 AM EDT
For a clear explanation to why I am so actively trading the indices (long and short), please see my opening missive, which is coming up!
Position: None
BY Doug Kass · Jun 10, 2026, 7:30 AM EDT
BY Doug Kass · Jun 10, 2026, 7:15 AM EDT
Position: None
BY Doug Kass · Jun 10, 2026, 7:05 AM EDT
Position: None
BY Doug Kass · Jun 10, 2026, 6:55 AM EDT
You’re the top! You’re the Coliseum.
You’re the top! You’re the Louvre Museum.
You’re the melody from a symphony by Strauss.
You’re a Bendel bonnet,
A Shakespeare sonnet,
You’re Mickey Mouse!
– Cole Porter, “You’re The Top” Cole Porter – You’re The Top
Position: None
BY Doug Kass · Jun 10, 2026, 6:45 AM EDT
* What could go wrong, here? A lot…
Chart of the Day:
Position: None
BY Doug Kass · Jun 10, 2026, 6:35 AM EDT
Position: None
BY Doug Kass · Jun 10, 2026, 6:25 AM EDT
Taking a trading long rental in the indices with S&P futures -70 handles:
* SPY $730.42
* QQQ $698.06
Position: Long SPY (VS), QQQ (VS)
BY Doug Kass · Jun 10, 2026, 6:15 AM EDT
An excerpt:
This brings me to the next future casualty of today’s hysteria, Nvidia, the most valuable company in the world, trading at 30 times 2026 earnings. That is not an insane valuation for a company growing very fast. But in the case of Nvidia, the E in the P/E will likely decline a lot in the future. Today, if you are building a data center, Nvidia is mostly the only game in town. Several things are likely to happen. There will be more competition. We are approaching peak demand. And capital markets won’t keep financing the customers who buy its chips. I could write a very long essay just about Nvidia.
Three of the biggies are going public: SpaceX (which owns xAI), Anthropic, and OpenAI. All of them are losing money. Together they spend hundreds of billions on data centers, the bulk of which went to Nvidia for AI chips. Meta and Google, cash cows in their own right, were subsidizing their AI spending from their core business. When that was not enough, they levered mildly and now, for the first time, they are actually issuing stock. Yes, they went from net buyers of their own stock to sellers.
You have two scenarios. In the first, these investments lead to such high returns that these companies end up swimming in cash and fund their future Nvidia chip purchases out of future cash flows. But please think about it. All of these companies collectively are throwing close to a trillion dollars, yes, a trillion, at AI. They feel like they are fighting for their survival, and that is exactly what creates a race to the bottom, where their future profitability gets competed away fiercely. And if these companies don’t spend a trillion dollars on data centers next year, Nvidia’s earnings will be a lot, lot less.
Nvidia and the semiconductor sector are a classic capital-cycle story: demand creates too much supply, and a boom leads to a bust. I have written about it many times before, from the railroads in Great Britain in the 1800s to telecom in 1999. I don’t know if it will be next week or next year, but this will predictably end in tears. Nvidia is unlikely to remain the most valuable company in the world, unless all the others become a lot less valuable. The signs of a bubble are everywhere. I am experiencing 1999 déjà vu.
Over the next few weeks the capital markets will be hit by three IPOs and two secondary offerings from Google and Meta, totaling multiple hundreds of billions of dollars. This alone will likely suck liquidity out of the capital markets and put a nice bow on the AI rally that drove the S&P 500 higher this year.
Position: None
BY Doug Kass · Jun 10, 2026, 6:05 AM EDT
Position: None
BY Doug Kass · Jun 10, 2026, 5:55 AM EDT
The S&P Short Range Oscillator is in neutral territory at 0.24% vs. 0.56%.
Position: None
BY Doug Kass · Jun 10, 2026, 5:45 AM EDT
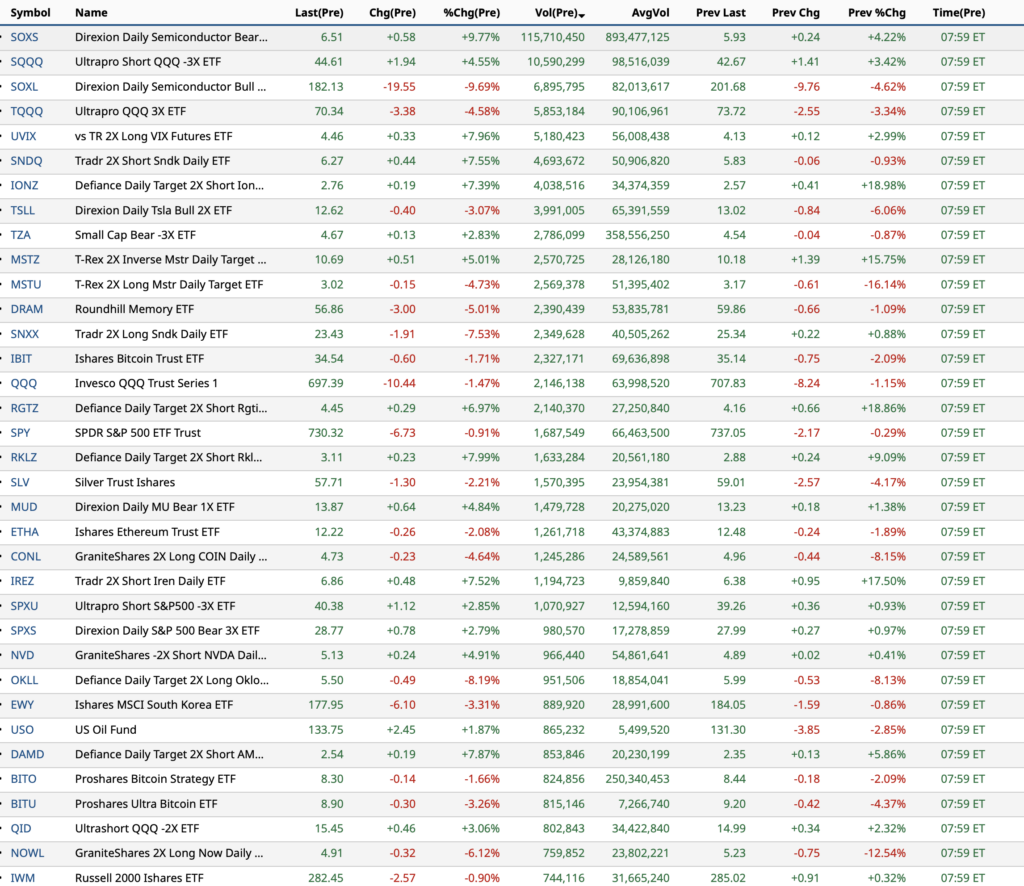
Intraday VOL Breakout "Just a week ago, one day VIX options were tracking single digits (sub-9 on June 2nd). Today, the entire front month curve is sitting above 20.And the S&P is down less than 3%. Chaos." @t1alpha

Nobody is trading stocks any more: it's all just options and levered ETFs

SOXS (-3x Semis) traded more than 1.3 billion shares today, the third largest volume day in terms of shares for a US-listed ETF in data observed over the past two decades: GS
70% of the signals that appear at major market tops are flashing right now. Bank of America tracks a checklist of warning signs that historically cluster before market peaks. Sentiment. Valuation. Macro. They measured how many were triggered before every major top of the last Show more

This is how you price an IPO. You don't sell what a company is. You sell what it could become. SpaceX wrote the most ambitious "could become" in SEC history. The filing claims a total addressable market of $28.5 trillion. Larger than the entire GDP of the United States. TheShow more


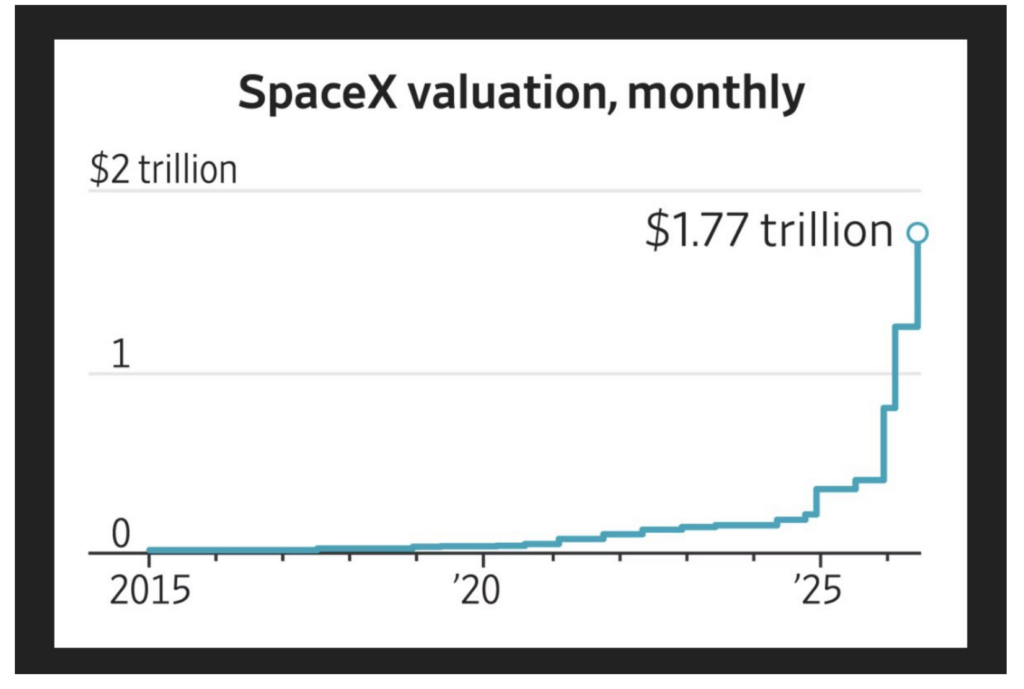
This week, the largest IPO in human history begins trading. SpaceX. Ticker SPCX. $135 a share. $75 billion raised. A $1.75 trillion valuation. The old record, Saudi Aramco in 2019, raised $29 billion. SpaceX more than doubles it. A view from Switzerland: $1.75 trillion is more

One of the worlds largest tech cos casually admitting the technology we’re spending $1 trillion annually on might in fact be counterproductive, and will need human oversight every step of the way File this one in the “what were the signs?” folder
More AI-generated code doesn't make your team faster. It might actually slow you down.
SpaceX is about to attempt the largest IPO in history. By a wide margin. This chart shows the 100 biggest global IPOs since 2000, sized in today's dollars. SpaceX sits alone at the top. A $75 billion offer size. A $1.8 trillion-plus valuation. For perspective, the largest Show more

🚨 Is it really a coincidence? A cycle composite model from the Foundation for the Study of Cycles, done by Newton from Fundstrat, projects the S&P 500 peaking near current levels and rolling over into the summer. Now layer on the calendar. 2026 is a mid-term election year. Show more
Very important point: SoftBank was pledging *all* of its OpenAI stock (worth $60bn+ on paper) to get a $6 billion margin loan. Banks turned it down due to concerns about the value of OpenAI stock. Banks clearly do not think OpenAI is worth $852 billion. tradingkey.com/analysis/stock…

SoftBank's effort to secure $6 billion OpenAI margin loan falters
