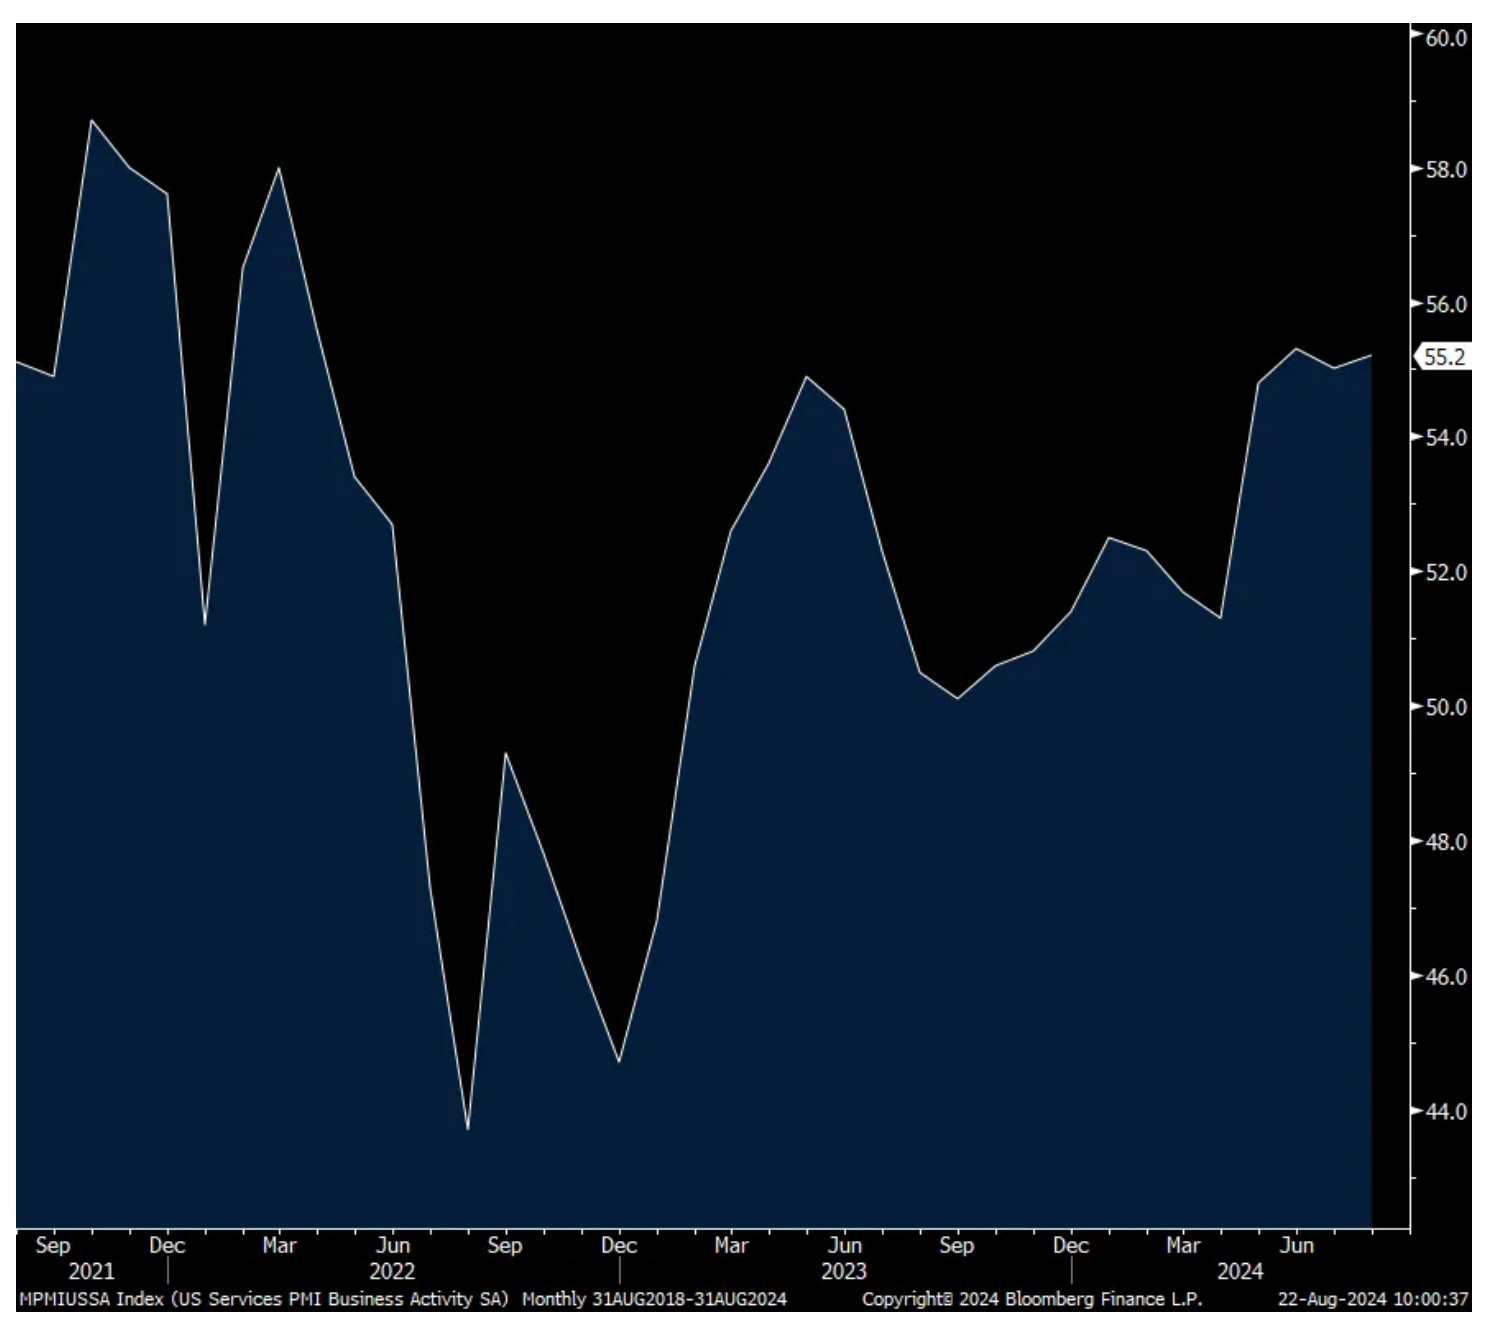
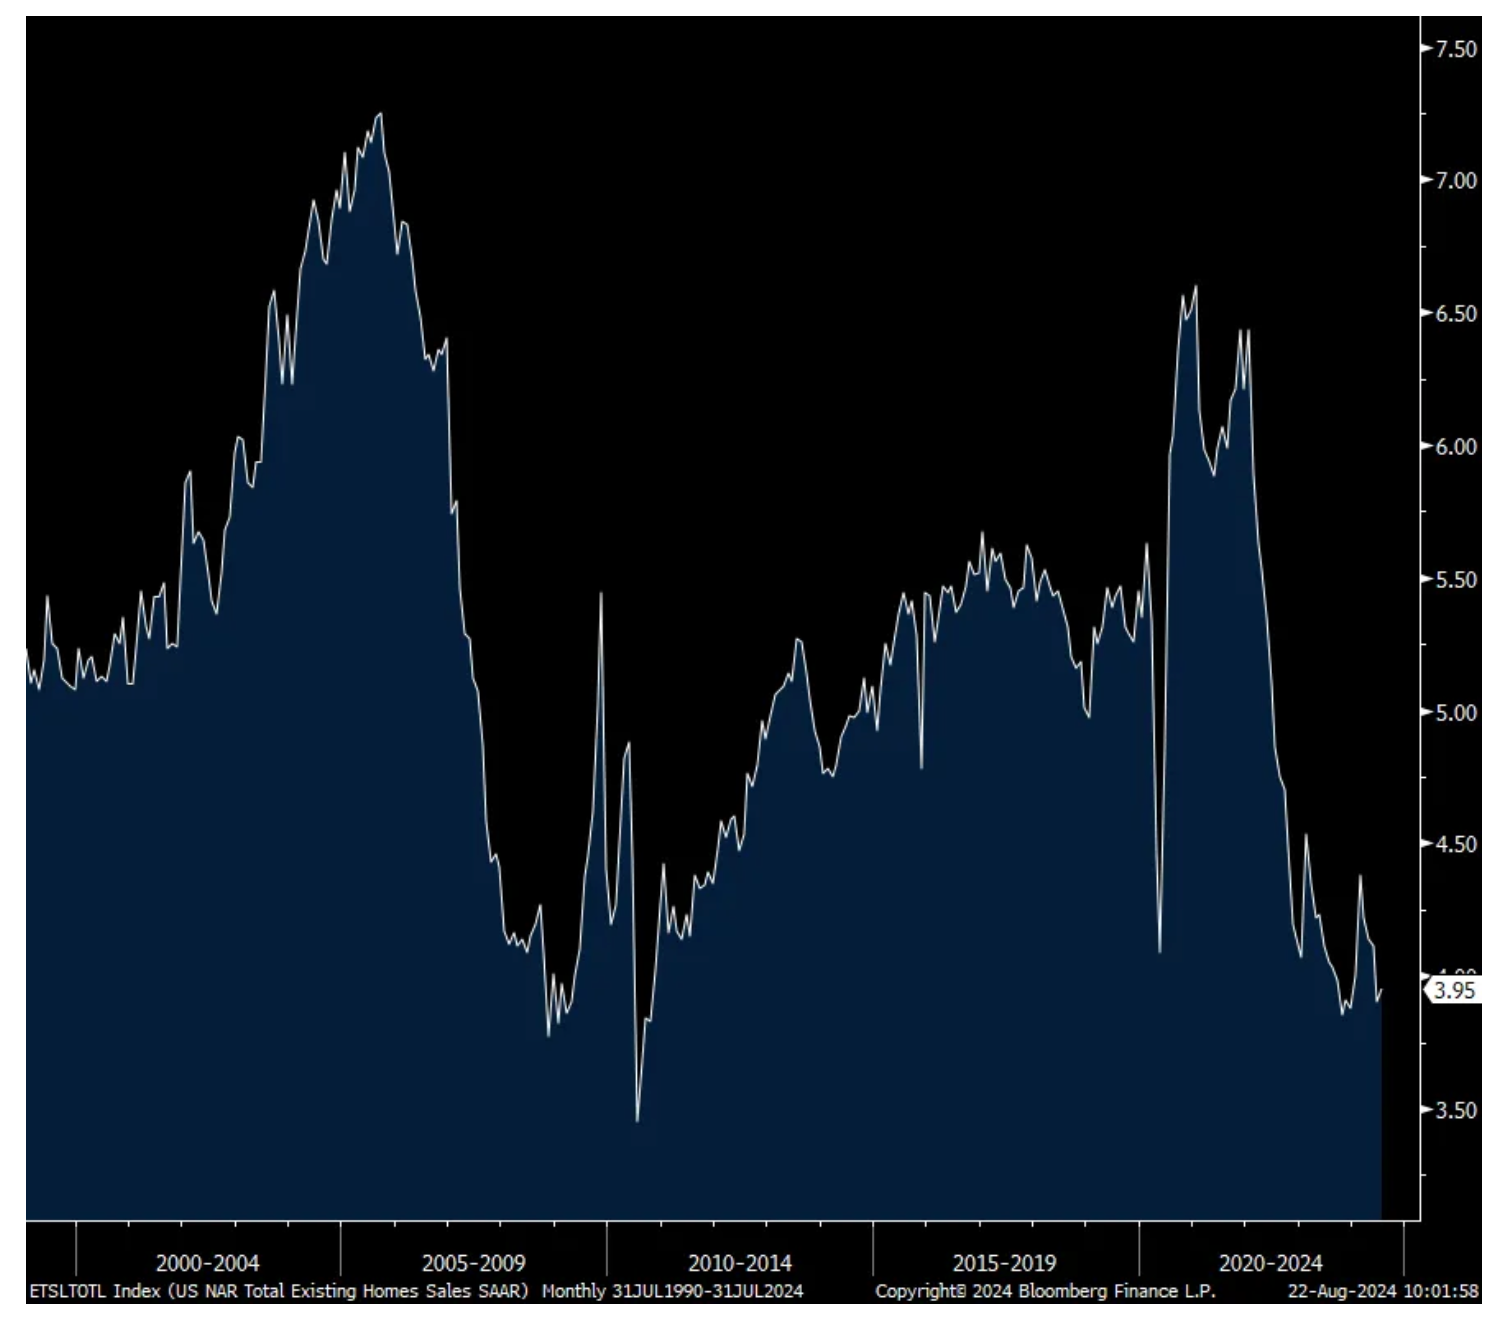
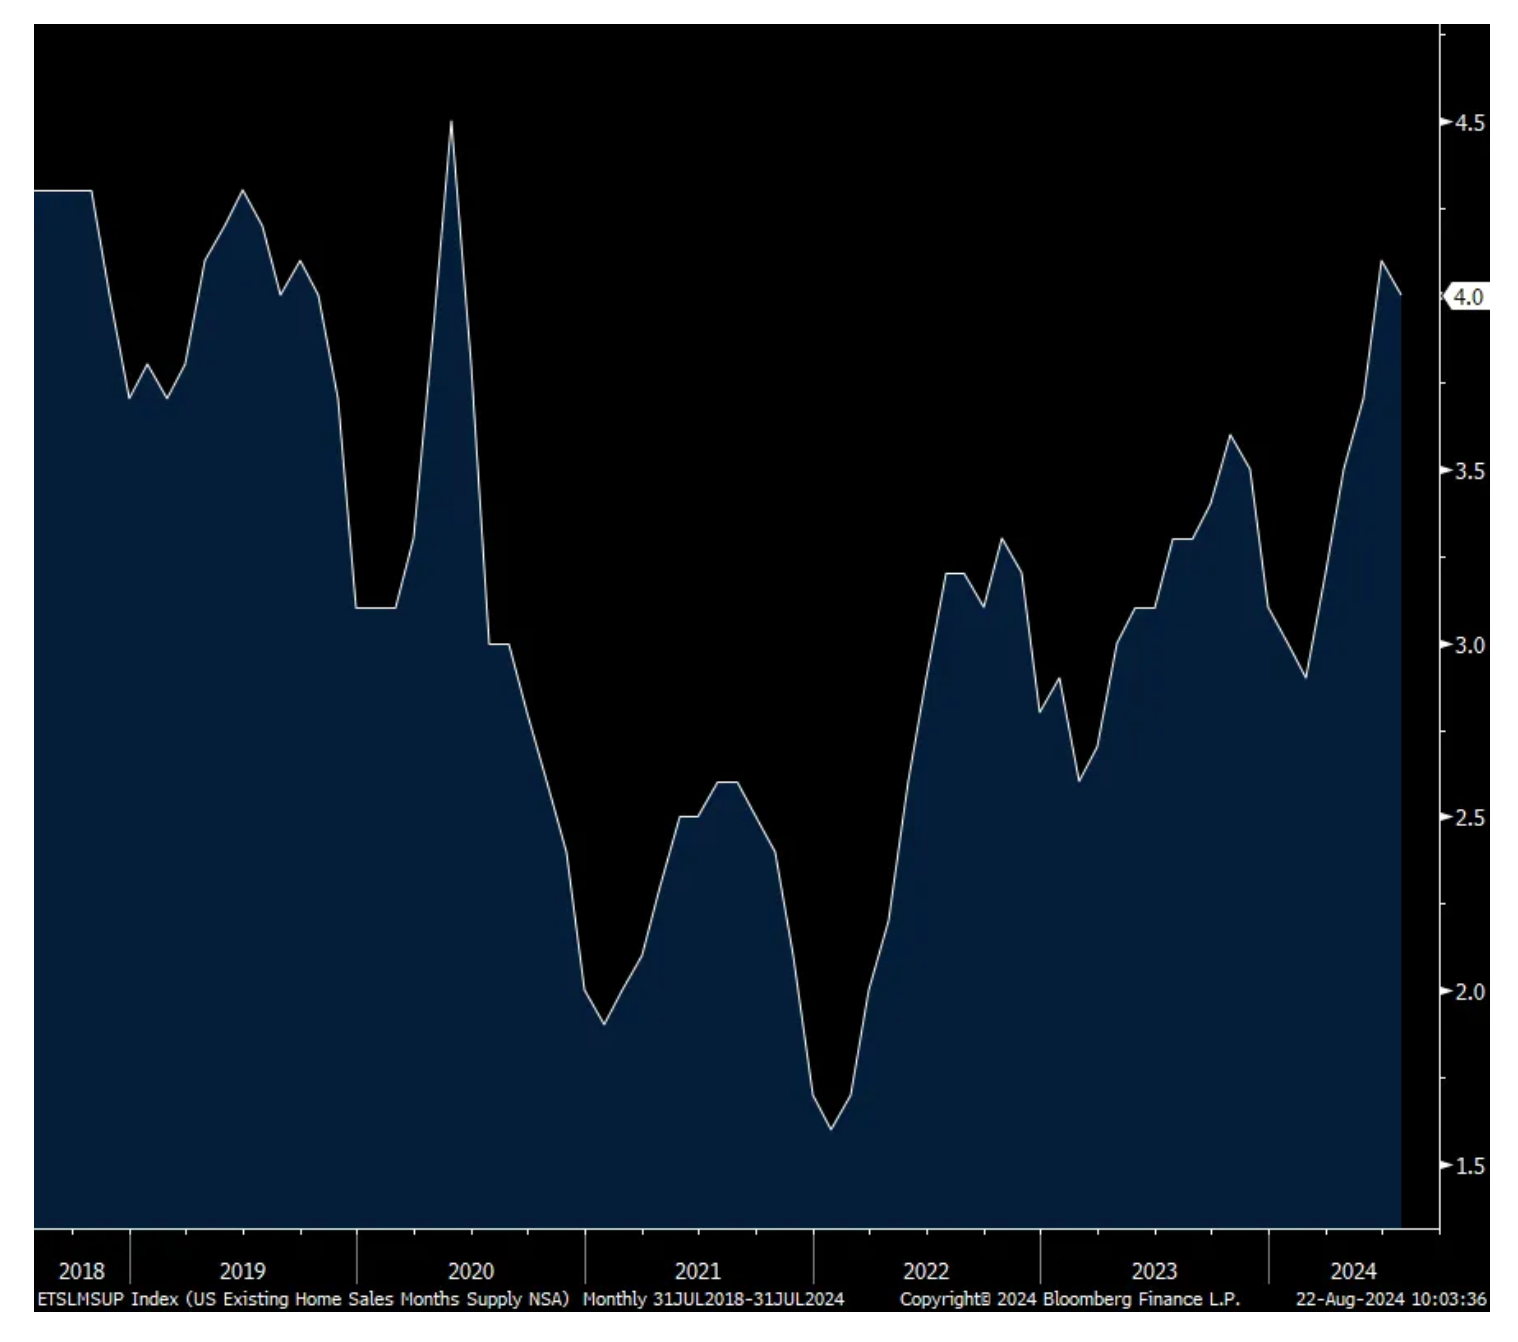
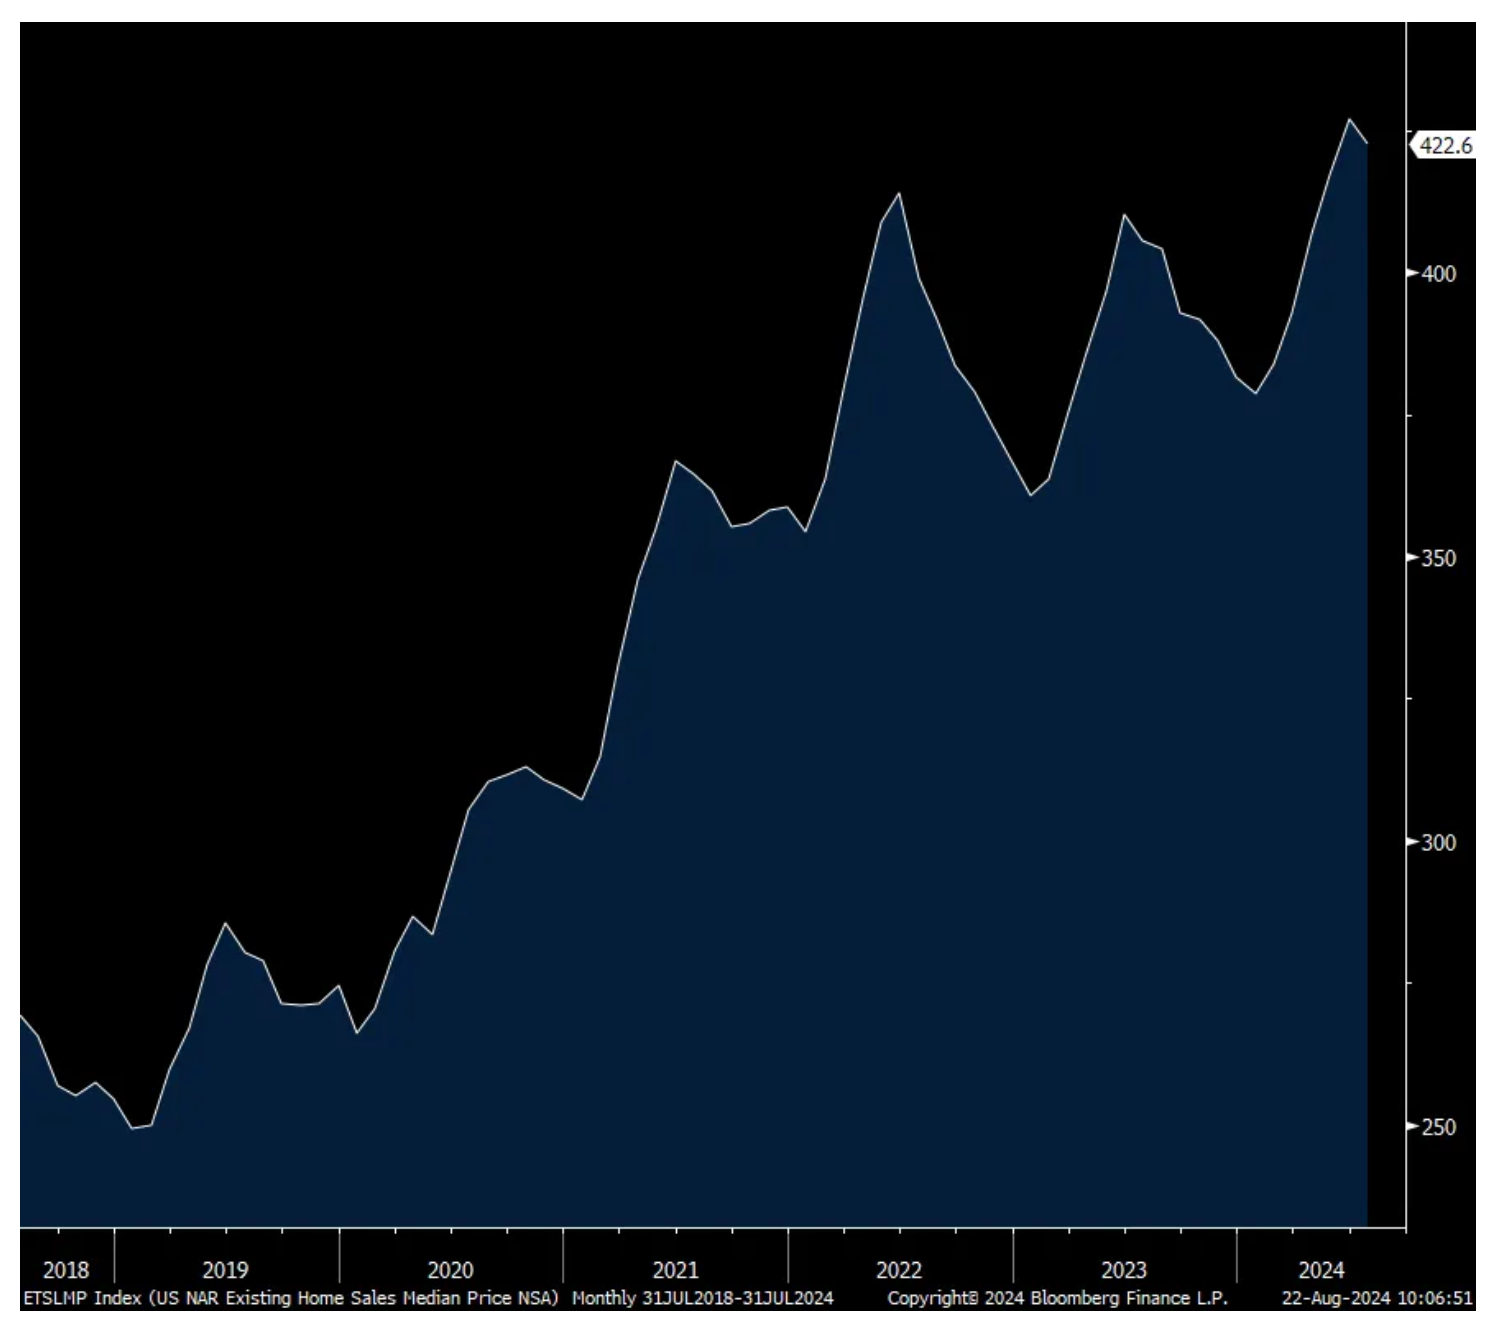
As it is in the Eurozone, the "tale of two cities" remains the case in the U.S./housing sales.
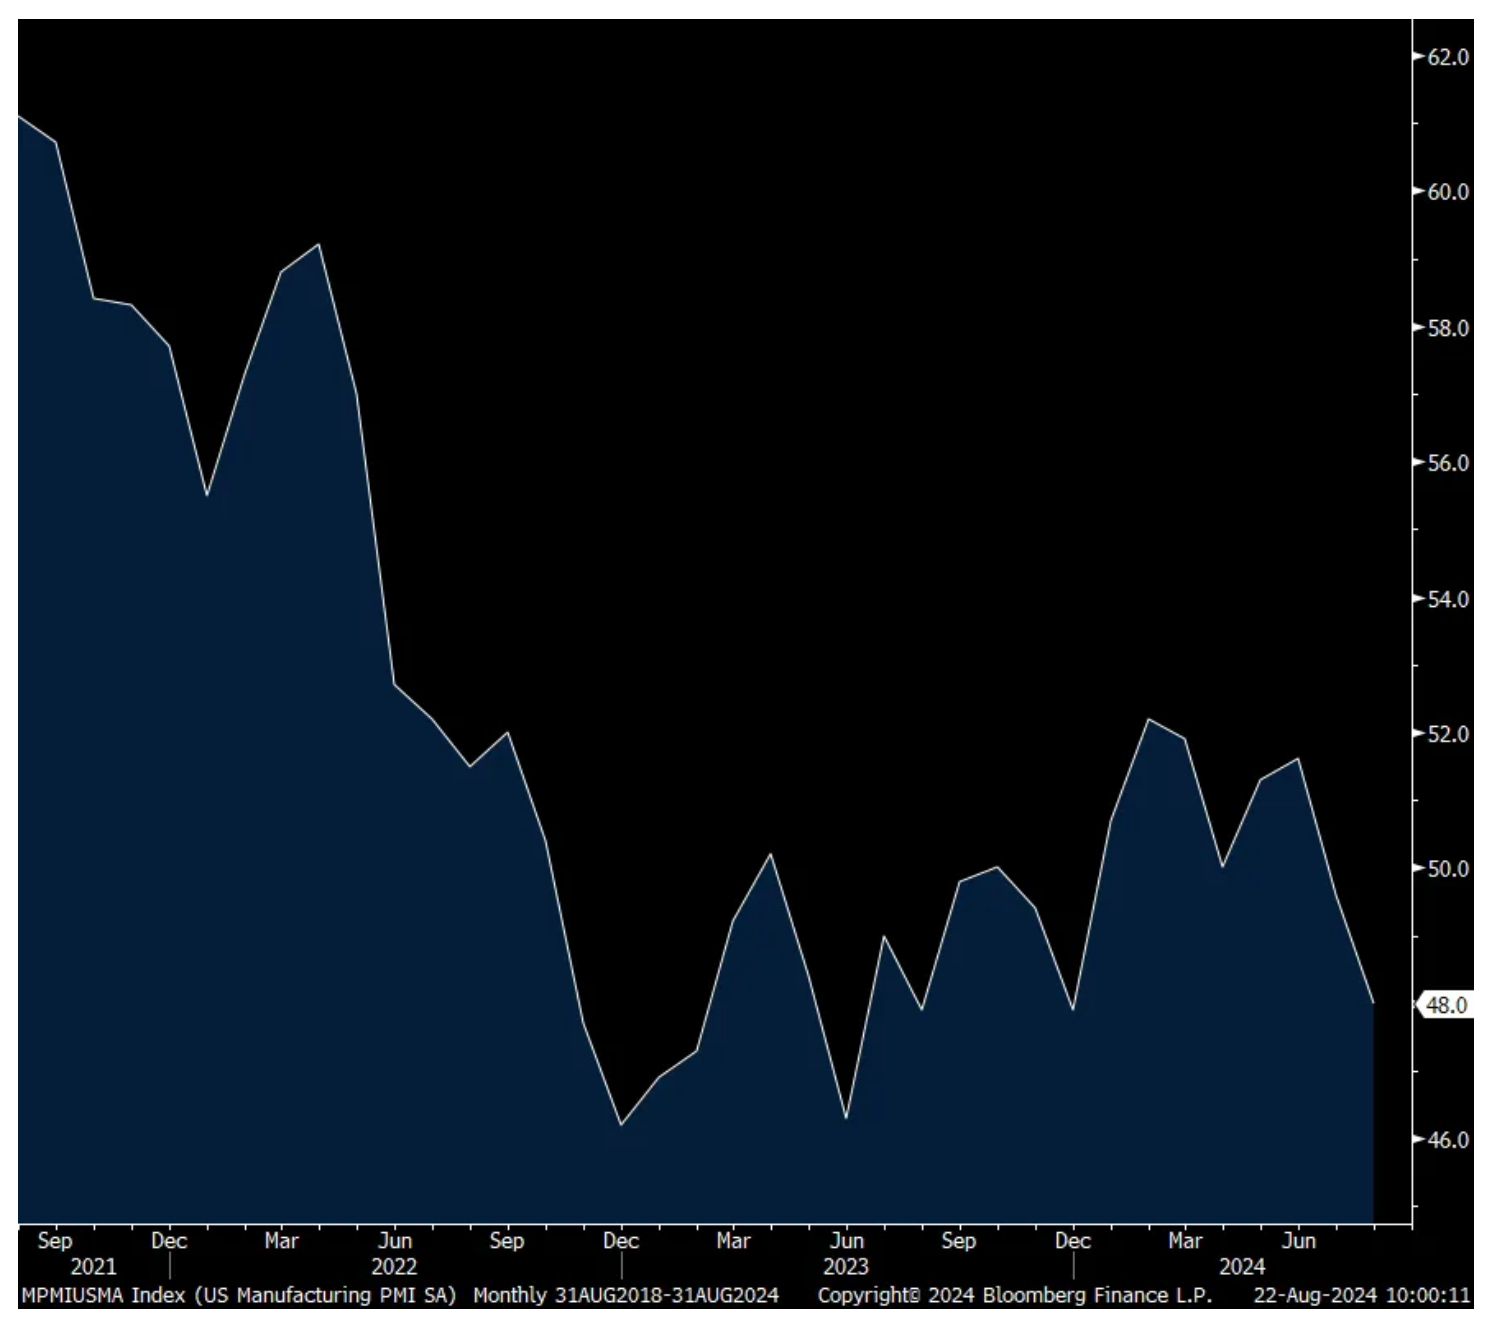
On manufacturing, S&P Global said “All five components of the PMI weakened in August. Increased rates of decline for new orders and inventories were accompanied by the first fall in factory production for seven months. Employment growth meanwhile slowed to near-stagnation. Suppliers’ delivery times also shortened to the greatest extent since February, in a sign of suppliers being less busy amid weaker demand for raw materials: input buying by factories fell at the sharpest rate for eight months.”
Of note too, “inventories of finished goods rose markedly for the third time in the past four months, the recent accumulation of unfinished inventory having been amongst the largest recorded in the history of the survey, often reflecting weaker than expected sales.”
On pricing, “the rate of input cost inflation accelerated in manufacturing to the highest since May.”
The rate of output charges though held unchanged month over month, remaining at a four-month high. Covering both manufacturing and services, “Firms cited higher staff costs as a key cause of raised prices alongside higher raw material prices and increased shipping rates.”
With services, “payroll numbers fell amid hiring difficulties.” New orders rose and the future outlook did as well. On output price inflation, “Selling price inflation meanwhile cooled in the service sector to the second lowest since May 2020 to a level only marginally above the pre-pandemic average.”
Bottom line, just as it was seen with the Eurozone PMI, we have a tale of two economic cities in the U.S. as well, that between manufacturing that remains in a recession and the services sector that is carrying all of the load.
Manufacturing PMI
Services PMI
The depressed pace of existing home sale transactions continued with closings data for July. They totaled 3.95 million versus 3.9 million and hovering around the lowest since the mid 1990s.
Months’ supply did fall to four months from 4.1, but holding with a four handle for the second month for the first time since 2019. The median home price grew by 4.2% year over year, and is now up 49% since they inflected higher above trend in mid 2020. No wonder why existing home sales are punk, along with and connected to the limited supply.
The first time buyer is the one stuck holding the affordability bag and they made up 29% of purchases, remaining low. Investors backed away too, as they made up 13% of buying versus 16% in June.
The bottom line from the NAR was simple, “Despite a modest gain, home sales are still sluggish.”
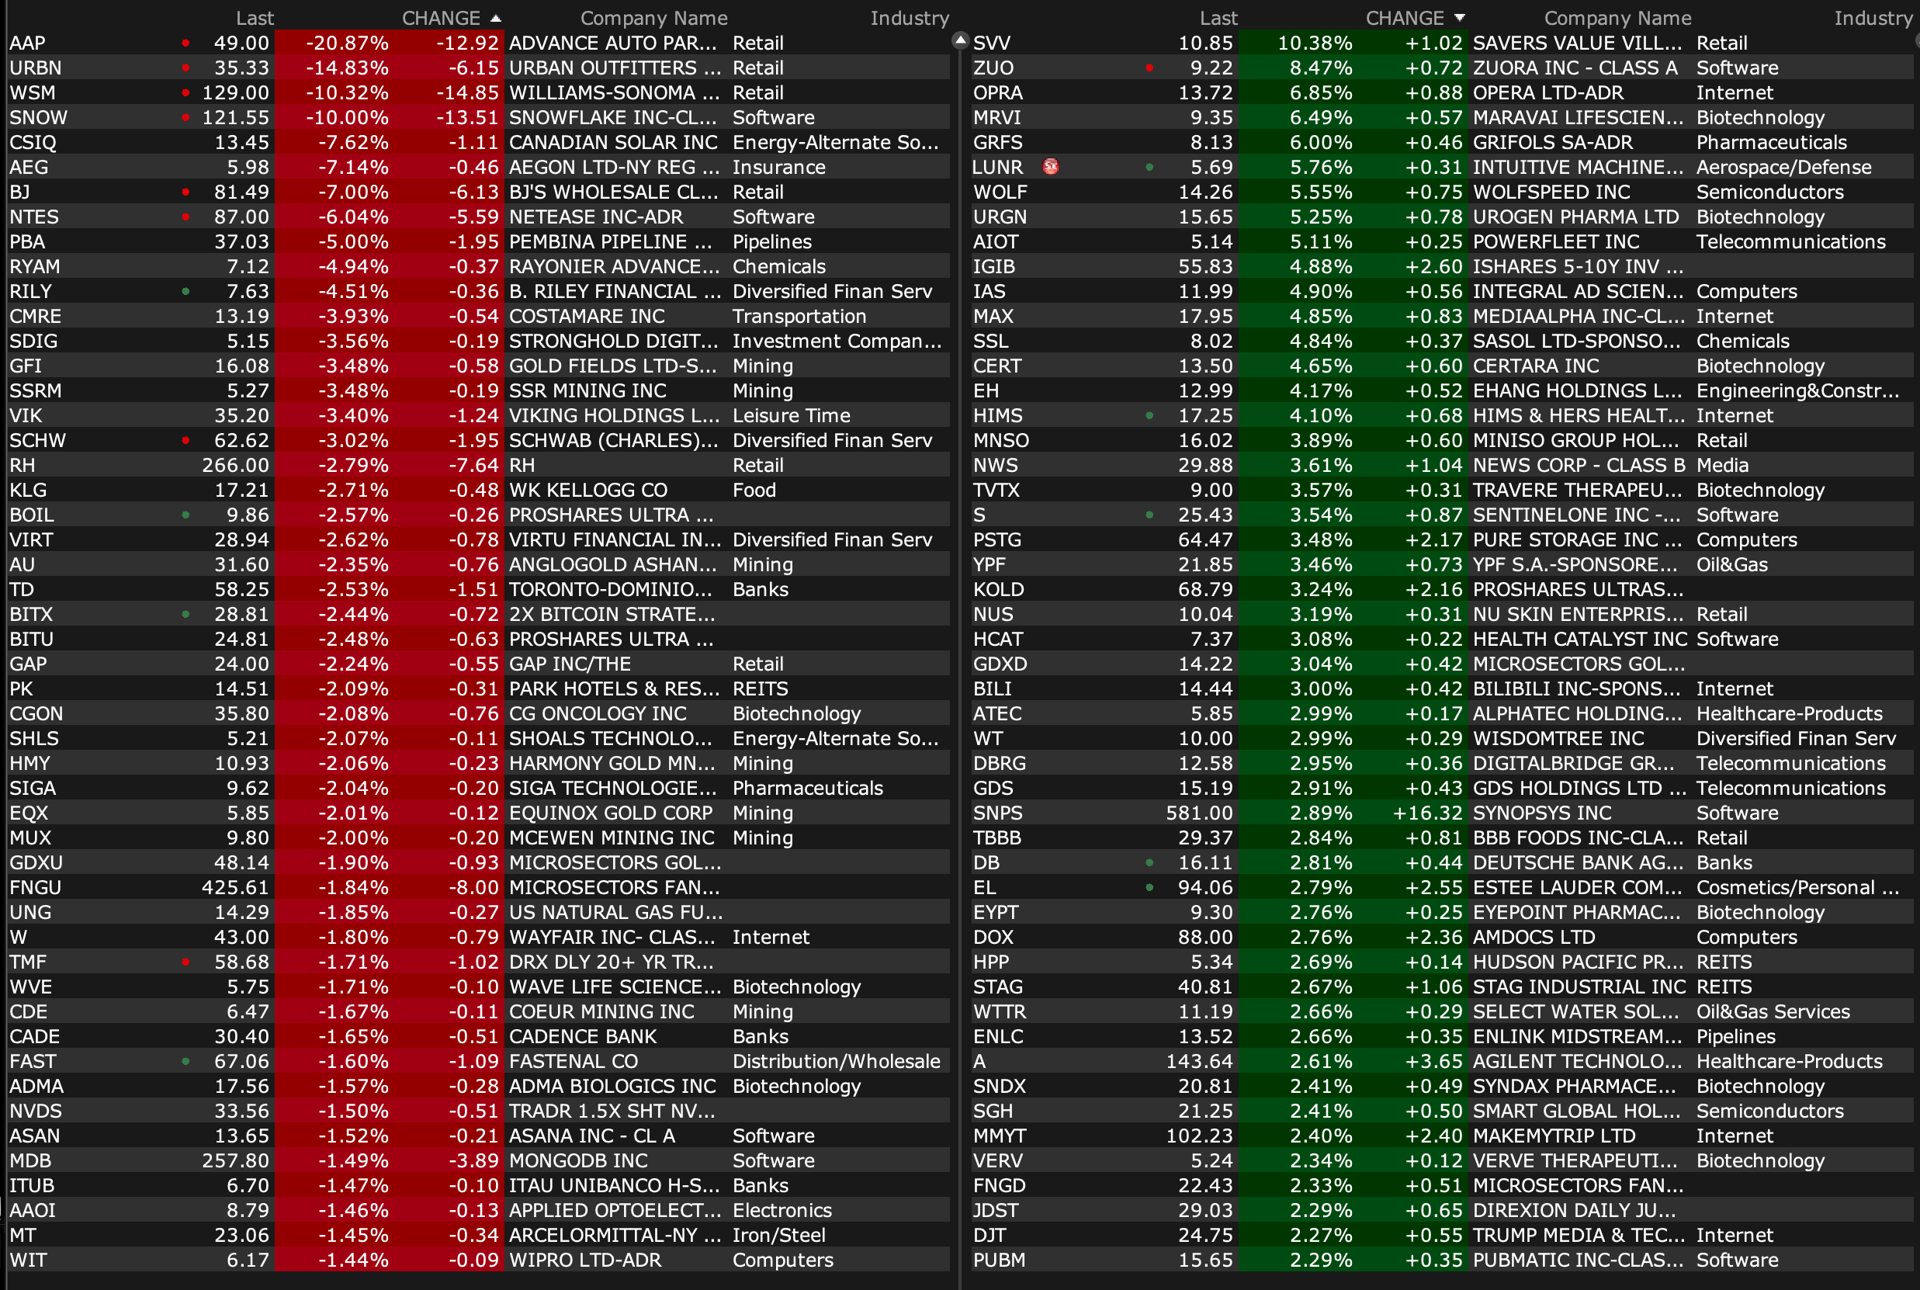
AIRI +42% (awarded $110 million, seven-year contract for the production of Thrust Struts used in the Geared Turbo-Fan [GTF] aircraft jet engine)
PTON +13% (earnings, guidance)
ZUO +8.2% (earnings, guidance)
GEVO +7.7% (to supply renewable, hydrocarbon-based, low-carbon intensity racing fuel blendstock to Shell)
WOLF +7.5% (earnings, guidance)
OPRA +5.7% (earnings, guidance)
SURG +5.4% (announces commencement of previously-authorized $5 million share repurchase program)
BOSC +4.8% (earnings)
EH +4.2% (earnings, guidance)
ZM +2.9% (earnings, guidance)
BILI +2.7% (earnings)
HIMS +2.5% (Needham Initiates HIMS with buy, price target: $24)
PARA +2.3% (Bronfman raises offer for Paramount and National Amusements by $1.7 billion, from $4.3 billion to $6.0 billion; Special Committee extended Go-Shop period)
SNPS +2.3% (earnings, guidance)
WB +2.3% (earnings)
EL +2.2% (Piper/Sandler raised EL to overweight from neutral, price target: $114)
Downside:
AAP -17% (earnings, guidance; confirms sale of Worldpac unit to Carlyle for $1.5 billion in cash)
URBN -14% (earnings, guidance)
WSM -12% (earnings, guidance)
SNOW -10% (earnings, guidance)
BJ -7.3% (earnings, guidance)
CSIQ -5.8% (earnings, guidance)
NTES -5.8% (earnings)
SPT -4.6% (Keybanc/Pacific Crest cuts SPT to underweight from sector weight, price target: $28)
IQ -3.6% (earnings)
SCHW -3.5% (TD selling 40.5 million Schwab shares, reducing stake from 12.3% to 10.1%)
From Boockvar: Credit Tightens, Picky Shoppers, Canada's Rail Strike
From Peter Boockvar:
An update on banking/'Value' is the new sexy word as was 'AI'/Other good stuff
The new August Dallas Fed's Banking Conditions Survey continues to reflect a tight credit situation which mostly impacts small and medium sized businesses. "Loan volumes were flat in August after increasing in the prior two periods, and loan demand slipped. While overall credit tightening continued, standards and terms stabilized for residential real estate and consumer loans after more than two years of tightening. Loan prices held steady, marking the first time since 2021 that rates didn’t rise. Loan nonperformance continued to increase. Bankers’ outlooks faltered somewhat: They expect a deterioration in loan demand, loan performance and business activity six months from now."
And comments from bank respondents reflect this anecdotally. There are a few hopes things improve with rate cuts, but despair by others with challenging conditions and apparent economic dispersion's.
"Rates, inflation and the upcoming election have impacted loan demand. We have expectations that things will pick up after the election."
"Increases in nonperforming commercial real estate loans are isolated to a few credit accounts and are less related to a specific industry."
"The higher-for-longer narrative has dampened demand; the market is anticipating rate cuts, which should stimulate demand."
"Bifurcation is occurring between large public companies and private, middle-market firms. For middle-market firms, average EBITDA and margins have been falling due to higher costs and an inability to further increase prices. With interest rates remaining elevated, higher debt service cost is also taking its toll on net profit after tax. Expect to see an increase in covenant breaches and defaults."
"[We are in a] deep recession. The Federal Reserve has waited too long to reduce rates."
"Uncertainty about future rate cuts is beginning to be unsettling for customers. They will wait for rates to settle before moving forward with business deals."
"Economic signals are still sending mixed messages. Unemployment is still low, but hourly employees are having a more difficult time finding work. Inflation is slowing, but it’s still a factor in how people spend their money. Plus, the presidential election cycle is causing more uncertainty as usual."
"Our general impression is that economic conditions have worsened across the board."
"A lot depends on the election in November 2024."
"We are seeing a significant slowdown in residential real estate applications (both consumer and investor). The uncertainty as to when rates will decline and the upcoming election have caused potential buyers to pause or delay their purchases.
Nothing says success right now in retail like the word 'value' with consumers so focused on seeking it out. Just as saying AI excites the tech investor, it's 'value' for retailers now that is sexy. I bolded for emphasis.
TJX Max had a good quarter with comps up 4% and said "We believe this is an excellent indicator of the strength of our business as our exciting merchandise assortment, great brands, and outstanding values continue to resonate with consumers across our geographies."
They said the comp growth was "entirely driven by customer transactions."
"we are convinced that consumers will keep seeking value...I am confident that our value proposition will continue to resonate with shoppers when they visit any one of our retail banners."
From Target:
"Among the drivers of our comp sales (2%), we're pleased that our 2nd quarter growth was driven entirely by traffic."
"And we were particularly encouraged to see discretionary category trends improve for the 4th consecutive quarter. In apparel, comp sales grew by more than 3%, marking an improvement of more than 5 percentage points when compared with the 1st quarter." That though was helped by back to school.
"Beauty was another standout."
"On the frequency side of our assortment, both our Food & Beverage and essential categories saw traffic growth in the quarter, as consumers are responding to our offerings in an environment where they're focused on value."
On the consumer, "Given the significant headwinds they faced with inflation over the last few years, consumers continue to focus on value as they work hard to manage their household budgets. And while they continue to turn out and shop around holidays and other seasonal moments, many are delaying purchases until the moment of need. Against that backdrop, our team continues to focus on providing unbeatable value for our guests."
From Macy's:
"We entered the 2nd quarter with an expectation that discretionary spend would remain stable, reflecting a resilient but choiceful consumer. As the quarter progressed, our customer became more discriminating, which we attribute to ongoing macroeconomic uncertainty and an increasingly complex news cycle."
"At Macy's, which was the most impacted by the shift in consumer behavior, we aligned our assortments and shifted our marketing calendar to better balance value and fashion...we are committed to reading and reacting in realtime to consumer demand to offer increasingly relevant product messaging and experiences at a compelling value regardless of the environment."
"To your question about the adjustments on promotions on marketing, the context that we are operating under is a consumer that's really oriented on value."
On guidance, "our outlook assumes a more discriminating consumer and heightened promotional environment relative to our prior expectations."
From Urban Outfitter:
"Towards the end of July and into August, we have observed a slight deceleration in retail segment sales compared to the 2nd quarter run rate. While consumer traffic has remained consistent, overall purchasing activity has shown some softening. New product launches continue to resonate well, though customers appear to be exercising more discretion in their buying decisions. Given the recency of these trends, we are approaching our 3rd quarter plans with measured caution."
"There are likely various macroeconomic factors influencing consumer behavior at this time, making it difficult to pinpoint specific causes. However, it is evident that the consumer sentiment has softened recently and the duration of this trend remains uncertain. During this time of uncertainty, we believe it is prudent to keep inventory levels lean and manage expenses appropriately, and that is exactly what we plan to do."
From Snowflake, whose stock is trading down but said "We continue to see signs of a stable optimization environment."
Also, "orders showed from a bookings standpoint that it's a normal environment and we are very pleased with the deals we closed in the quarter. I don't see it any worse. It's not euphoric or anything, but it's very stable customer buying pattern we're seeing."
From Analog Devices:
Their earnings "combined with improved customer inventory levels and order momentum across most of our markets, increased my confidence that our 2nd quarter marked the cyclical bottom for ADI. My optimism remains guarded, however, these challenging economic and geopolitical conditions are limiting a sharper recovery."
The automotive end market makes up about 30% of their business and was flat q/o/q and down 8% y/o/y. They said "automotive production cuts are extending inventory digestion across customers, particularly impacting our legacy automotive and electrification businesses."
Love 'em when they're up, hate 'em when they're down. That remains human nature in the stock market. With the bounce back, Investors Intelligence said Bulls jumped to 50 from 44.6. Interestingly though, Bears were up too, by .4 pts w/o/w to 21.9 and most of the drop occurred in the Correction side. In today's AAII, Bulls rebounded by 9.1 pts to 51.6, a 4 week high while Bears fell 5.2 pts to 23.7, the least in 4 weeks. The CNN Fear/Greed index is about dead on neutral at 52 vs 33 one week ago and 48 one month ago.
Bottom line, sentiment always chases the markets tail and continues to do so. That said, it's always important to acknowledge when things get extreme in either direction and prepare oneself for a shift in trend. That was so obvious of a set up in early July when bullish sentiment was as stretched as can be.
Ahead of the August US manufacturing and services PMI data today from S&P Global, India continues to be the economic stand out. It's PMI held at 60.4 vs 60.3 in the month before. Gains were seen for Japan and Australia m/o/m for both components.
PMI's also rose for the Eurozone and the UK. For the Eurozone, the bifurcation is stark though as manufacturing stands at 45.6 while services are at 53.3. France's service component in particular led the way at 55, thanks to the Olympics and that is up from 50.1 in July. It stood at 51.4 from Germany.
S&P Global was spot on, "It's a tale of two worlds. The manufacturing sector remains mired in recession, while the services sector still appears to be growing at a decent clip."
The UK was more balanced with manufacturing at 52.5 vs 52.1 in July. The services side was 53.3 vs 52.5 last month.
European yields are higher in response but the euro and pound are little changed after the run they've had. Stocks there are green across the board, modestly.
After the Bank of Thailand held rates unchanged at 2.5% yesterday, the Bank of Korea did today at 3.5%, both as expected. On the latter, they do seem to be leaning towards a cut in either October or November but only as a tweak.
Finally, the rail strikes have begun in Canada and we can only hope this ends ASAP because it will be hugely disruptive if it doesn't.
On the shipping cost side, they fell w/o/w for a 40 ft container in the Shanghai to Rotterdam trip but rose a bit to LA.
I Call BS to the 'Cash on the Sidelines' Argument (Part Deux)
* Based on history and as measured against the total market cap of equities, money markets provide far less fire power than is being argued.
* The cash on the sidelines arguments is a message typically delivered in an aging Bull Market.
* Moreover, whenever cash comes into equities from the sidelines it is usually signals a meaningful high or market top....
Yesterday on my fave 1 p.m. daily experience with Guy Adami, Liz Young and Dan Nathan on Market Call, there was a lengthy discussion of the "cash on the sidelines argument."
As well, subscriber Kdog88, noting my statement that cash should be viewed not in absolute terms but as a percentage of total market cap, asked the following in Wednesday's Comments Section:
21 hours ago
Dougie, Welcome back!
Totally agree with your stance regarding cash on the sidelines. This one data point you shared is the bottom line:
“Moreover, and importantly, retail money market funds as a percentage of total stock market capitalization is at a multi-decade low!”
Would love to see this represented in a historical chart if any one here can find it. Thanks!
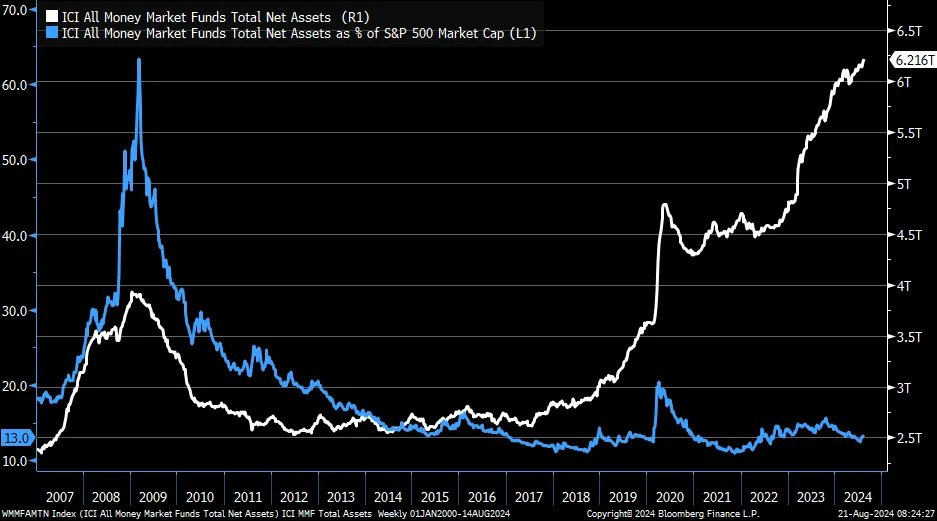
Here is the answer to Kdog's question in support of my observation that money market funds' total assets divided by the total equity market cap provide less "firepower" than is being argued in the business media:
Finally here is a copy of yesterday's column, "I Call BS to The Cash on the Sidelines" Argument:
AUG. 21, 2024 9:17 AM EDTAn Oldie but a GoodieOver on Bloomberg, Jon and Lisa are discussing whether the next catalyst to higher stock prices may be the $6 trillion of "cash reserves." Several of their panelists are suggesting this to be the case. As noted recently, I call BS to this commonly-held bull market argument: I Call BS to Goldman's View That Cash on the Sidelines Will Buoy the Markets
"O, then my best blood turn To an infected jelly and my name Be yoked with his that did betray the Best! Turn then my freshest reputation to A savour that may strike the dullest nostril Where I arrive, and my approach be shunn'd, Nay, hated too, worse than the great'st infection That e'er was heard or read!" - William Shakespeare
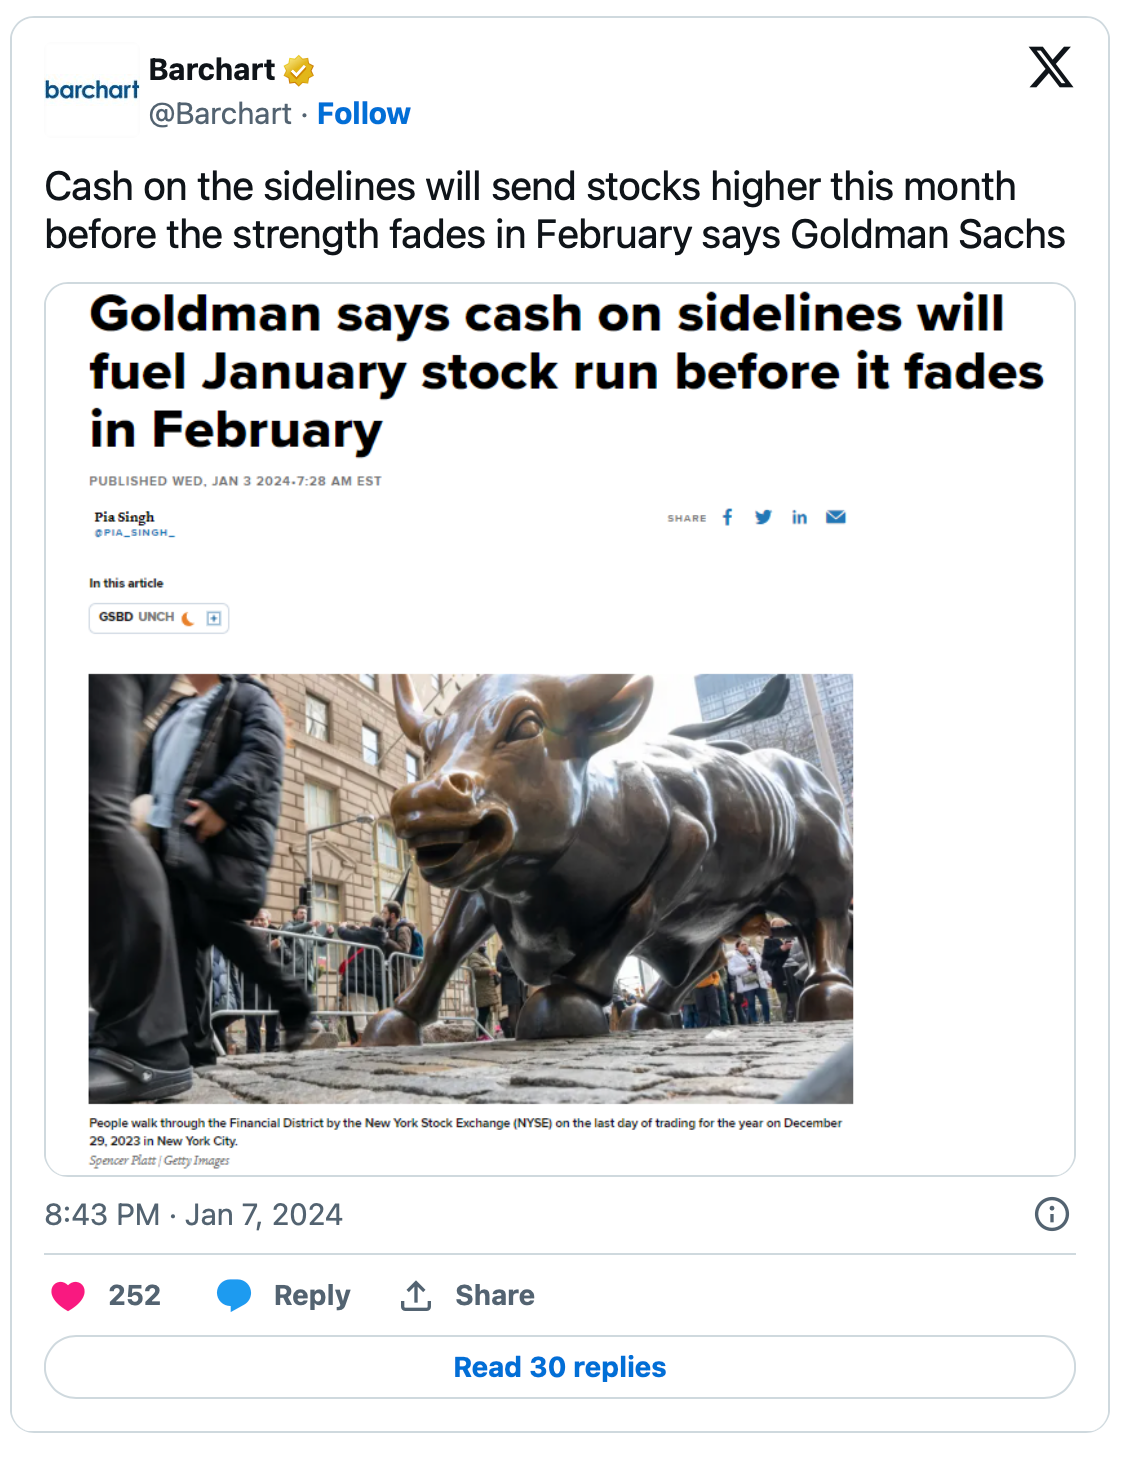
I disagree and call BS to Goldman's view; it is non rigorous and not based on history:
Here is why I believe the "money on the sidelines" argument is flawed. From Dec. 20:* Everyone is entitled to his own opinion but not his own facts* Facts are stubborn things, and whatever may be the wishes of the bulls they cannot alter the state of those facts that retail money market funds are a lot less than commonly discussed and massive migration into equities rarely occurs* Moreover, and importantly, retail money market funds as a percentage of total stock market capitalization is at a multi-decade low!* Finally, most of the retail savings in money market funds are associated with wealthy Americans* That said, and as noted by Bob Farrell, the public typically buys most at the top and the least at the bottom"I've already made my mind up, don't confuse me with the facts."- PlatoThe "old" argument that money on the sidelines will provide meaningful support of the next Bull Market leg has been bandied about in the business media by "talking heads" and investment strategists over the last few weeks."You mention cash on the sidelines, which is something we have heard many times with people on this network...."- Melissa Lee, CNBC (July 2023)The argument is bogus and inaccurate — and I call BS to it.
I conclude that although there is likely to be some benefit of excess savings in retail money market funds migrating into stocks — it will not be anywhere near enough to fuel a new Bull Market leg higher.
As well, such a migration rarely ever comes to fruition but it serves as a non rigorous crutch and a rationale to support the recent reset higher in stock valuations. Frankly, it is always an argument made in extended "up" moves in markets. (As an example, here is a August 2021 interview (over two years ago!) with Jim Cramer in which he expects money on the sidelines to fuel the markets. Jim Cramer says cash moving off the sidelines can help keep stock rally alive.
More importantly the data - the amount of money in retail money market accounts are vastly overstated (commonly said to total $6 trillion, but really only $2.2 trillion) - and, as such, is non supportive of the argument of sideline cash as a catalyst.
Let's now go to the facts and data:
Retail money market accounts total only $2.2 trillion (not $6.1 trillion)
The most important chart:
December 14, 2023
Money Market Fund Assets
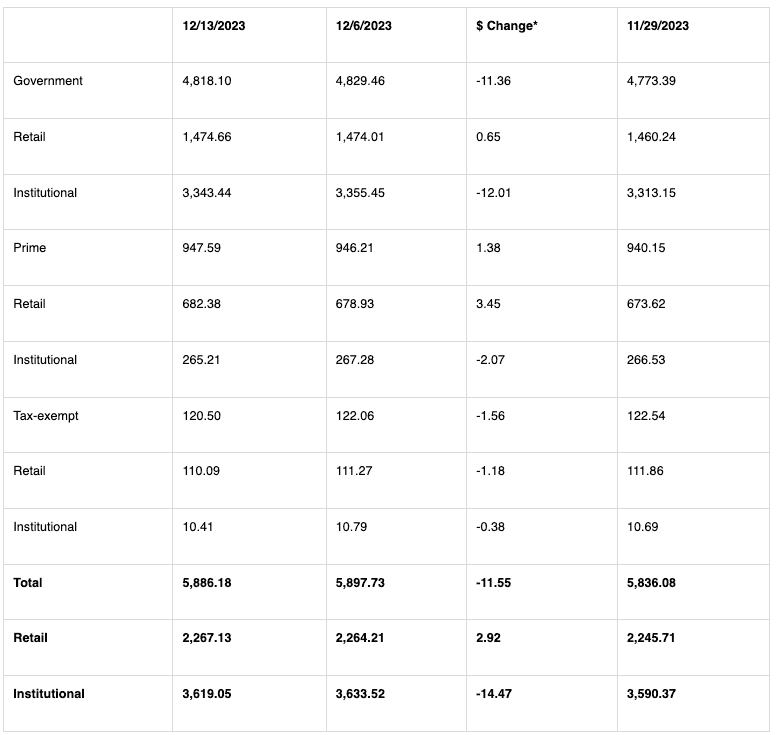
Washington, DC; December 14, 2023 - Total money market fund assets decreased by $11.55 billion to $5.89 trillion for the week ended Wednesday, December 13, the Investment Company Institute reported today. Among taxable money market funds, government funds2 decreased by $11.36 billion and prime funds increased by $1.38 billion. Tax-exempt money market funds decreased by $1.56 billion.
Assets of Money Market Funds
Billions of dollars
*Change in money market fund assets is primarily driven by flows and can be used as a proxy for net new cash flows.
Note: Components may not add to the total or compute to the $ change due to rounding.
Retail: Assets of retail money market funds increased by $2.92 billion to $2.27 trillion. Among retail funds, government money market fund assets increased by $651 million to $1.47 trillion, prime money market fund assets increased by $3.45 billion to $682.38 billion, and tax-exempt fund assets decreased by $1.18 billion to $110.09 billion.
Institutional: Assets of institutional money market funds decreased by $14.47 billion to $3.62 trillion. Among institutional funds, government money market fund assets decreased by $12.01 billion to $3.34 trillion, prime money market fund assets decreased by $2.07 billion to $265.21 billion, and tax-exempt fund assets decreased by $381 million to $10.41 billion.
ICI reports money market fund assets to the Federal Reserve each week. Data for previous weeks reflect revisions due to data adjustments, reclassifications, and changes in the number of funds reporting. Weekly money market assets for the last 20 weeks are available on the ICI website.
As seen in the above table, retail money market assets total only about $2.25 trillion — not the "$6 trillion" mentioned by the many.
The "other" monies in money market funds are institutional in nature — and I don't think this money is "hot" money that will move into a climbing stock market.
Retail Money Market Funds Are at a Multi-Decade Low Relative to Total Stock Market Capitalization
To calculate retail money market funds' possible impact we can't simply look at the absolute amount of monies in money market accounts.
Rather, we must take total retail money market funds as a percent of stock market capitalization: TODAY IT IS AT A MULTI-DECADE LOW!
Retail Money Market Accounts Rarely Change Over Time
If you look at history the level of retail money market funds rarely changes:
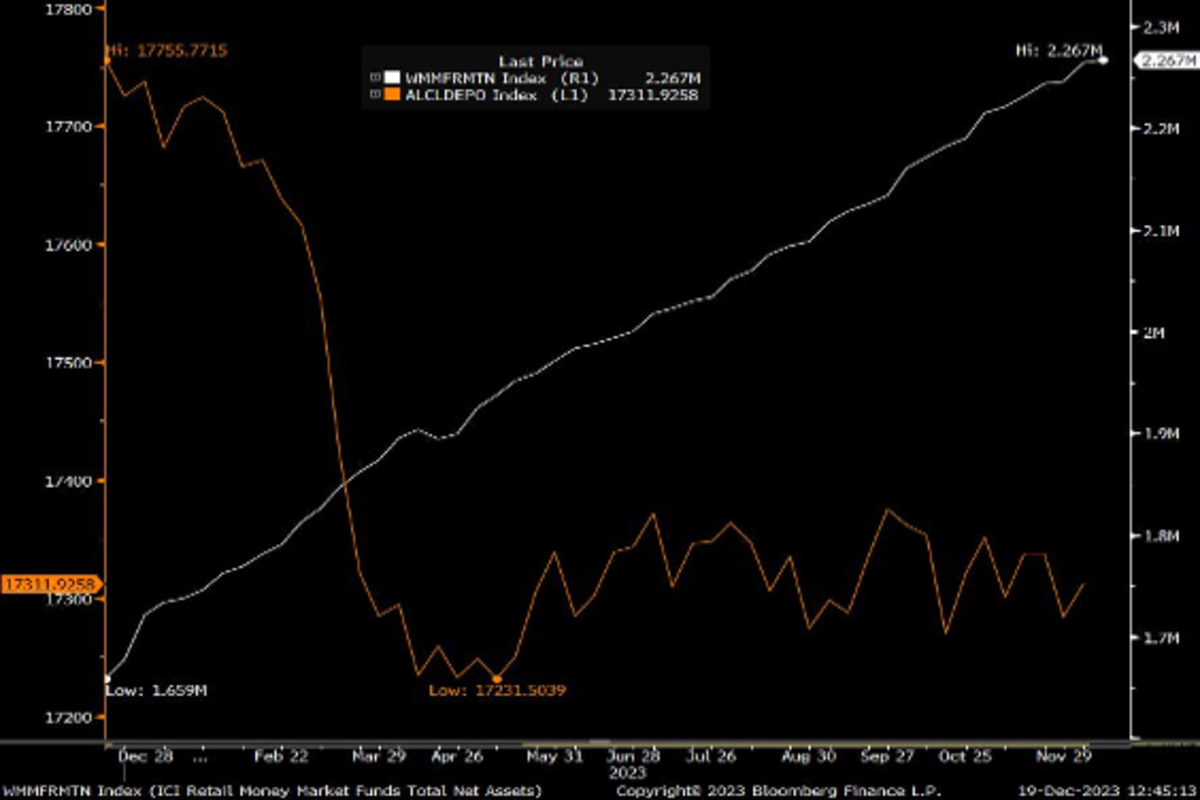
Furthermore, a lot has been made of the near $600 billion rise in retail money market accounts over the last 12 months. However, as noted in Peter Boockvar's chart below, the rise in retail money market funds over the past year pretty much mimics the drop in bank deposits in terms of dollars.
Source: Peter Boockvar
Speaking of my pal Peter, here is what he wrote this morning on the subject of cash on the sidelines:
I will first comment on the 'cash on the sidelines' debate that I keep hearing about and have for many years and the belief on the part of some that it's this pot of dry powder to 'come into the stock market.' There is ALWAYS cash on the sidelines as for every dollar that comes off the sidelines to buy a share of stock there is a dollar that comes back on the sidelines from the seller with the proceeds. The only time there is technically fresh money is when there is an IPO or equity secondary as new shares are created.
I mentioned yesterday that Friday saw the biggest ETF inflows into SPY since its 1993 inception and here is a chart to visualize. The $20.8 billion Friday inflow was followed by another $10.2 billion on Monday. It finally cooled down yesterday.
Yields on Money Market Instruments and Short Dated Treasuries Remain Near 5%
* With a high, risk-free equity-like return (with no volatility) available in money market accounts, the incentive to move large amounts of retail and institutional into equities is relatively low
"The public buys the most at the top and the least at the bottom."
-Bob Farrell, Market Rule #5
Not only are money market accounts still earning near 5%, but consider the following returns on short-dated Treasuries:
* Three-month treasury bill yields 5.425%
* Six-month treasury bill yields 5.346%
* One-year treasury bill yields 4.973%
* Two-year treasury note yields 4.384%
Though I expect some migration (as seen recently below), a massive migration out of money market accounts and into equities seems unlikely given the alternatives above:
And, as Bob Farrell cites above, the public buys the most at the top.
I expect nothing different in this cycle.
Bottom Line
The size of retail money market funds balances has been greatly exaggerated by nearly a factor of 3x.
In marked opposition to the bullish musings about cash on the side lines, the amount of retail money market funds measured against total stock market capitalization is at a multi-decade low!
As Peter Boockvar observed this morning: 1-1=0. (There is ALWAYS cash on the sidelines as for every dollar that comes off the sidelines to buy a share of stock there is a dollar that comes back on the sidelines from the seller with the proceeds).
In reaching for an argument to extend the recent bull move, "talking heads" are making an argument that does not conform to the facts, analysis, history or common sense.
The S&P short range oscillator has now rapidly moved towards the level that existed at the recent top in the markets in mid-July.
Overnight (and from Tuesday to Wednesday) the oscillator has increased from 5.46% back up to 7.29%. This is a deeply overbought signal.
However, the very notion that this necessarily means that the market is making or is approaching an important top simply because of that overbought is, as we all know, not necessarily accurate (nor does it provide a precise indicator of timing).
But it does, at least to me, indicate a sharply-diminishing upside reward versus downside risk.
To paraphrase John Maynard Keynes, we know that markets can stay overbought (and oversold!) longer than we can stay solvent!
Every subscriber holds a different risk profile — which is based on a number of factors including one's balance sheet, needs, health, obligations, age, etc.
My risk appetite is different than Randorama's, whose risk profile is different than Johnny The Greek's, whose is different than that of Tech Nova. Skeptcl's appetite is different than JeffI's.
You see my point!
That said, while there are (and always are!) numerous long opportunities, I now see more compelling opportunities on the short side — of an intermediate character — than I have seen in some time, particularly relative to the aforementioned long opportunities.
But, given my risk appetite, I tread slowly on the short side — particularly given the formidable challenges of short selling:
Stocks tend to rise over time.
Rewards of being long (relative to being short) are asymmetrical. We can make only 100% on the short side but we can lose an infinite amount (in theory) if wrong as individual equities continue higher.
Risk management is more difficult on the short side than the long side — as a short expands as a percentage of a portfolio if the underlying stock rises, while a long decreases as percent of a portfolio if the underlying stock declines.
To summarize, even though my ursine thesis may prove correct, most should not short stocks.
However, while the market's momentum over the near term is close to unprecedented and the market may be overvalued — building up cash reserves (particularly with such high short-term interest yield opportunities) seems to make a lot of sense at this point of time.
U.S.: Futs are flat ahead of Jackson Hole, given the Fed mins the market will look for the continuation of a dovish message and hints of 25 BPS or 50 BPS cuts. Bond yields are higher by 1 to 2 BPS and the USD is bid pre-market. Mag 7 and semis are higher pre-market. Within commodities base metals continue to move higher and crude is flat. Today’s macro data focus is on jobless claims, flash PMIs and existing home sales. XHB is trailing (SPX) by 4.7% MTD but is outperforming by 3% since August 16.
and...
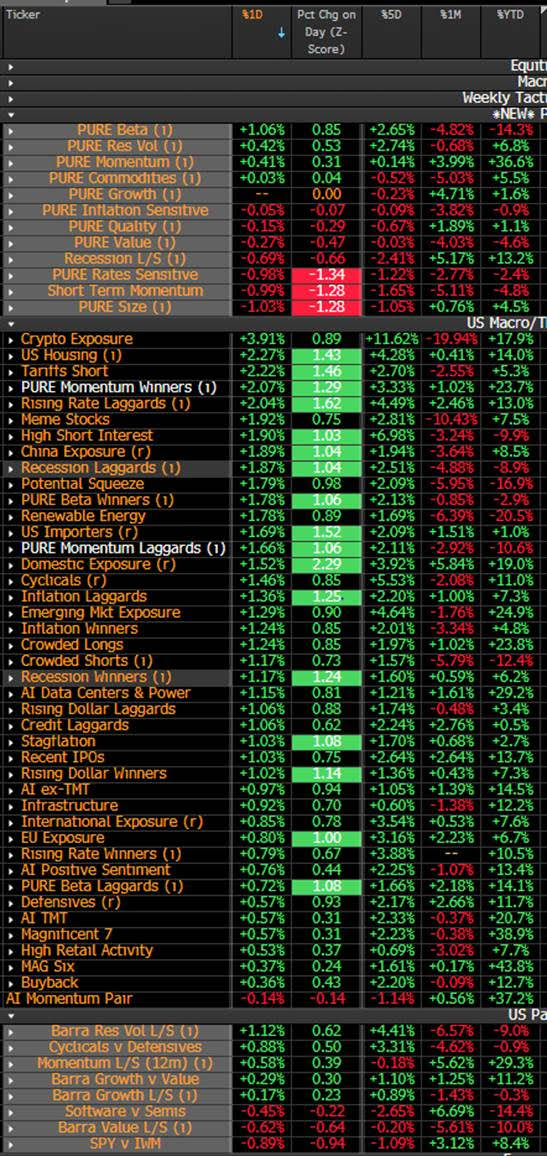
Equity and Macro Narrative: Yesterday, stocks closed higher led by RTY; 10 out of 11 SPX sectors finished higher. Overall, equities found support from TGT and TJX earnings, which emphasized the resilient strength of U.S. consumers and were in line with the views from WMT earnings. Payroll revisions and Fed minutes did change the bullish the narrative. Thematically, cyclicals outperformed defensives and growth outperformed value. U.S. housing, momentum winners and high short interest are among the top performing baskets.