Closing Market Internals
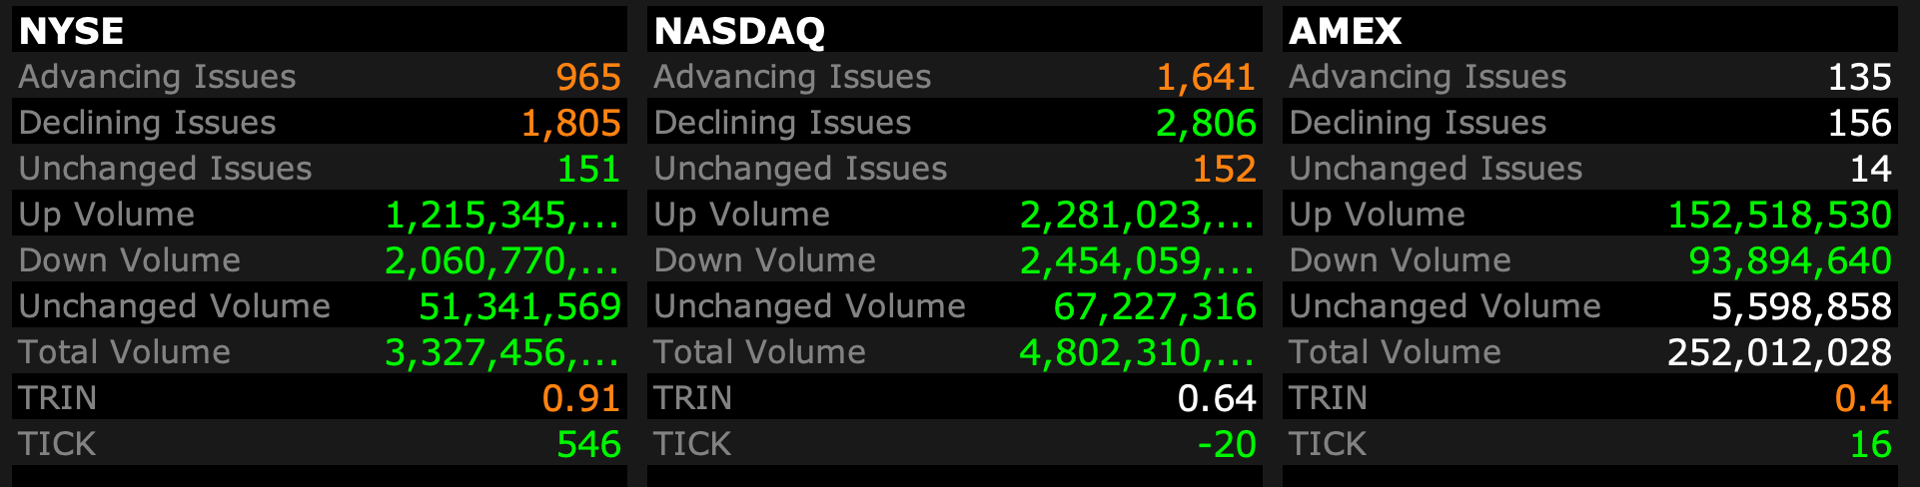
Volume
- NYSE volume 367M shares, 21% below its one-month average;
- NASDAQ volume 3.95B shares, 7% below its one-month average
Breadth
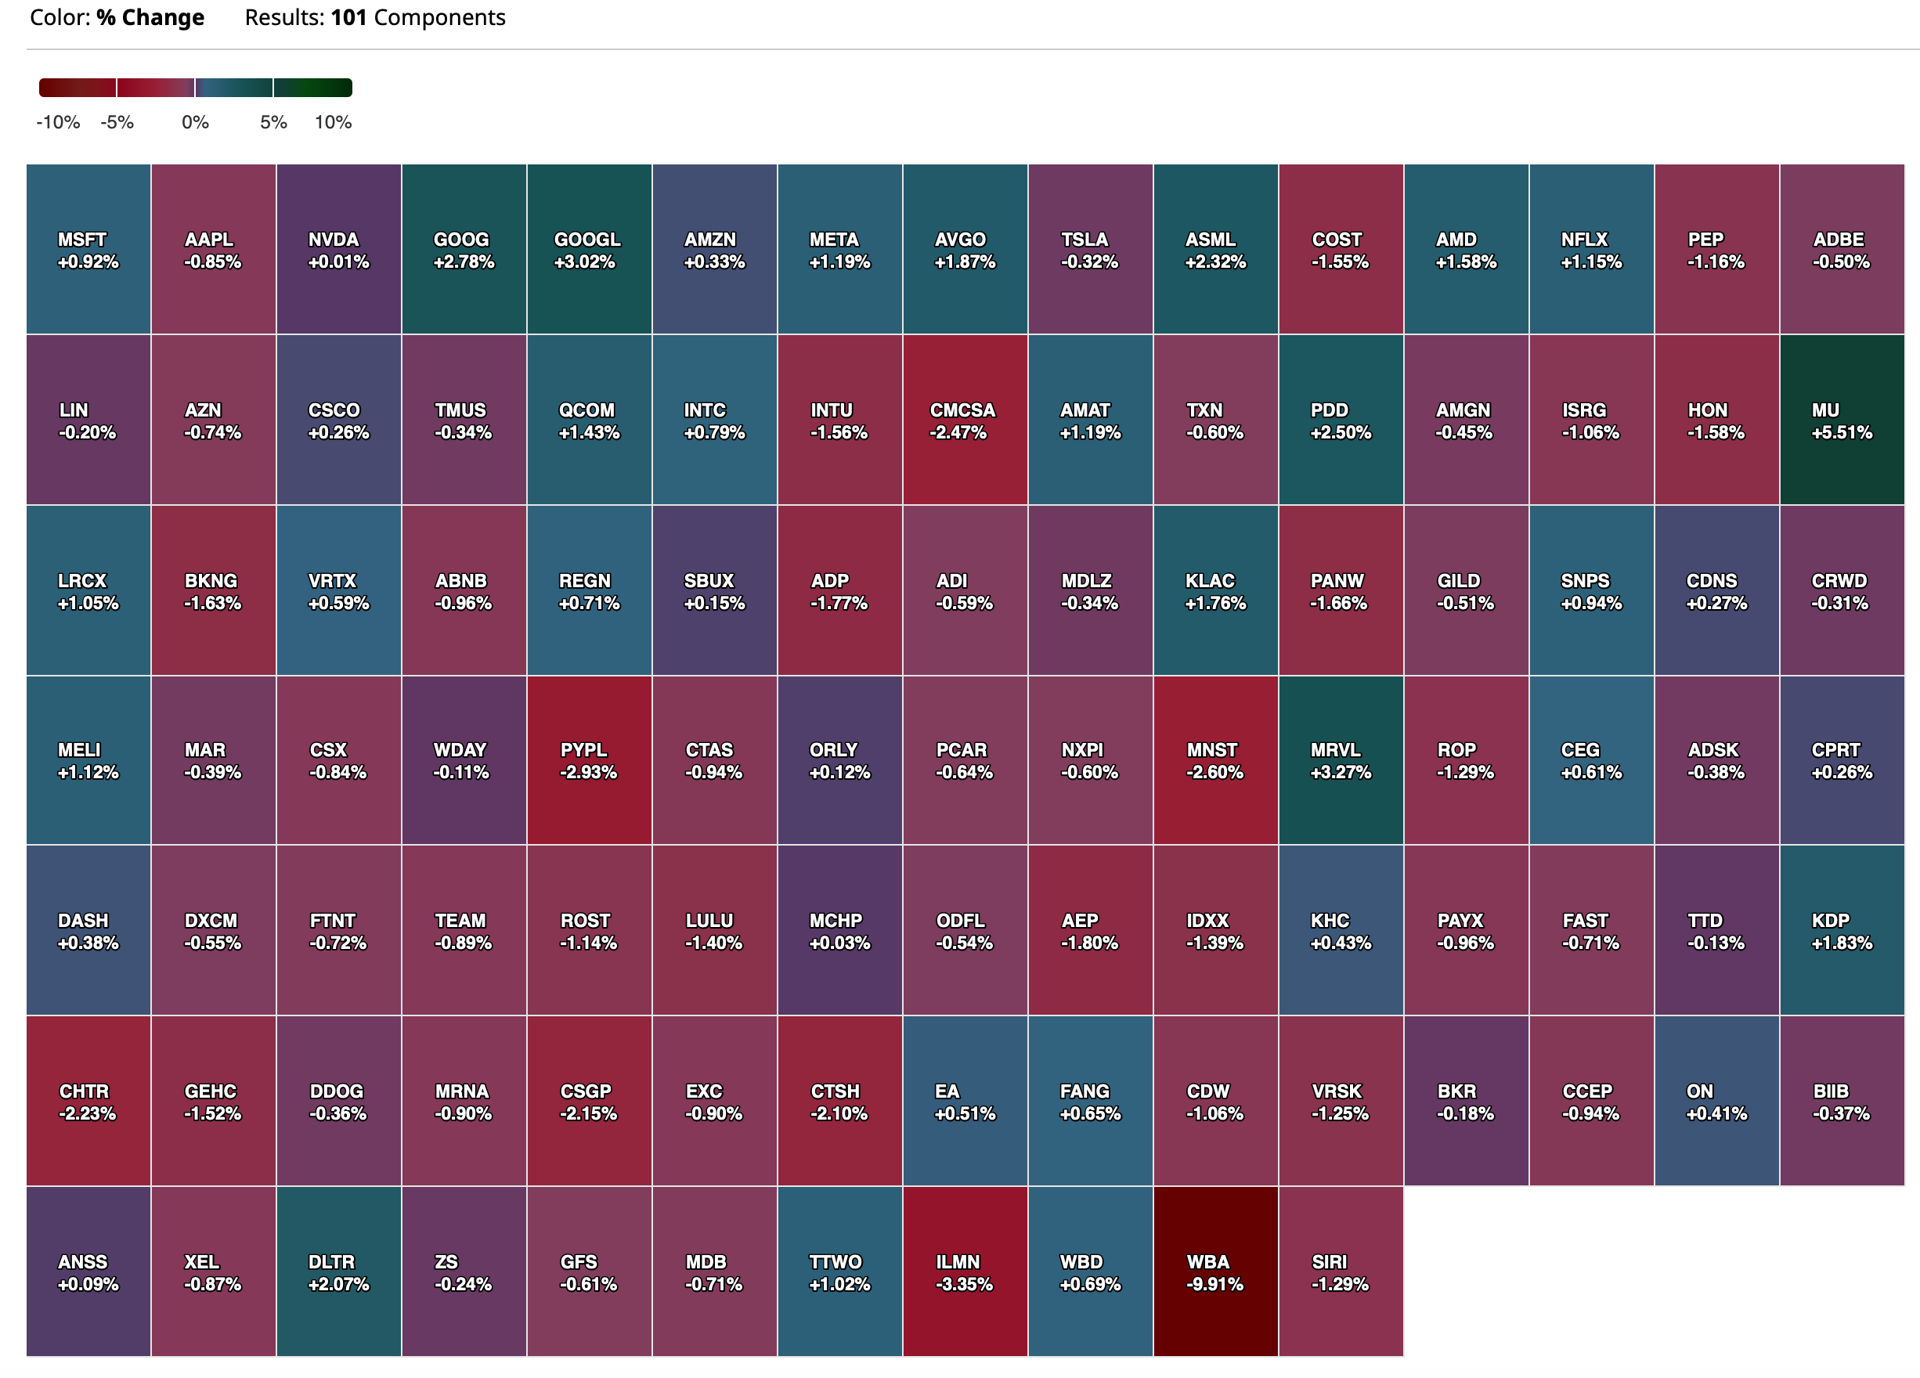
Nasdaq 100 Heat Map
BY Doug Kass · Apr 1, 2024, 4:51 PM EDT
 Doug KassDoug Kass
Volume
- NYSE volume 367M shares, 21% below its one-month average;
- NASDAQ volume 3.95B shares, 7% below its one-month average
Breadth
Nasdaq 100 Heat Map
BY Doug Kass · Apr 1, 2024, 4:51 PM EDT
I am running out to a trivia event at a local hotel.
Thanks for reading my Diary.
Enjoy your evening.
Be safe.
BY Doug Kass · Apr 1, 2024, 4:30 PM EDT
With MSOS trading at $10.65:
I wouldn't be surprised if we see a sell on the news now on MSOS - after the initial bump higher as expected.
There is still a lot of heavy lifting for voters to approve the measure on the ballot.
BY Doug Kass · Apr 1, 2024, 4:22 PM EDT
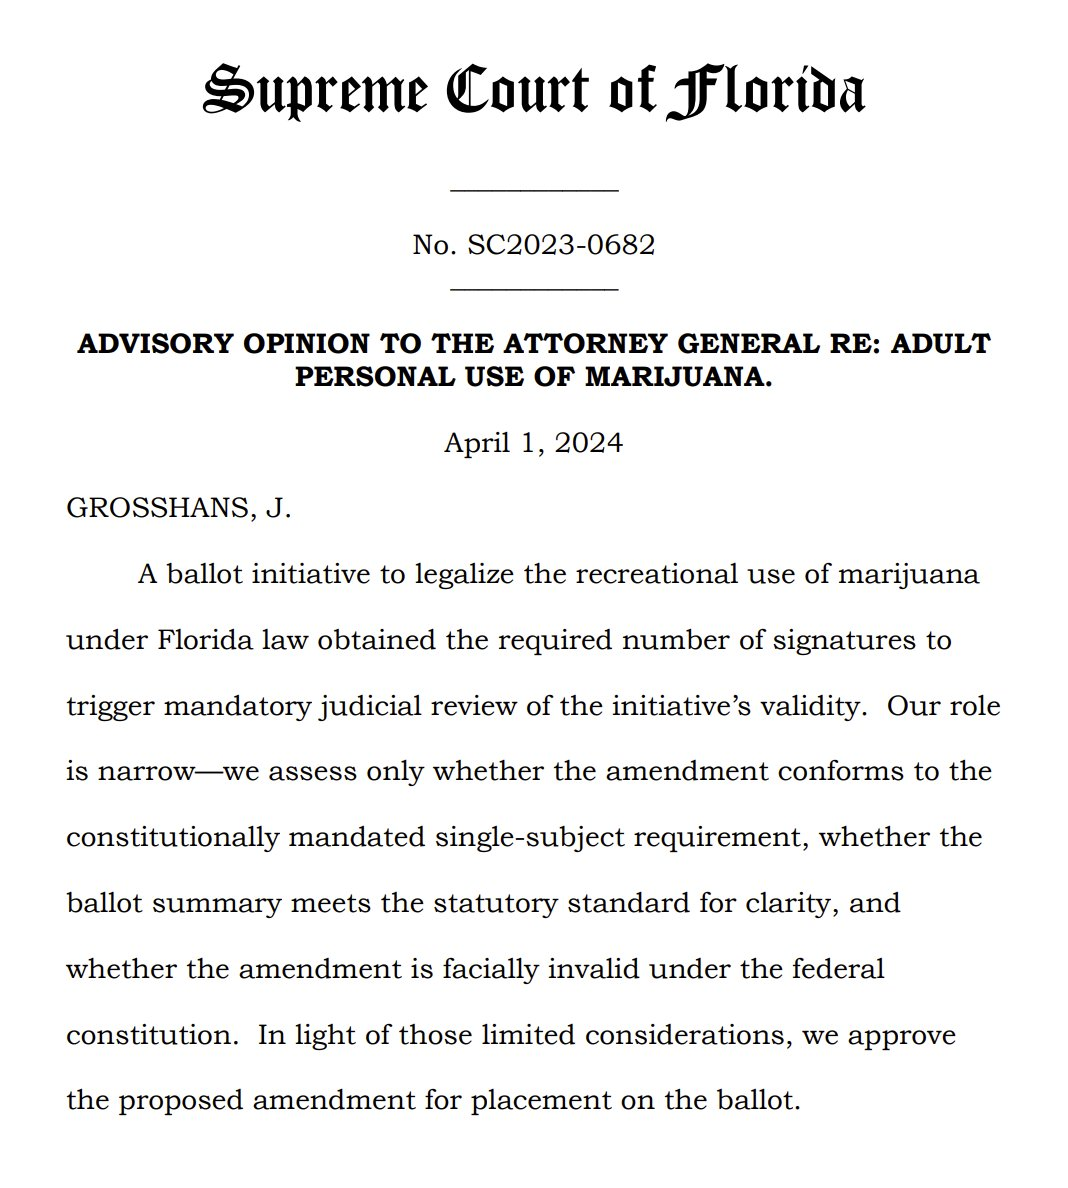
Break in.
Florida permits recreational use on the ballot in November.
BY Doug Kass · Apr 1, 2024, 4:10 PM EDT
SPY -0.23%
QQQ +0.09%
RSP (S&P equal weighted) -0.60%
IWM -0.92%
BY Doug Kass · Apr 1, 2024, 4:05 PM EDT
* Have no "drama," again, today...
FRHC, WBA, SBUX, WGO, CHGG, AAPL, TSLA, FIGS, BXMT, MPW, WOOF and SNBR.
BY Doug Kass · Apr 1, 2024, 3:55 PM EDT
Robbo
Dougie, how significant to you think the Fla Supreme Ct decision or no decision will be on the weed sector.
Dougie Kass
Significant, but a lot priced in.
I would say MSOS +$0.50 if on ballot and -$0.75 to -$1.00 if not on ballot.
But just guessing.
BY Doug Kass · Apr 1, 2024, 3:48 PM EDT
Here about the State of Florida's decision on cannabis at 4 pm today.
BY Doug Kass · Apr 1, 2024, 3:30 PM EDT
If you told me the yield on the ten year US note would rise to 4.327% - a gain of over 13 basis points - I would have expected a materially lower day in equities.
But this is not my father's market - as it is driven by momentum and flows.
That said, it remains my view that stocks are substantially overvalued.
BY Doug Kass · Apr 1, 2024, 3:15 PM EDT
From Charlie! here.
BY Doug Kass · Apr 1, 2024, 3:04 PM EDT
I am buying some lottery tickets on Viking Therapeutics VKTX.
A very small investment and I am willing to tear up the cheap calls.. and out of the money with short term expirations.
Maybe PFE, LLY, JNJ or MRK wakes up!
BY Doug Kass · Apr 1, 2024, 2:24 PM EDT
The Federal Reserve has a dual mandate.
But the level of annual interest costs to service US debt is off the charts - does reducing those payments represent a third mandate?.
Today's generation of investors doesn't remember what happened the last time inflation was higher for longer.
Will the bond vigilantes ride again?
BY Doug Kass · Apr 1, 2024, 1:36 PM EDT
* We continue to see DJT value at under $10/share...
After the reversal from the peaks late last week, DJT is down by another -$14/share, or -22% today. (Serious 3NT.)
We added to the short on Thursday and this morning:
I added to my DJT short this morning - moving from very small to small-sized.
Position: Short DJT common (VS) and calls (S)
MAR 28, 2024 12:40 PM EDT
and...
* Increased size of DJT short (as I did on Thursday) at $59.85.
APR 1, 2024 7:20 AM EDT
BY Doug Kass · Apr 1, 2024, 12:50 PM EDT
My only buy today is Viking Therapeutics VKTX - I have been averaging down, today's cost basis is $78.95.
BY Doug Kass · Apr 1, 2024, 12:02 PM EDT
CRE signals trouble:
While higher interest rates have yet to hurt the broad stock market, commercial real estate (CRE) is a completely different story. Beyond anecdotal evidence of urban office buildings changing hands at 75% discounts to their last sales, the overall CRE market faces a mountain of debt maturities over the next three years that poses serious challenges to real estate owners and their regional bank lenders.
Newmark, a real estate advisory and brokerage firm, estimates that $2 trillion of US commercial real estate debt will mature between 2024 and 2026. This debt will obviously have to be refinanced at much higher rates since the loans were taken out during ZIRP/QE. This year alone, $929 billion of debt alone has to be refinanced. Newmark estimates that $670 billion, or roughly one-third, of the $2 trillion of debt coming due through 2026 is distressed, primarily office and multi-family residential apartment properties.
The office market in particular remains oversupplied with Newmark suggesting that 50 mm square feet in New York City alone “should be taken down” according to the Financial Times.
One of the reasons this 3-year maturity wall is so high is that many lenders granted short-term extensions during the pandemic and its aftermath, a period plagued with political, geopolitical and economic uncertainty. A similar phenomenon of “extend-and-pretend” allowed corporate borrowers to defer defaults, but the backlog of bad paper there is also building.
Most likely CRE will see more deferrals if market conditions don’t improve; lenders always see default as the worst possible option. Right now, there is a huge gap between bargain hunters and owners/sellers; real estate deal volumes were down by 51% last year according to MSCI. This likely means the market will remain moribund with transactions occurring only when parties see no alternative and decide to bite the bullet and take their losses.
This is not only a problem for real estate owners and investors; it is also a major problem for their lenders who include many regional banks in the U.S. The recent infusion of $1 billion of capital into New York Community Bancorp (NYCB) was necessitated in part by that bank’s high exposure to multifamily housing loans (and $1 billion may not be enough).
Regional banks are at the epicenter of the $2 trillion maturity wall facing the industry between now and 2026. More of them will likely be seeking capital infusions in the next couple of years, and virtually all of them are looking to reduce their real estate lending. This will create opportunities for the $10+ trillion private credit sector, but debt will not come cheap and the cost of carry in the CRE industry will rise significantly (even if the Fed lowers rates by a couple of hundred basis points over the next three years).
CRE was the first sector to feel the effects of higher interest rates but won’t be the last. Corporate defaults are inching up with dollar volumes becoming significant even if defaults as a percentage of the market look low because of the large size of the market. Credit market participants have grown adept at stretching out losses but that is not the same as eliminating them.
The frozen PE deal market coupled with rising defaults are eroding PE and private credit market returns (which were already mediocre - especially when risk-adjusted). The PE/private credit bubble enabled by the Fed’s ZIRP/QE policies is deflating.
Everybody is distracted by new highs in the stock market, the presidential election, and wars in Ukraine and Israel. But credit markets are sending signals that the fabric of the overleveraged American economy is under serious strain. Keep your eye on the ball.
BY Doug Kass · Apr 1, 2024, 11:52 AM EDT
From Peter:
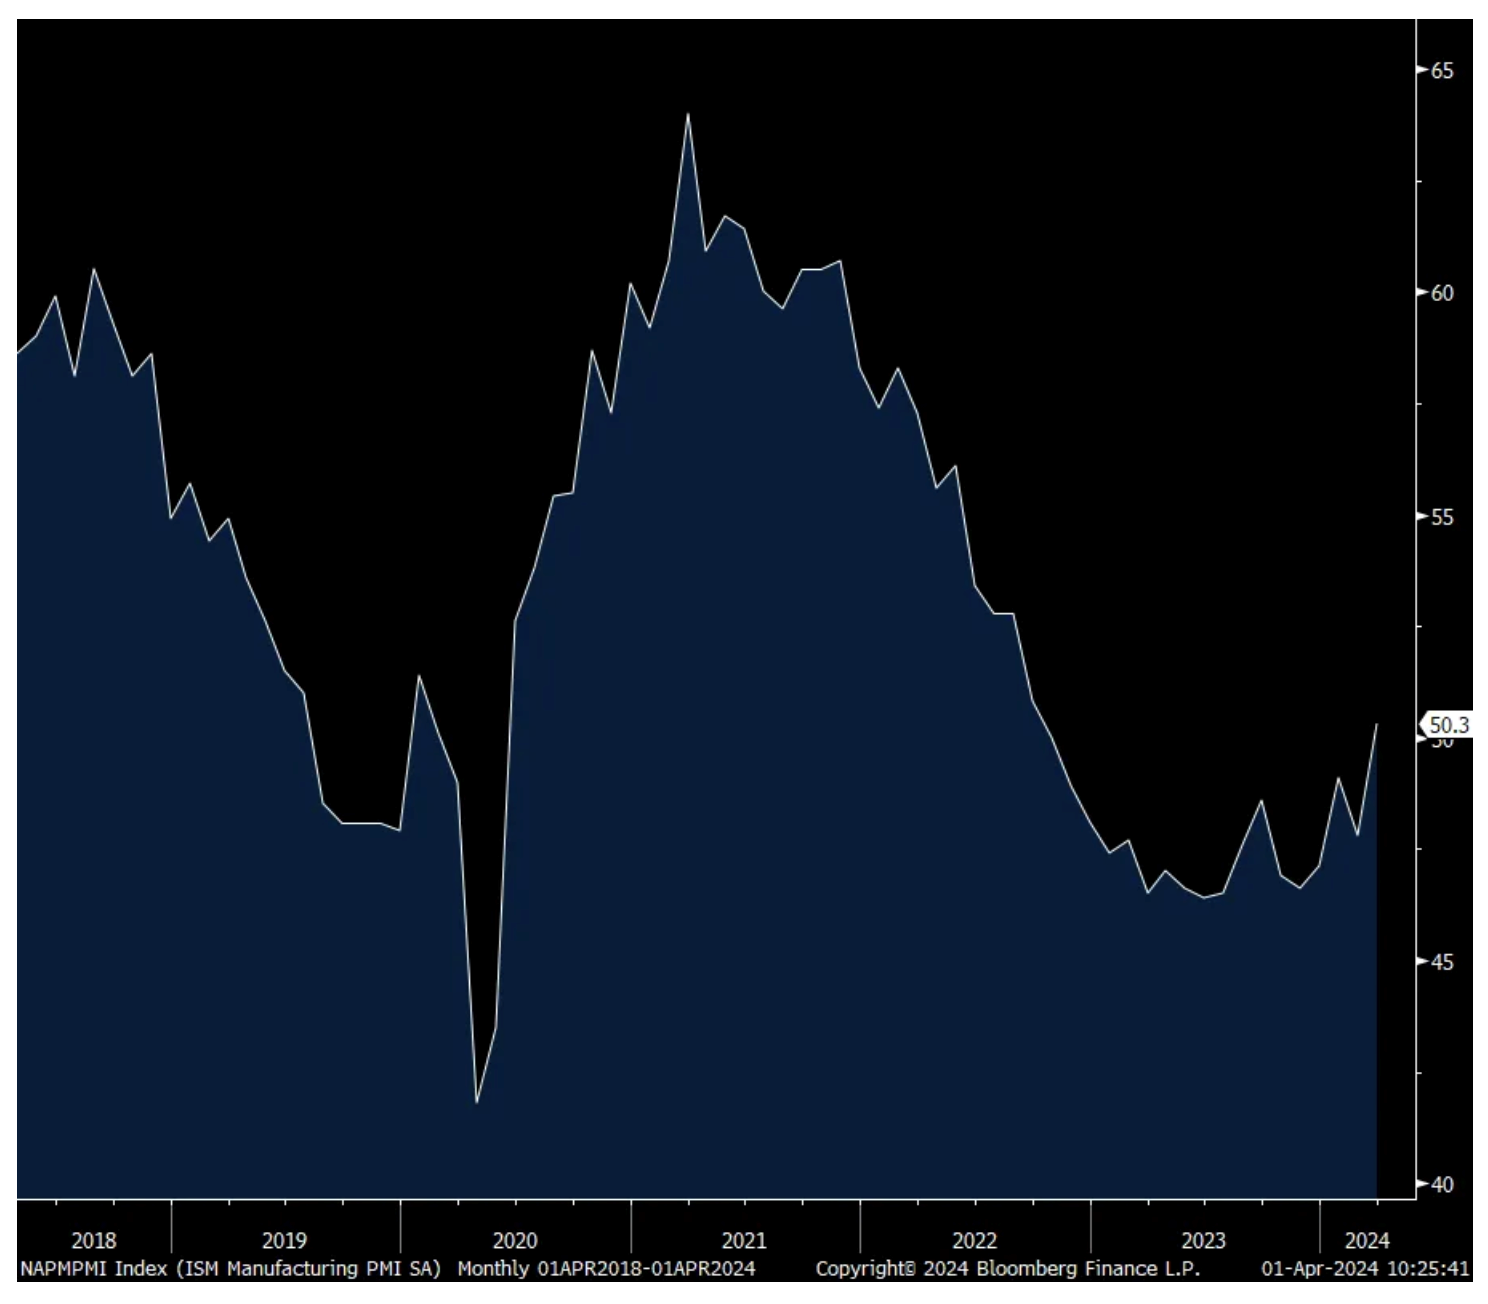
The March ISM manufacturing index finally got back to a 50 handle for the first time since October 2022 at 50.3 vs 47.8 in February and 49.1 in January. That was 2 pts above expectations.
A 6.2 pt jump in production (fulfilling previous new orders) was the main factor for the upside to 54.6, the best since June 2022. New orders rose 2.2 pts m/o/m to 51.4 and the 2nd month in the past 3 above 50 for the first time since the summer of 2022. Backlogs though remained well below 50 at 46.3, unchanged m/o/m.
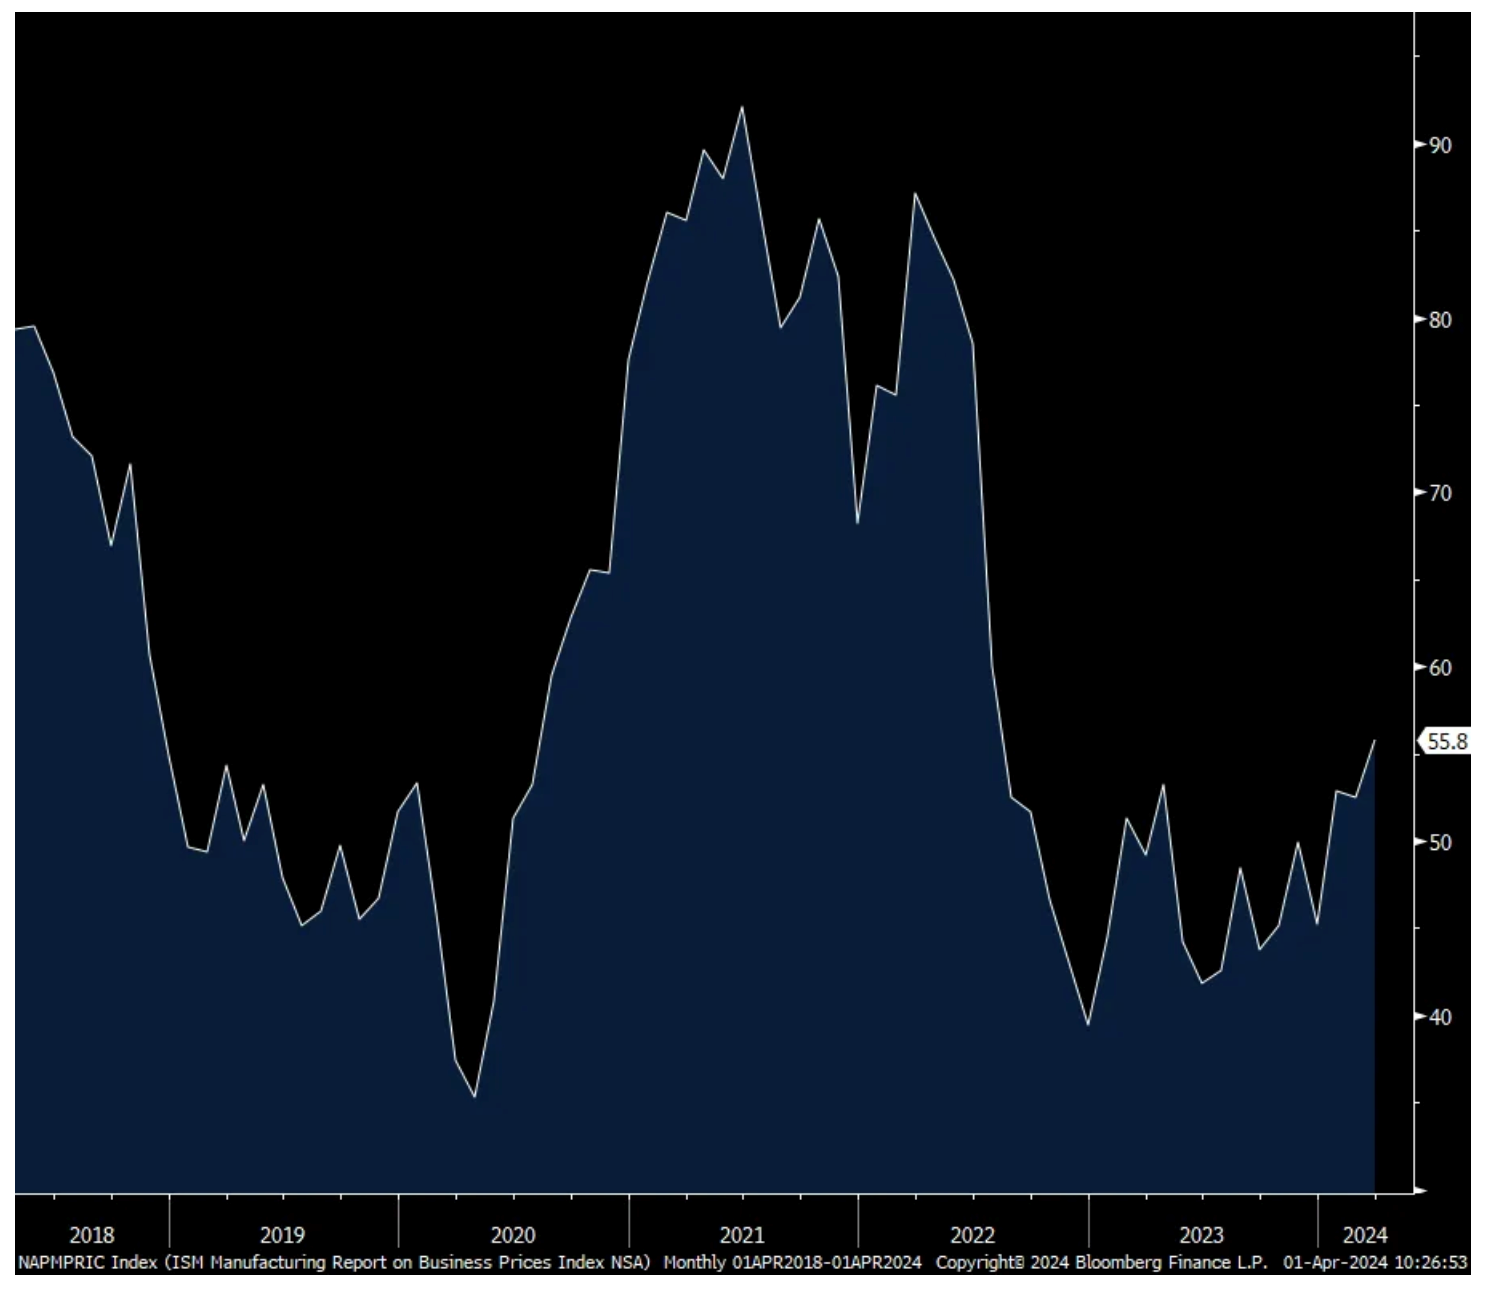
Inventories remained low at both manufacturers and customers with the former at 48.2 vs 45.3 and the latter at 44 vs 45.8. Employment rose 1.5 pts but still in contraction at 47.4. Export orders were unchanged at 51.6. Supplier deliveries at 49.9 was around the flat line for a 3rd month. Finally, prices paid rose 3.3 pts to 55.8 and that is the most since July 2022.
Breadth improved slightly as 9 industries of 18 surveyed seeing growth vs 8 in February while 6 said their business contracted vs 7 in the month before. The balance saw no change in business.
I will add that it’s really hard to separate out the influence of the government incented manufacturing facility construction going on and the collateral impact that has to suppliers, in addition to whatever infrastructure projects are getting started via that legislative bill. That said, there is clearly some hope that after nearly 2 years of recession, the manufacturing sector is on the cusp of that inventory build.
In this number though it is a mixed picture and not yet apparent and see below what the S&P Global report said on this. We also saw rising cost pressures as stated with prices paid and see below as to what S&P Global said on this too.
The S&P Global manufacturing index fell a touch to 51.9 from 52.2, though above 50 for a 3rd straight month. They also saw a gain in production along with “Rising capex spending has likewise buoyed orders for machinery and equipment.” Again, we don’t know here what is organic and what is Congressional legislation induced.
On the lack of inventory build, “firms generally signaled a preference to draw down inventories amid sufficient holdings and efforts to improve cash flow. Purchasing activity and stocks of both inputs and finished goods were all scaled back following increases in February.”
On growing price pressures, “Input costs increased sharply, with the rate of inflation ticking up from that seen in February. Higher oil and raw material costs, plus increased transportation rates, reportedly added to cost burdens at the end of the first quarter. Meanwhile, the impact of rising labor costs was mentioned as a factor pushing up selling prices at a number of manufacturers. As a result, the rate of output price inflation quickened for the 4th month running to a sharp pace that was the fastest in just under a year.”
Bottom line to both figures, there is certainly hope that the manufacturing sector is bottoming but sustainability to that will need to include both inventory restocking and stronger end demand. Also of note, and something I’m now arguing, it looks like goods prices are bottoming and now curling higher.
Treasury yields jumped immediately in response to the data with the 2 yr yield now recovering all that was lost on the day of the dovish Fed meeting, now at 4.69%. The 10 yr yield at 4.30% is now above where it stood at 1:59pm that day. Inflation breakevens are mixed, down 2 bps for the 2 yr but higher by 2 bps for each the 5 yr and 10 yr maturities.
ISM Mfr’g
Prices Paid
BY Doug Kass · Apr 1, 2024, 11:15 AM EDT
* I haven't done a "Trade of the Week" in a while
* SPY ($523.50) and QQQ ($446.15)
Here is the potentially near term negative setup as I see it:
While most remain preoccupied with the strength in the market's price momentum - I continue to see some developing and disturbing trends.
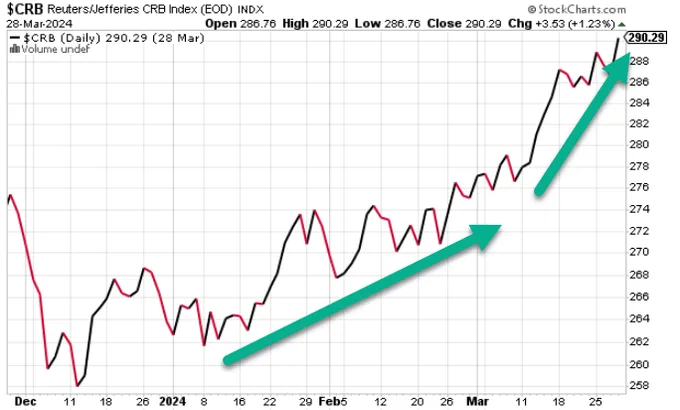
More specifically, the bullish investor sentiment unanimity -- as Peter Boockvar expressed this morning -- and the continued rise in the price of commodities has been ignored.
Also not discussed in the business media this morning is the continued reversal in bond yields (higher) since the early morning low in yields:
* The yield on the 2 year US note is now +2 bps to 4.63%.
* The yield on the 10 year US note is +8 bps to 4.26%.
* The long bond is +8 bps to 4.412%.
Don't worry... be happy.
But I am continuing to raise my short exposure in the face of a thinning equity risk premium, the continued reacceleration in inflation and the historically high equity market valuations.
High stock prices are the enemy of the rational buyer.
Position: None
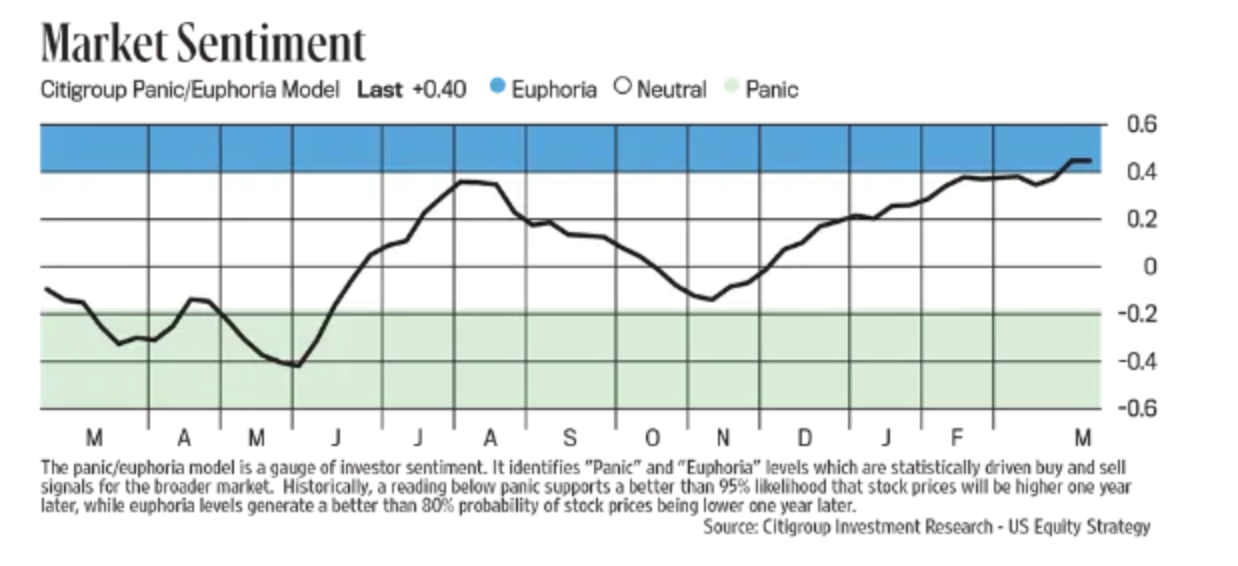
I'm going to start with stock market sentiment, which I usually do on Thursday's after I see both the Investors Intelligence and AAII surveys, because the weekly Citi Panic/Euphoria index I see via Barron's on Saturday's has entered Euphoria and at .40 is the highest since mid January 2022 (and which spent almost the entire year in the Euphoria category in 2021 so tough to time).
The importance of this survey according to Citi itself is while it is a "gauge of investor sentiment" like others, "It identifies 'Panic' and 'Euphoria' levels which are statistically driven buy and sell signals for the broader market. Historically, a reading below panic supports a better than 95% likelihood that stock prices will be higher one year later, while euphoria levels generate a better than 80% probability of stock prices being lower one year later."
So, as markets are higher most of the time and Citi has statistical metrics that say there is "a better than 80% probability of stock prices being lower one year later" when Euphoria has been realized, we should all take note. As stated though, it was very euphoric all throughout 2021 and markets kept elevating (though the most speculative stuff peaked in February 2021) so no one can be sure of the timing of when this matters but for those of us managing other people's money and in the risk management business, we should take heed. Especially when we combine this with the more than 40 point spread in II between Bulls and Bears which rarely occurs.
Source: Hedgeye
BY Doug Kass · Apr 1, 2024, 10:52 AM EDT
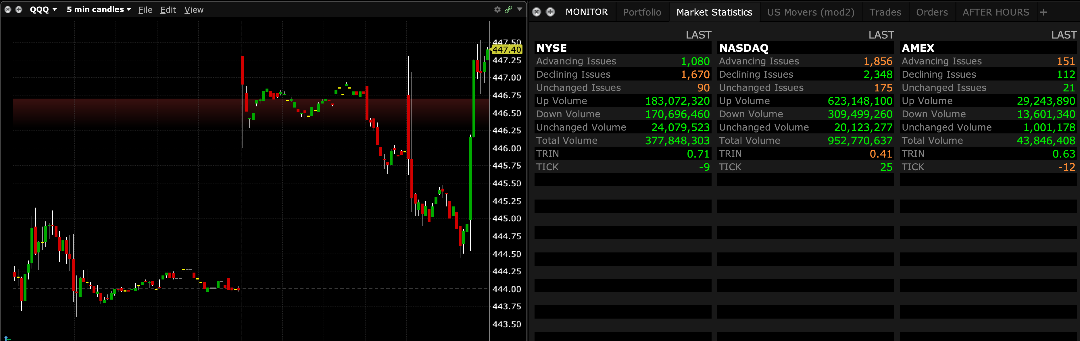
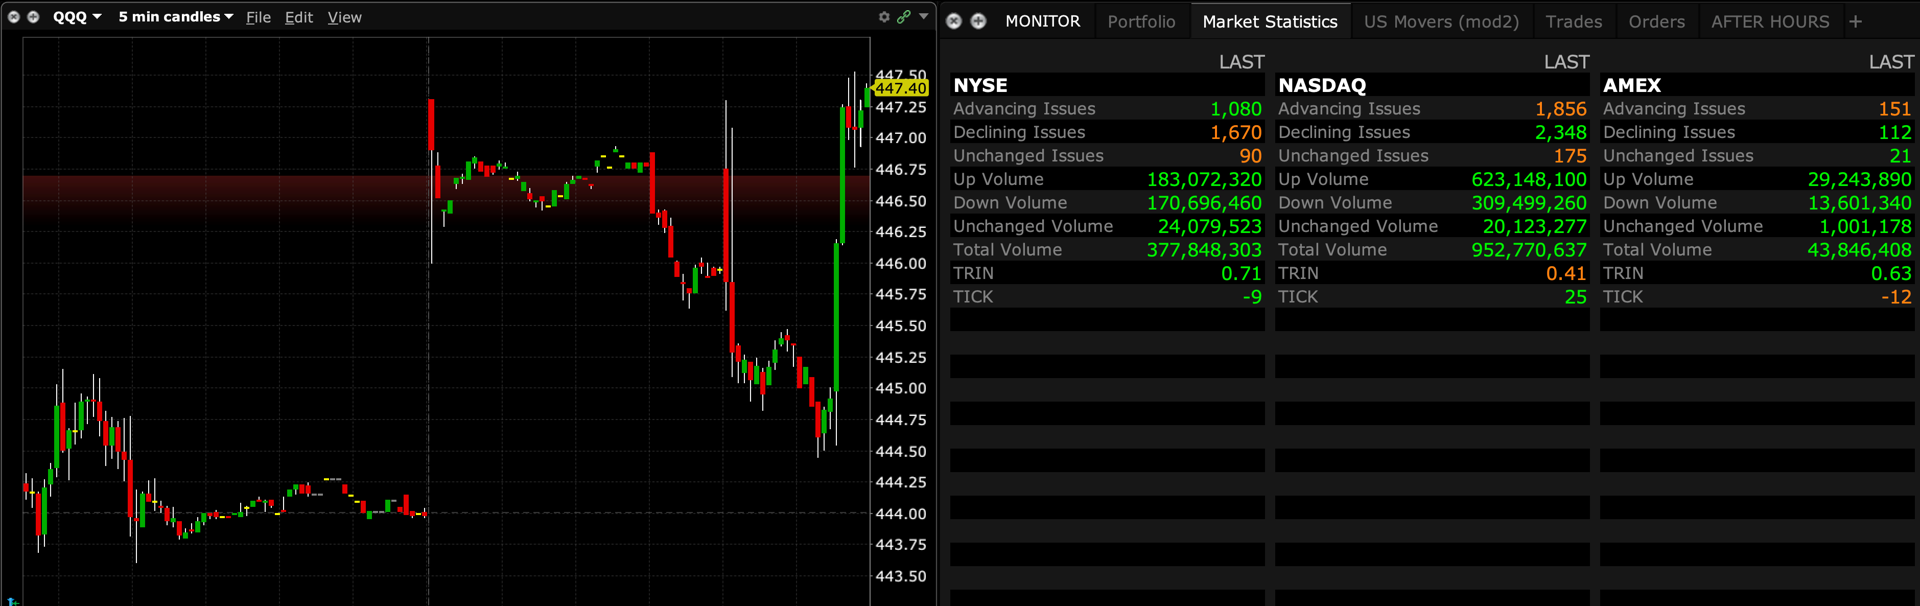
Negative breadth on the Nasdaq (!):
BY Doug Kass · Apr 1, 2024, 10:30 AM EDT
Starbucks added to 'Q2 Tactical Ideas List' at Wells Fargo Wells Fargo analyst Zachary Fadem added Starbucks to the firm's Q2 Tactical Ideas List. The firm says shares are out of favor due to lagging comps and elevated 2024 outlook, but compares are easing, price to earnings is trough and margin/throughput levers remain tailwinds. Wells has an Overweight rating on the shares with a price target of $105.
Starbucks price target lowered to $100 from $102 at TD Cowen TD Cowen lowered the firm's price target on Starbucks to $100 from $102 and keeps a Hold rating on the shares. The firm previewed the quarter and said while it's expected that this will be the 3rd consecutive reduction in 2024 same store sales, they do not view this as a buying opportunity ahead of results.
Citi added to Conviction List at Goldman Sachs Goldman Sachs analysts added Citi to the firm's Conviction List as part of the firm's "US Conviction List - Directors' Cut" for April. The firm keeps a Buy rating on the shares.
Citi added to 'Q2 Tactical Ideas' at Wells Fargo Wells Fargo is adding Citi to its Q2 Tactical Ideas. Citi is at the start of a multi-year inflection that should reflect better efficiency and returns, the firm says, adding that it sees stock at $80 over 12 months and about 2-times over 3 years. Wells has an Overweight rating on the shares with a price target of $80.
Tesla added to 'Tactical Ideas List' as Underweight at Wells Fargo Wells Fargo added Tesla to the firm's Q2 "Tactical Ideas List" and keeps an Underweight rating on the shares with a $125 price target. The firm sees moderating delivery growth driven by lower demand and diminished return on price cuts. It estimates Tesla's auto gross margin excluding credits fall by 130 basis points year-over-year in Q1 given the likelihood of more price cuts and lower volumes. Wells' fiscal 2024 delivery estimate of 1.8M units represents flat year-over-year growth and remains 10% below consensus. It remains concerned with recent flattening trends across all three of Tesla's key regions - the U.S., European Union and China.
Disney price target raised to $145 from $130 at BofA BofA raised the firm's price target on Disney to $145 from $130 and keeps a Buy rating on the shares. The firm expects Q2 to reflect a continuation of the strong underlying momentum reported in Q1, telling investors in a research note that park performance remains robust and that the firm projects operating income to grow in the low to mid teens in Q2. CEO Bob Iger now appears to be in command and control and on a growth offensive, BofA adds.
Airbnb price target raised to $127 from $107 at Wells Fargo Wells Fargo analyst Ken Gawrelski raised the firm's price target on Airbnb to $127 from $107 and keeps an Underweight rating on the shares. The firm says Q1 room nights are likely in line, improving traffic trends suggest that Q2 consensus acceleration for room night growth is achievable.
BY Doug Kass · Apr 1, 2024, 10:15 AM EDT
While most remain preoccupied with the strength in the market's price momentum - I continue to see some developing and disturbing trends.
More specifically, the bullish investor sentiment unanimity -- as Peter Boockvar expressed this morning -- and the continued rise in the price of commodities has been ignored.
Also not discussed in the business media this morning is the continued reversal in bond yields (higher) since the early morning low in yields:
* The yield on the 2 year US note is now +2 bps to 4.63%.
* The yield on the 10 year US note is +8 bps to 4.26%.
* The long bond is +8 bps to 4.412%.
Don't worry... be happy.
But I am continuing to raise my short exposure in the face of a thinning equity risk premium, the continued reacceleration in inflation and the historically high equity market valuations.
High stock prices are the enemy of the rational buyer.
BY Doug Kass · Apr 1, 2024, 10:00 AM EDT
On the dip to unchanged I took back my Index shorts from this morning (for a profit) and on the speedy rally that ensued I expanded my short Index calls.
BY Doug Kass · Apr 1, 2024, 9:54 AM EDT
Upside
-EOSE +13% (Eos Energy and Pine Gate Renewables sign new Master Supply Agreement for 500 MWh of energy storage systems)
-BLDP +6.8% (announces order for 1K engines to power Solaris buses across Europe; announces $54 million of additional Federal funding support)
-NVEI +6.7% (Advent said to be in advanced talks to acquire Nuvei)
-VINC +5.8% (to host Virtual Investor Event Reviewing Preliminary Phase 1 VIP236 Data Presented at the American Association for Cancer Research (AACR) Annual Meeting 2024)
-ZIMV +5.2% (H.I.G. Capital acquires the spine business of ZimVie rebranded as Highridge Medical for $315M cash, $60M promissory note; affirms FY outlook)
-NRBO +4.9% (completes enrollment of part 1 of Phase 2a clinical trial evaluating DA-1241 for treatment of MASH)
-ANVS +4.8% (announces publication supporting understanding of Buntanetap’s Mechanism of Action in humans)
-XOS +4.5% (DA Davidson Raised XOS to Buy from Neutral, price target: $17)
-ADTH +4.4% (Cadent to acquire AdTheorent at $3.21/shr in ~$324M deal)
-VTGN +3.2% (initiates PALISADE-3 Phase 3 study of Fasedienol for Acute Treatment of Social Anxiety Disorder following positive results of PALISADE-2)
-AREC +2.9% (Unit American Carbon Corporation provides updated rare earth analysis from West Virginia Project)
-RYTM+2.2% (secures $150M in convertible preferred stock financing)
-BAX +1.9% (receives US FDA ANDA 4 approval for Cyclophosphamide; US FDA clears Novum IQ Large Volume Infusion Pump and Dose IQ Safety Software)
-NIO +1.9% (reports Mar deliveries)
-XPEV +1.7% (reports Mar deliveries)
Downside
-IRON -56% (Phase 2 AURORA Study missed secondary endpoints)
-BIOR -25% (announces $6M registered direct offering priced at-the-market under Nasdaq rules; selling 5.5M common shares at $1.10/shr)
-GUT -19% (receives FDA IDE approval for Revita Remain-1 Pivotal Study of Weight Maintenance in Obesity after Discontinuation of GLP-1 Based Drugs; reports earnings)
-SRZN -18% (announces up to $192.5M private placement of securities priced at-the-market Under Nasdaq Rules; announces safety, pharmacodynamic and liver function data for SZN-043)
-MMM -14% (reaches settlement with Public Water Suppliers to address PFAS ('forever chemicals') in drinking water receives final court approval)
-IINN -4.6% (announces $1.65M registered direct offering of ordinary shares by Inspira CEO's Mother with Leading Fund Manager)
-NNOX -2.9% (earnings)
-T-2.4% (addresses recent data set released on the Dark Web)
-FDX -2.1% (confirms FedEx Express was unable to reach agreement on mutually beneficial terms to extend the contract with USPS, and negotiations concluded on March 29th, following extensive discussions)
-UHS -1.4% (disclosed jury awarded plaintiff compensatory damages of $60M and punitive damages of $475M)
BY Doug Kass · Apr 1, 2024, 9:25 AM EDT
BY Doug Kass · Apr 1, 2024, 9:18 AM EDT
BY Doug Kass · Apr 1, 2024, 9:13 AM EDT
From Peter:
I'm going to start with stock market sentiment, which I usually do on Thursday's after I see both the Investors Intelligence and AAII surveys, because the weekly Citi Panic/Euphoria index I see via Barron's on Saturday's has entered Euphoria and at .40 is the highest since mid January 2022 (and which spent almost the entire year in the Euphoria category in 2021 so tough to time).
The importance of this survey according to Citi itself is while it is a "gauge of investor sentiment" like others, "It identifies 'Panic' and 'Euphoria' levels which are statistically driven buy and sell signals for the broader market. Historically, a reading below panic supports a better than 95% likelihood that stock prices will be higher one year later, while euphoria levels generate a better than 80% probability of stock prices being lower one year later."
So, as markets are higher most of the time and Citi has statistical metrics that say there is "a better than 80% probability of stock prices being lower one year later" when Euphoria has been realized, we should all take note. As stated though, it was very euphoric all throughout 2021 and markets kept elevating (though the most speculative stuff peaked in February 2021) so no one can be sure of the timing of when this matters but for those of us managing other people's money and in the risk management business, we should take heed. Especially when we combine this with the more than 40 point spread in II between Bulls and Bears which rarely occurs.
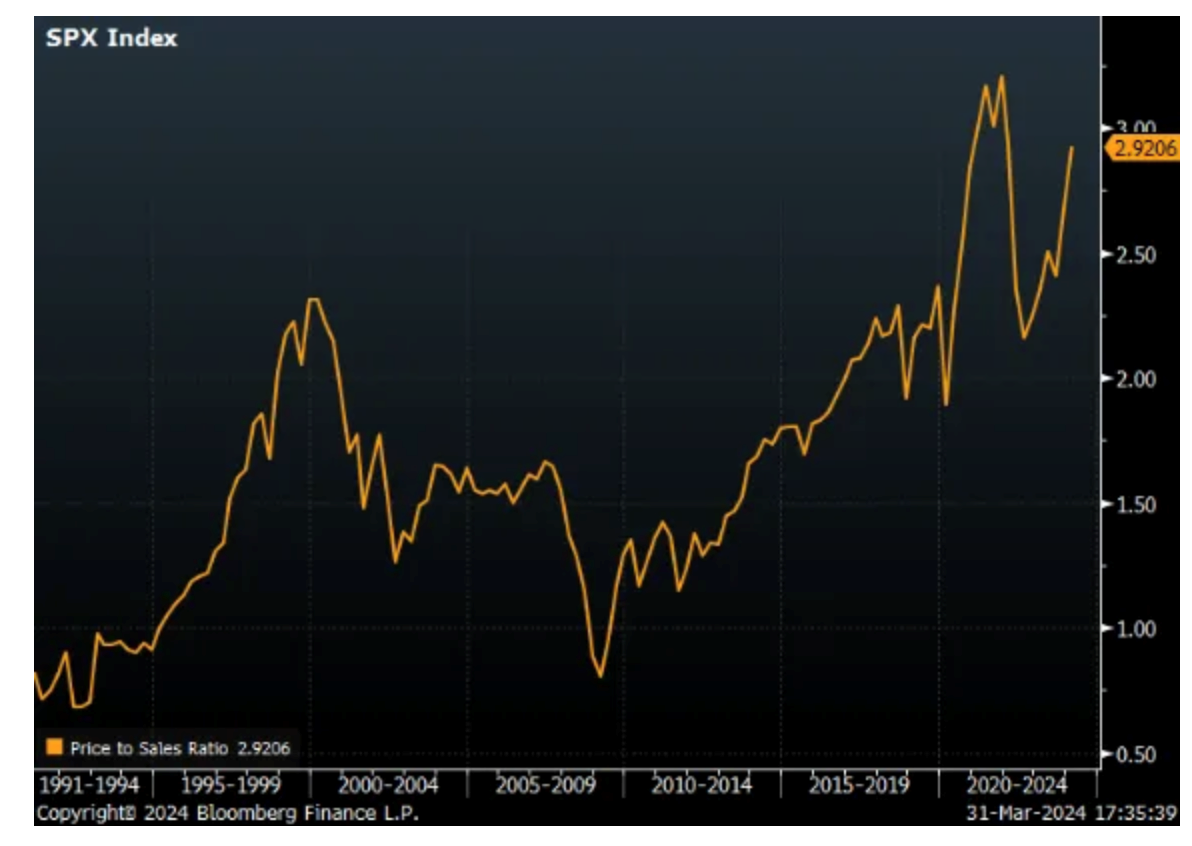
Also, I keep hearing people arguing in both directions that we're seeing year 2000 bubble 2.0 and some saying not even close. At least as measured by the S&P 500 price to sales ratio, it's currently much worse now and more bubblicious though not that it means anything in the short term. It's important to point out that the bubble in the late 1990's that peaked in March 2000 was very narrowly focused as outside of tech, and some other stocks like GE and PG for example, the rest of the market was dirt cheap.
Now, valuation elevation is more broad based as measured by that price to sales ratio I mentioned. I like to use this because it smooths out unsustainable profit margins that some companies sometimes have, like Nvidia which mathematically won't sustain a 77% profit margin for more than a year or two, thus I prefer a P/S ratio, not that I'm picking on Nvidia, just trying to make a point.
As seen, the price to sales ratio is approaching the peak seen in December 2021 which was quite a year of speculation in just about everything with the meme and SPAC stock craze as we all remember with zero rates and epic QE.
I bring up the extreme sentiment and this valuation metric to make NO call on the market right now but to raise antennas that we should all have a swivel head and eyes wide open when it comes to investing right now in terms of timing new investments, more so than usual and make decisions accordingly with a time horizon and risk profile that best fits your situation because there is little room for error right now.
Can this persist? Of course. Will we have a notable shaking of the tree at some point in coming quarters, I believe most likely based on my points.
S&P Price to Sales Ratio
A few weeks ago at his presser, Jay Powell sure sounded like a guy who was all ready to cut rates at the June meeting. Now following comments from voting members Waller and Bostic, he seemed pretty non-committal about speaking on Friday of that June time frame. "We can, and we will be, careful about this decision - because we can be. The economy is strong, we see very strong growth...That means that we don't need to be in a hurry to cut. It means we can wait and become more confident that, in fact, inflation is coming down to 2% on a sustainable basis."
If I had a dollar for every time I've pointed out my opinion of the importance of the word 'sustainable.'
I will use this moment to mention gold again, which yes I remain very long and bullish on. Can any self respecting central banker just completely ignore its move higher and the messaging that just maybe this non interest paying, non cash flowing yellow rock is sending? I don't think they should as for 5000 years gold has been considered money and a currency and thus a sharp move higher is a tell on markets views on price and currency stability, among other factors. I miss Congressman Ron Paul and his questioning of Fed chairs during semi-annual visits.
Here was a clip from July 2011 on whether gold is money. Bernanke clearly was not a watcher of gold and I don't believe many other central bankers are either but they should be.
No one on the European Central Bank is seemingly a watcher of gold as they can't wait to cut interest rates, especially after the lower than expected inflation prints last week from Spain, France and Italy. Rather than wait until inflation gets to around 2%, which is their SOLE mandate, on a SUSTAINABLE basis, Governing Council member Francois Villeroy said Thursday "Risks to inflation are now balanced, but risks to growth are on the downside. The time has come to take out an insurance against this second risk by beginning rate cuts...I repeat my belief that it should happen in the spring, and independently of the calendar of the Federal Reserve."
Yannis Stournaras, a big dove on the committee, said on Saturday that "Personally I think the reduction of interest rates by four times this year, by 25 bps each time, is possible."
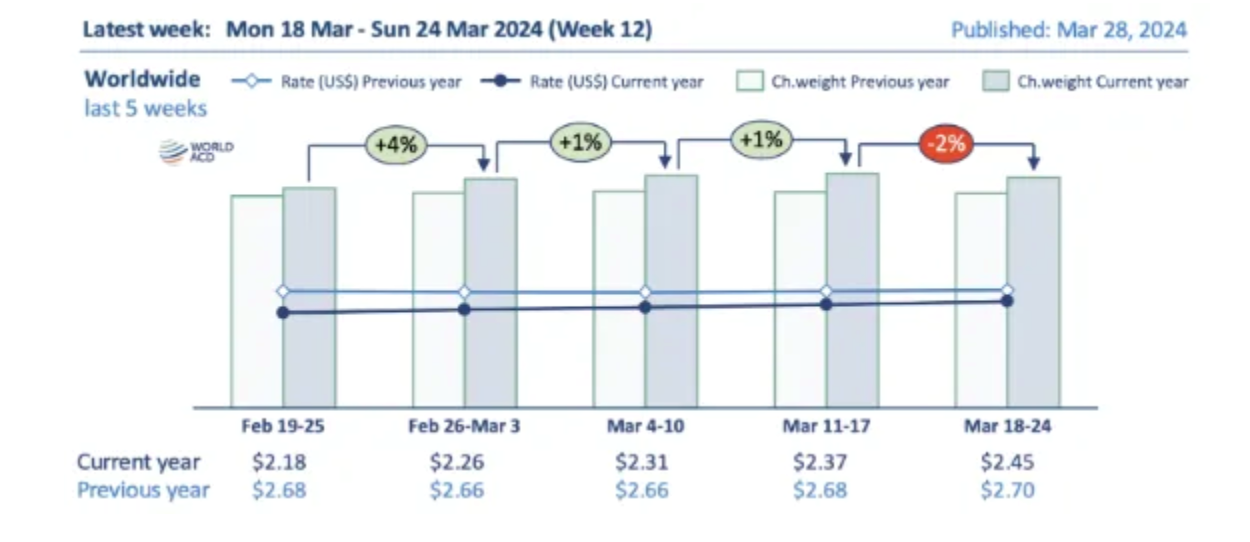
We know freight cargo disruptions are happening in the Red Sea and now we're seeing temporary diversions around the Baltimore port. As a result, more businesses are using air freight to move things and prices are rising in response. On Friday, the World Air Cargo data revealed the 4th straight week of price gains to $2.45 for the average global rate, up 3% w/o/w, though still down y/o/y.
They said "Air cargo rates are rising from most of the main global regions, especially from Asia Pacific and from Middle East and South Asia, strengthened by the ongoing disruptions to container shipping and elevated demand for cross border e-commerce shipments." While prices are down still by about 10%, "they remain significantly above pre Covid levels (+36% compared to March 2019)."
China's economy showed more signs of life in March as measured by the state sector focused PMI. The manufacturing component got back above 50 at 50.9 from 49.1 in February and above the estimate of 50.1. China's manufacturing slowdown was a global phenomenon as we've seen but hopes that inventory destocking is bottoming out is giving some hope. The non-manufacturing sector, which does include construction, saw a bounce to 53 from 51.4 and that was 1.5 pts above the forecast.
The private sector focused Caixin March manufacturing PMI was little changed, though still higher than 50 at 51.1 from 50.9 in February. Caixin said "This was driven by greater inflows of new work, including from abroad. In turn, Chinese manufacturers increased production, while also raising their purchasing levels amid improved optimism. That said, a cautious stance was maintained with regards to staffing levels." Also, input costs fell for the 1st time in 8 months. Of note too, "Overall optimism among Chinese manufacturers improved for a 3rd straight month in March...The level of business confidence was the highest seen since April 2023."
With regards to the Chinese consumer, Macau said March casino revenue rose 53.1% y/o/y which was above the estimate of 49.2%. So, outside of the residential real estate market, China's economy is showing signs of life and in response the Shanghai comp was higher by 1.2% and the H share index rose by 1.4%. We remain bullish on some names on the Hang Seng, also in Macau and believe this stock market has bottomed. Industrial metals are rallying too in response to the data with copper in particular up 1%.
Most manufacturing PMI's though elsewhere in Asia remained below 50 and thus still in contraction but the outlook has improved. South Korea's, 49.8 vs 50.7, Japan 48.2 vs 47.2, Australia 46.8 vs 47.8, Taiwan 49.3 vs 48.6, Vietnam 49.9 vs 50.4, Thailand 49.1 vs 45.3, and Malaysia 48.4 vs 49.5. Indonesia's PMI was above 50 at 54.2 from 52.7 and continues to be an economic bright spot in the region. The Philippines too was above 50 at 50.9 vs 51.
With South Korea in particular, "The 12 month outlook for output strengthened at the end of the first quarter, with the overall degree of positive sentiment solid overall. Manufacturers attributed optimism to hopes of a broad economic recovery, especially domestically, alongside stronger demand in the semiconductor and automotive sectors."
Japan's outlook was upbeat as well, "Business sentiment remained elevated in March and was marked overall. Firms centered hopes on a broad domestic and global demand recovery, which would in turn stimulate sales and new products."
Bottom line, when the inventory restock starts to occur in earnest, Asian manufacturers in particular are going to benefit. And goods price inflation could also reappear. I'll also say big picture, the growing middle class in Asia, including China, India, Indonesia, Vietnam, Thailand, etc... is the most exciting global economic story in the coming 10 years. Asia also happens to have about half the world's population.
In the region we also saw South Korean exports that grew by 3.1% y/o/y, just below the estimate of up 4.2% but semi exports particularly strong, higher by 36% y/o/y.
Back to Japan, the Q1 Tankan manufacturing index was little changed at 11 vs 12 in the quarter before but 1 pt above the estimate and the outlook rose 2 pts. The service sector index and outlook both exceeded expectations. For small business, the manufacturing index and outlook were around zero but services outperformed.
As overall the data was somewhat mixed, the Nikkei was lower by 1.4%, taking a breather, though still up 19% ytd and we remain bullish and long. JGB yields rose a touch and the yen is little changed as we watch to see if words turn into action at some point with regards to intervention.
Finally, and ahead of the US manufacturing data at 10am, this is what MSC Industrial Direct said with its big exposure to the manufacturing and industrial side of the US economy:
"Growth has not yet inflected in our core customer base in the face of a sluggish macro environment, particularly in our heavy manufacturing end markets. This can be evidenced in the performance of our top 100 national accounts where only 45 were growing last quarter. As a result, revenue growth to data has been below our expectations."
"From an end market perspective, we experienced acute demand softness in heavy manufacturing verticals including end markets and tiered suppliers that support the earlier stages of production in automotive."
BY Doug Kass · Apr 1, 2024, 8:42 AM EDT
A thoughtful post:
Douglas Cassel
Second thoughts on LILLY LLY. I remain extremely positive on the benefits of GLP-1 drugs, now with widespread realization of the multiple benefits in addition to weight loss. However, picking winners in this markets has become far more difficult. First, multiple companies have developed or are developing formulations, which does not appear to be as difficult as I anticipated.
Secondly, oral formulations will eventually be the products of choice, as they are more acceptable to patients. Other companies may be ahead in this race. Third, governments and health systems have already realized the long term population benefits, and will lobby for lower cost generic alternatives. Hence, the lavish long term valuation assigned to LLY based upon dominance of this huge potential market may be incorrect.
First mover advantage is real, but I am becoming more doubtful of LLY's ability to maintain their outsized margins for very far in the future. I have cut back on the stock.
_____
Dougie Kass
Adding to your thought process... My guess is that LLY is thinking about using their highly valued stock as currency for possible business combinations.
One candidate to be acquired may be my recent buy in Viking Therapeutics VKTX.
BY Doug Kass · Apr 1, 2024, 8:14 AM EDT
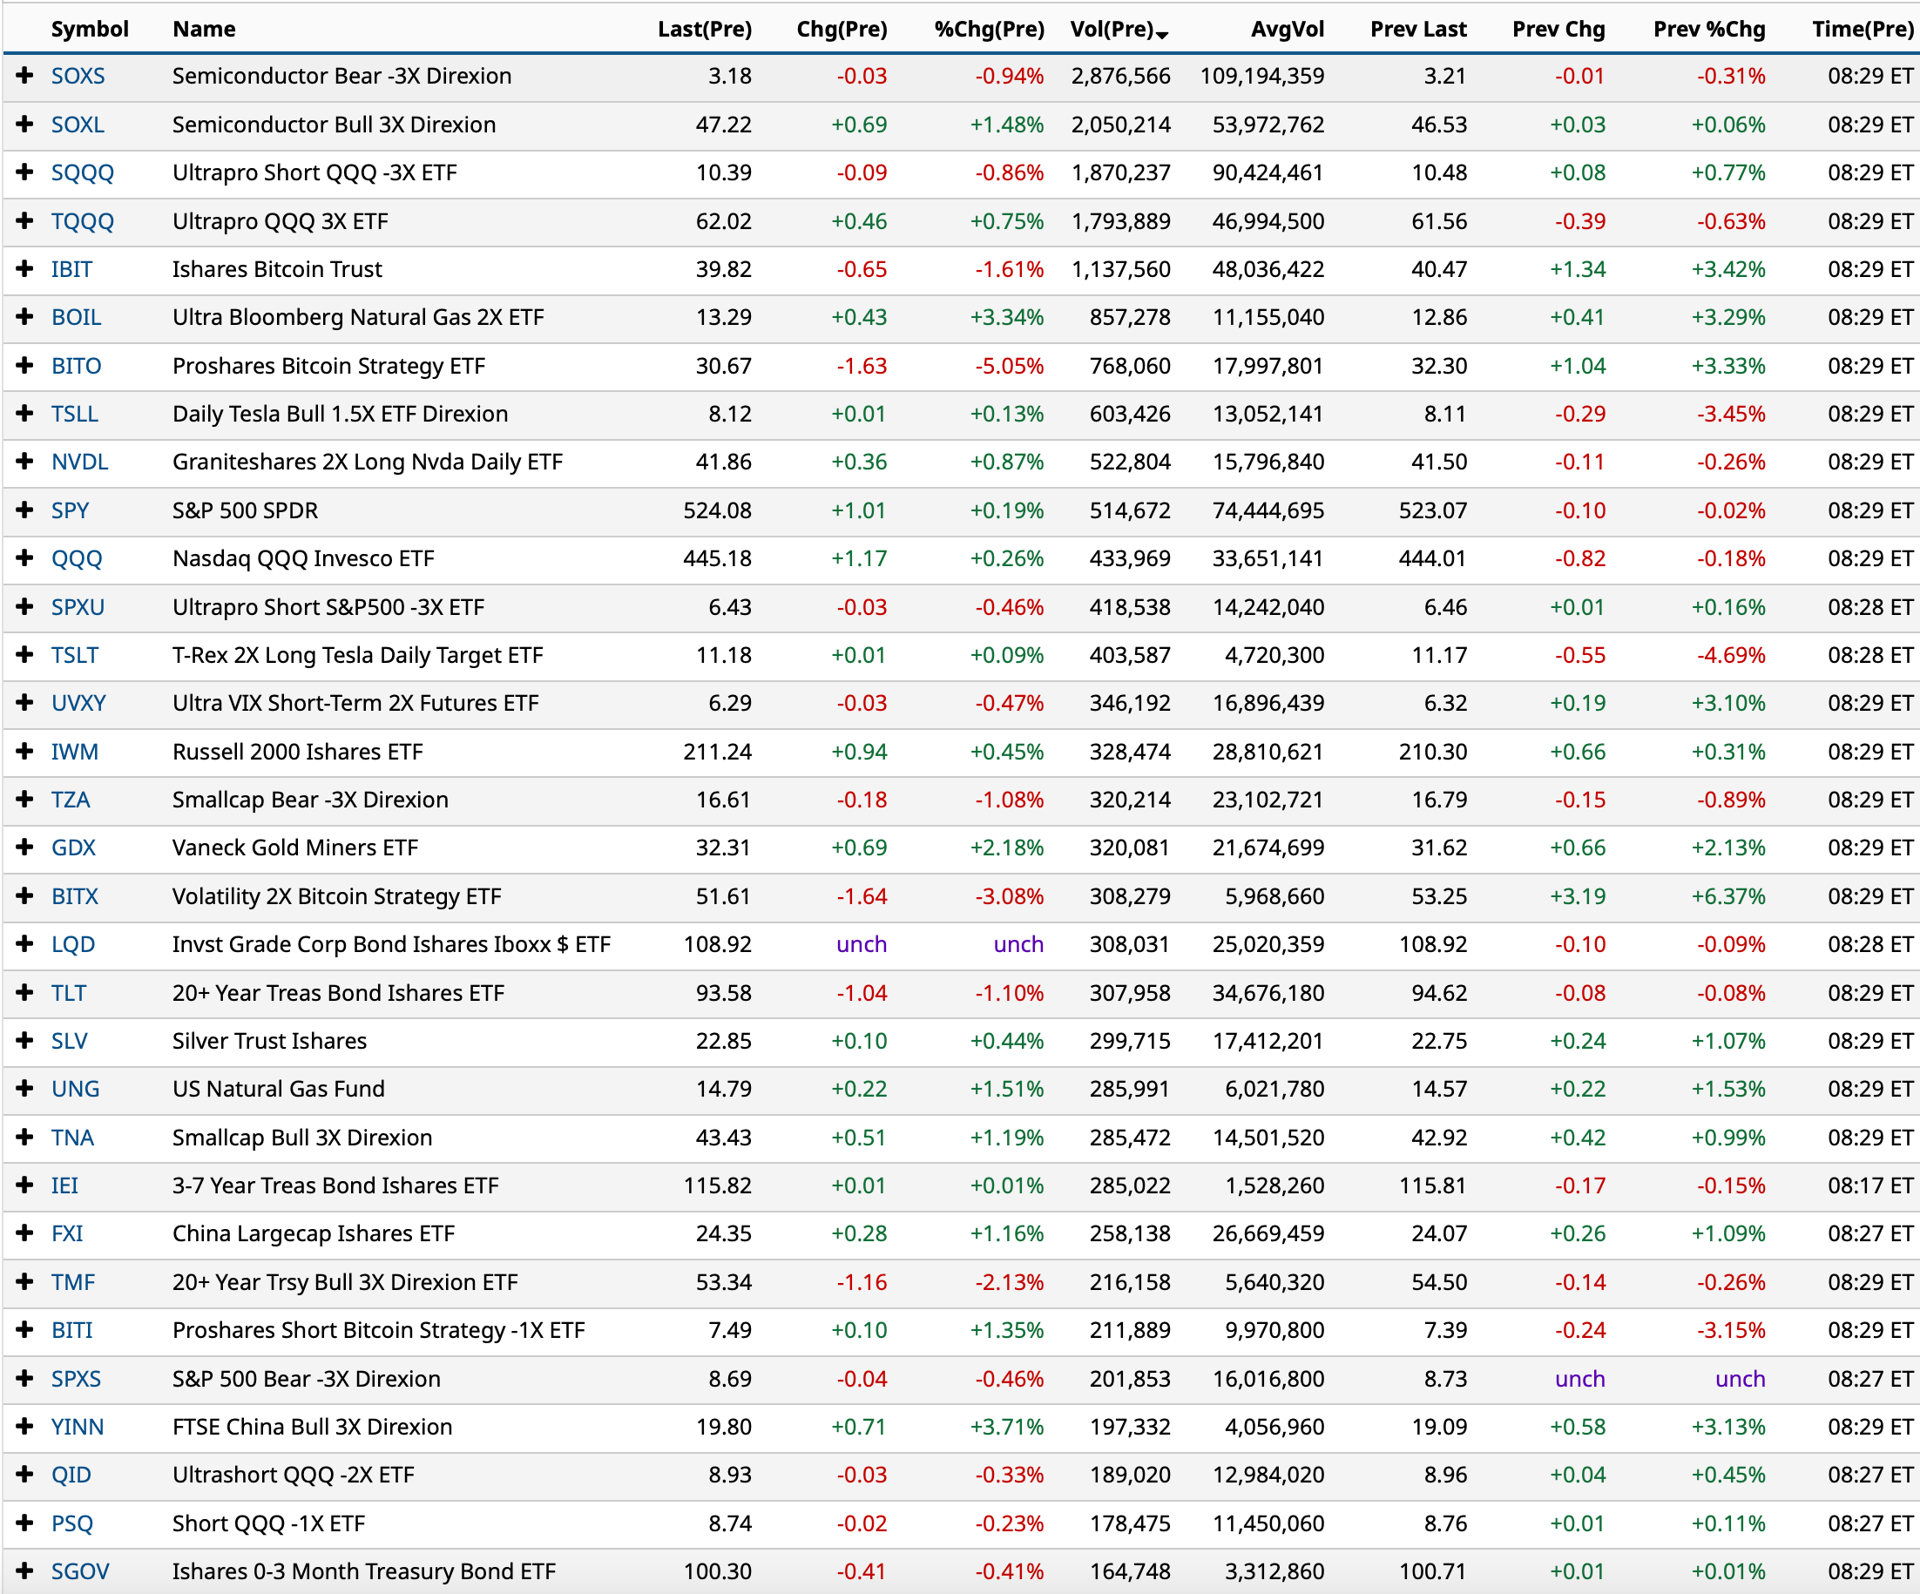
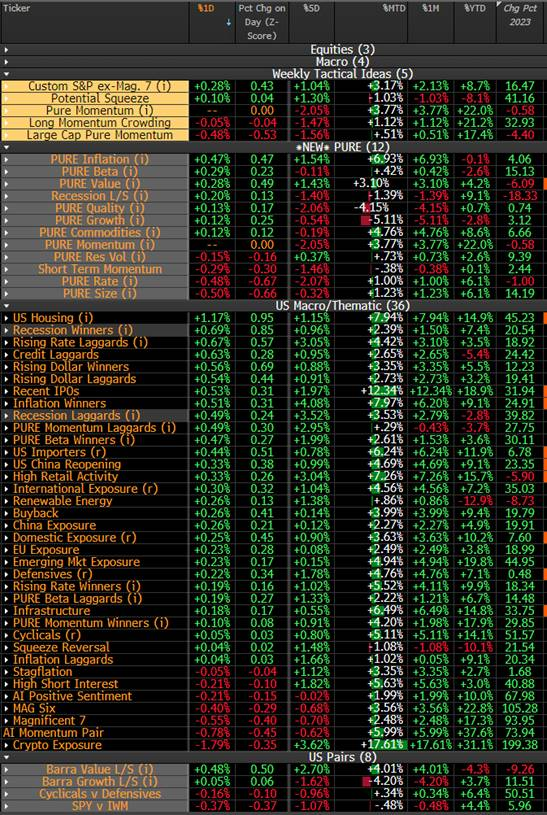
This table is a valuable resource for momentum-driven short term traders:
BY Doug Kass · Apr 1, 2024, 7:50 AM EDT
From JP Morgan:
US: Futs are higher following the long weekend. Pre-mkt, MegaCap Tech names are mostly higher with NVDA/MU/AMD up more than 1%. Bond yields are 1-3bp higher and USD is higher. Commodities are mixed: oil down and metals are mostly higher this morning as China PMIs beat expectations. This week, keep an eye on ISMs, NFP this Friday and Fedspeak (8x this week). Today, we will receive ISM-Mfg at 10am ET. Feroli sees ISM-Mfg to print 48.0 vs. 48.3 survey vs. 47.8 prior.
and...
EQUITY AND MACRO NARRATIVE: The SPX added 39bp last week despite pressures from quarter-end rebalancing and a shortened trading week. Thematically, RTY and High Short Interest (JPTASHTE) outperformed, adding +1.1% and +1.8%, respectively. On the other hand, Momentum (JPMPURE) declined -2.1% last week, the largest WoW decline YTD: we saw the broad underperformance from Mag 7 with META -4.7%, NVDA -4.2%, MSFT -1.9% amid quarter-end rebalance. Overall, the market narrative remains on the growth-without-inflation scenario: Powell’s remarks and PCE on Friday both support the view that the Fed is still on track to cut later this year, despite a patient approach.
Where from here? We remain tactically bullish given the combination of strong economic growth, upside on earnings and Fed’s preference on easing this year. The next key catalysts will be CPI print on April 10 and Q1 earnings (will kick off on April 12). Questions from here is (i) will Q1 earnings still support the bullish stance and (ii) whether a pullback will happen ahead of the earnings season? The balance of the note will try to answer these two questions, along with an update from Econ and Commodities team.
BY Doug Kass · Apr 1, 2024, 7:40 AM EDT
From Peter:
Fear and doubt has left Wall Street.
I'm going to start with stock market sentiment, which I usually do on Thursday's after I see both the Investors Intelligence and AAII surveys, because the weekly Citi Panic/Euphoria index I see via Barron's on Saturday's has entered Euphoria and at .40 is the highest since mid January 2022 (and which spent almost the entire year in the Euphoria category in 2021 so tough to time).
The importance of this survey according to Citi itself is while it is a "gauge of investor sentiment" like others, "It identifies 'Panic' and 'Euphoria' levels which are statistically driven buy and sell signals for the broader market. Historically, a reading below panic supports a better than 95% likelihood that stock prices will be higher one year later, while euphoria levels generate a better than 80% probability of stock prices being lower one year later."
So, as markets are higher most of the time and Citi has statistical metrics that say there is "a better than 80% probability of stock prices being lower one year later" when Euphoria has been realized, we should all take note.
As stated though, it was very euphoric all throughout 2021 and markets kept elevating (though the most speculative stuff peaked in February 2021) so no one can be sure of the timing of when this matters but for those of us managing other people's money and in the risk management business, we should take heed. Especially when we combine this with the more than 40 point spread in II between Bulls and Bears which rarely occurs.
BY Doug Kass · Apr 1, 2024, 7:30 AM EDT
* Shorted more SPY $525.45.
* Shorted more QQQ $447.11.
* Added to NVDA short at $912.44.
* Increased size of DJT short (as I did on Thursday) at $59.85.
* Added to VKTX long at $81.85. I don't think I have mentioned this initial purchase late last week.
BY Doug Kass · Apr 1, 2024, 7:20 AM EDT
* Markets weakened late Thursday but stock futures were stronger overnight
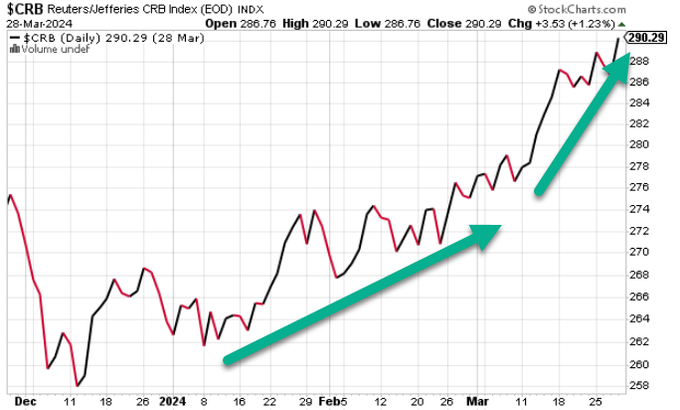
* In the face of a cycle high in commodities:
* A higher gold price (+$35.70) is an overnight feature
* The overbought is intensifying with the S&P Short-Range Oscillator standing at an elevated 4.96% vs. 2.86%
* Bond yields are mixed this morning, crude oil prices are flat and Bitcoin is -$1,500
* The U.S. dollar is higher against the yen
* Today is a big day for cannabis as Florida considers recreational use for the November ballot...
"Talkin' to myself and feelin' old
Sometimes I'd like to quit
Nothin' ever seems to fit
Hangin' around
Nothin' to do but frown
Rainy days and Mondays always get me down"
- The Carpenters, "Rainy Days and Mondays"
"Workin' on our night moves Trying to lose the awkward teenage blues Workin' on our night moves In the summertime And oh the wonder Felt the lightning And we waited on the thunder Waited on the thunder."
- Bob Seger, "Night Moves"
This daily Futures feature is like inside baseball. I try to show you and write about what I believe thoughtful hedge fund managers are looking at when they awake -- let's call it our normal routine -- setting the stage for their strategy for the day. The market is a complicated mosaic and the more info you have, the better trader and investor you will be!
The market (and money) never sleeps -- and neither do I, it appears! I have previously described the importance that overnight futures trading hold for me here. It is a guidepost to my strategy in the regular trading session. Moreover, the overnight/early morning futures hold opportunities as they are (1) inefficient, though liquid and (2) it seems fear and greed are often exaggerated outside the regular trading session. I frequently try to capture those efficiencies by trading actively both in the pre- and after-market sessions.
Here are brief observations I wanted to highlight and provide a summary of overnight price movements in various asset classes:
* Stock futures were higher overnight. S&P futures peaked at +25 and bottomed at +5. Nasdaq futures peaked at +130 and bottomed at +22. At 5:46 a.m. ET, S&P futures were +18 and Nasdaq futures were +90.
* Commodities are mixed with Brent crude down by only eight cents to $86.91. Precious metals are ripping higher:
* The S&P Short-Range Oscillator is increasingly overbought at 4.96% vs. 2.86%
* The VIX is at 13.60 (+0.59).
* The U.S. dollar is stronger against the yen, pound and euro.
* Treasury yields are mixed. The 2-Year Treasury yield is -2 basis points to 4.599% and the 10-Year is +1 basis point to 4.20%. Over there, the yield on the 10-Year U.K. Gilt bond is -11 basis points.
* Overnight, the inversion of the 2s/10s Treasuries curve is at -39 basis points. Real rates remain quite elevated; the 10-year is still about 1.85, again in real terms.
* Gold is ripping higher (+$32.30) and sits at $2,271.
* Bitcoin is -$1,500 to $69.5k.
Here is a synopsis of some of my columns I believe were important, or in the event you were out for the day and/or did not read my Diary. The principal intent is to review the logic of my market moves and other factors:
From last Thursday:
Let's See… (rotation out of equities into bonds)
There were no trades last Friday because the market was closed for the Good Friday holiday.
BY Doug Kass · Apr 1, 2024, 7:01 AM EDT
With stock futures ripping higher (again!), we are likely moving into a greater overbought.
At the close of trading on Thursday -- Friday was Good Friday -- the S&P Short Range Oscillator hit 4.96% vs. 2.86%.
BY Doug Kass · Apr 1, 2024, 6:50 AM EDT
Good stuff from Zervos at Jefferies:
Is the sustained QE the key to a higher r-star?
Before tackling today's topic, I want to respond to the many readers who reached out after a technical glitch in our new publishing system accidently sent two old notes from 2020 to my entire distribution list last Friday. I was worried that this would annoy folks who value my minimalist approach to writing.
But instead, to my surprise, I was flooded with positive comments about the trips down memory lane. As such, I have decided to continue with some occasional look backs to the past. Starting at the end of April, and continuing monthly, I will send out one old commentary "from the vault". With 15 years of writing to choose from, I'm sure I can find a few more blasts from the past to provide a bit of non-burdensome lighter entertainment.
Anyway, enough about the years gone by, let's jump right back into 2024 and the topic at hand. Last week saw one of the most unusual central bank policy announcements in history. In fact, I do not believe there is any historical precedent for what occurred on March 19 in Tokyo. First, the BoJ announced a modest rate hike of 20bps back into positive territory. That of course was not surprising. The BoJ further announced a complete end to both YCC and the credit easing portion of their QE policies (aka QQE).
Again, not surprising, although some may have thought they wouldn't fully abandon YCC in favor of just a further widening of the band. But here is the most fascinating part of the announcement: The ~$40b of monthly traditional QE, those outright large-scale asset purchases in the JGB market, were left completely unchanged. They are now tightening on the conventional rate dial but continuing to conduct full-throttle easing on the balance sheet dial. On the one hand they giveth, and on the other they taketh away!!
So here we sit, for what I believe is the first time in history, watching a central bank engage in unconventional QE policies designed to add accommodation via the long end of yield curve, while at the same time using conventional rate policies to remove accommodation through the short end of the curve.
Now to be sure, central banks have used funding facilities like the BTFP in the US and the TPI in Europe to target soft spots in financial markets during rate-hike cycles. And those funding facilities did create modest but temporary balance sheet expansions. However, those all occurred during a broader policy of QT. Engaging in straight-up QE, while raising rates, is something completely different. It's a highly incongruous policy mix I believe we have never seen before.
To that point, every major central bank stopped their QE policies BEFORE rate liftoff from ZIRP/NIRP. QE was always touted as an alternative to rate cuts – something only to be brought out once the conventional rate ammo ran out. QE was the unconventional bazooka reserved for the most unusual of times. And prior to moving rates back onto a path of normalization, QE always ceased first. Even back in 2006, the BoJ ended its 5-year-long experiment with QE in March before lifting rates in July.
So what gives? Is there a new era dawning where central bank balance sheets continue to expand and ease the stance of monetary policy while rates operate to tighten? Or is this just some twisted iteration of "purposeful obfuscation"? Remember, Japan has been a longtime leader in the use of unconventional monetary policies. Should we begin to handicap such bizarre actions down the road for the Fed and ECB?
Well, I do think the Japanese may be onto something big here. Perhaps Ueda sees a bigger balance sheet as the key to bringing rates into more "normal" territory. After all, there are two dials for monetary policy in the post-2008 QE era – rates and balance sheet. So, if one runs a highly accommodative balance sheet, it allows rates to head into more restrictive territory, all else equal. In other words, and this is critical, a bigger balance opens up the ability to persistently move away from those pesky zero/negative rates (cue the lightbulb)!!
Now, imagine for a moment that you are a central banker looking to set an overall neutral stance of monetary policy with a menu of potential choices from your crack staffers. Option one is a balance sheet 20% larger than the neutral level with rates 100bps higher than neutral. Option two is a balance sheet 20% smaller than the neutral level with rates 100bps lower than neutral. And option three is a neutral balance sheet with a neutral rate structure.
They all get you to neutral, but each have a different policy mixology!! Here, I settled on a rate-to-balance sheet trade-off of 100bps for every 20% of sheet. Maybe it's more, maybe it's less, who knows? But there is surely some numerical trade-off. In the case of the US, a 20% move in the balance sheet would be about $1.5t, so I'm postulating that $1.5t in QE is worth about 100bps in rate cuts (and by symmetry $1.5t in QT is worth 100bps in rate hikes). Seems reasonable, however we could debate shading the numbers either way.
But the key issue here is not the exact numerical tradeoff. Rather, it's that persistently running a larger equilibrium balance sheet creates a mechanism to drive equilibrium rates higher!! In essence, it forces a more restrictive neutral rate. As such, if one of the longer-run goals for policy is to figure out ways to stay away from ZIRP/NIRP, then the balance sheet potentially unlocks a golden ticket (via option one).
And to be sure, every central bank - along with the commercial banks, the pension funds, and the insurance companies - desperately wants to stay away from the effective lower bound. The only folks pushing for a return to ZIRP/NIRP again are the PE and the real estate guys. And I suspect they will lose this battle. So maybe, just maybe, that's why Jay decided to pre-announce a taper of QT "fairly soon" last week. This was a surprisingly dovish u-turn given that only a couple meetings ago he was talking about sticking with QT even while cutting rates. Perhaps the big balance sheet/higher r-star lightbulb didn't just go off in Tokyo, it went off in DC too!! Could Frankfurt be next? Stay tuned. Good luck trading.
BY Doug Kass · Apr 1, 2024, 6:40 AM EDT
BY Doug Kass · Apr 1, 2024, 6:30 AM EDT
Wolf Street howls about inflation.
BY Doug Kass · Apr 1, 2024, 6:20 AM EDT
BY Doug Kass · Apr 1, 2024, 6:10 AM EDT
When animal spirits take over and FOMO dominates the investing landscape, concerns are swept under the rug - until they aren't:
BY Doug Kass · Apr 1, 2024, 6:00 AM EDT