You'll Have a Hard Time Pushing Tesla Uphill
After mixed earnings report, the technical picture for TSLA looks a bit drained.
You've reached your free article limit
You've read 0 of 1 free Pro articles.
In my July 11 look at Tesla TSLA I wrote that "Not everyone believes in technical analysis, so Thursday's downside reversal may not get 'traction' in the financial press. The media likes to have a story behind the price moves. Traders just want to make money and don't care all that much about the story."
Fast forward to today and shares of TSLA are trading down around $227 in the pre-market Wednesday as investors react to the electric vehicle company's mixed second-quarter results with a profit margin decline and forecasts of slower growth in 2024.
Back to the charts.
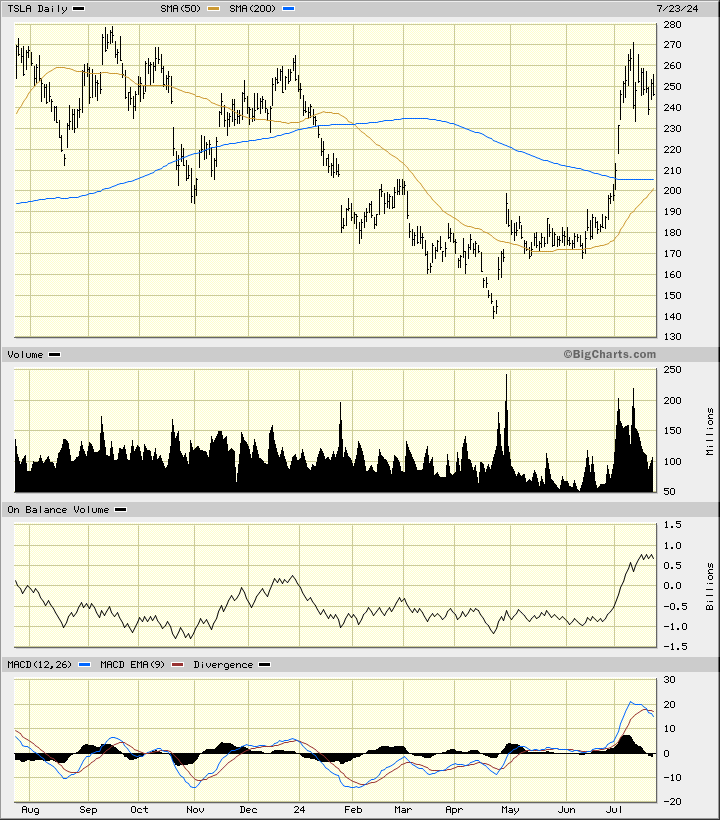
In this daily bar chart of TSLA, below, I can imagine that prices are trading around $227. If this low continues in the regular session it will be a new low for the move down.
Most of the buyers in July will have a loss on their hands and likely become anxious sellers. Prices are still above the rising 50-day moving average line and above the bottoming 200-day moving average line but these are lagging indicators. The trading volume was very active in late June and into July, but has fallen off in the second half of the month.
The On-Balance-Volume (OBV) line soared in June and early July and has stalled in recent days. The Moving Average Convergence Divergence (MACD) oscillator has crossed to the downside for a take-profit, sell signal.
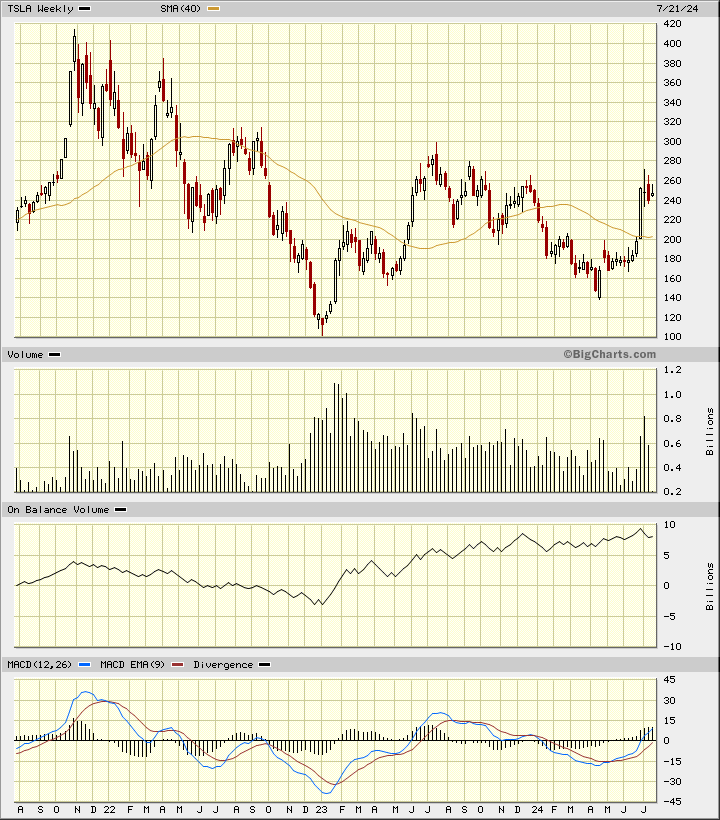
In this weekly Japanese candlestick chart of TSLA, below, the three most recent candles represent a top reversal pattern. The slope of the 40-week moving average line has not turned upwards. The OBV line shows the start of weakness in July and the MACD oscillator has begun to narrow.
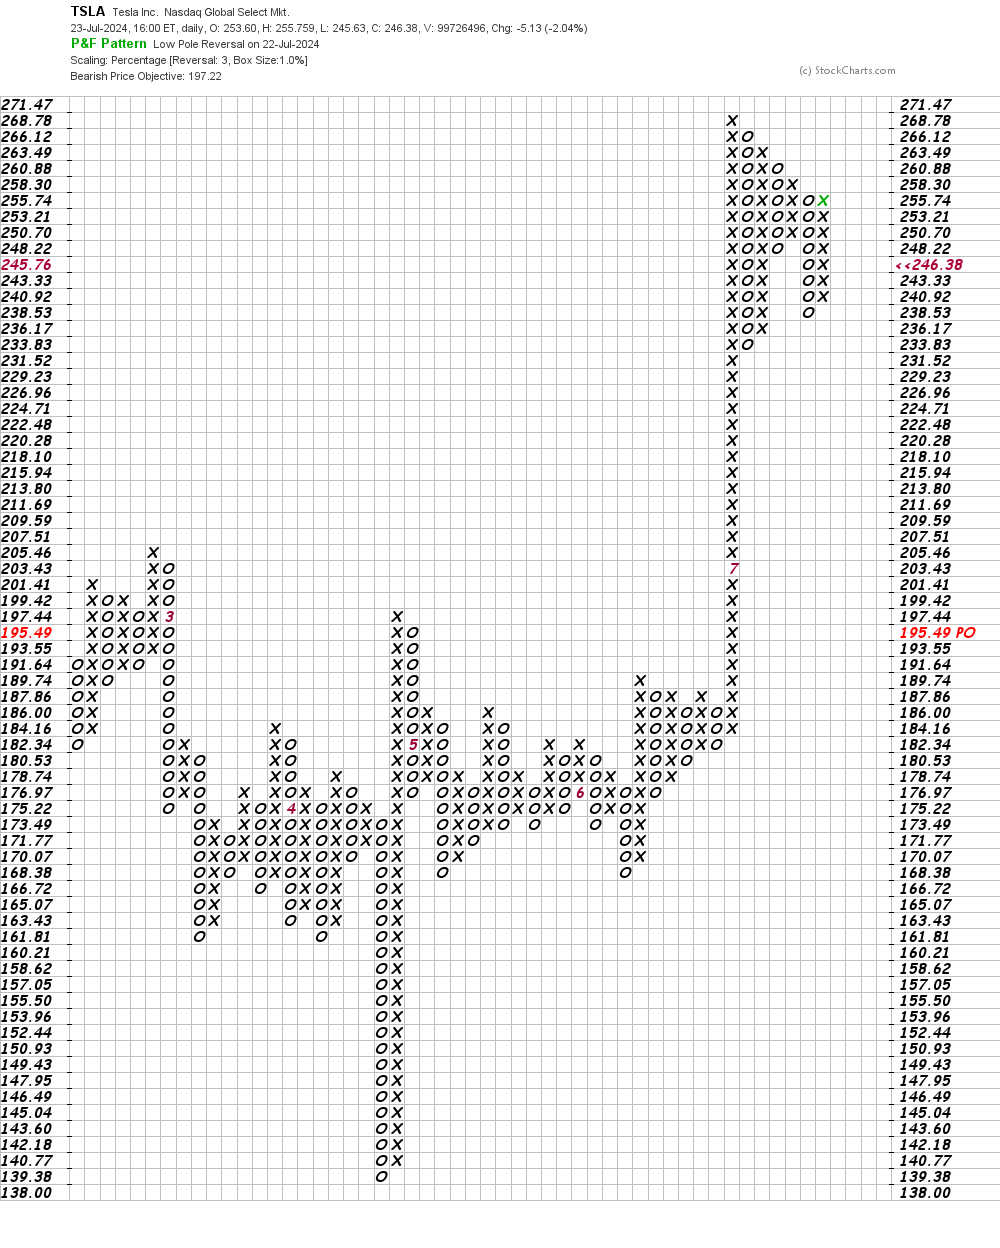
In this daily Point and Figure chart of TSLA, below, I can see a potential downside price target in the $197 area.
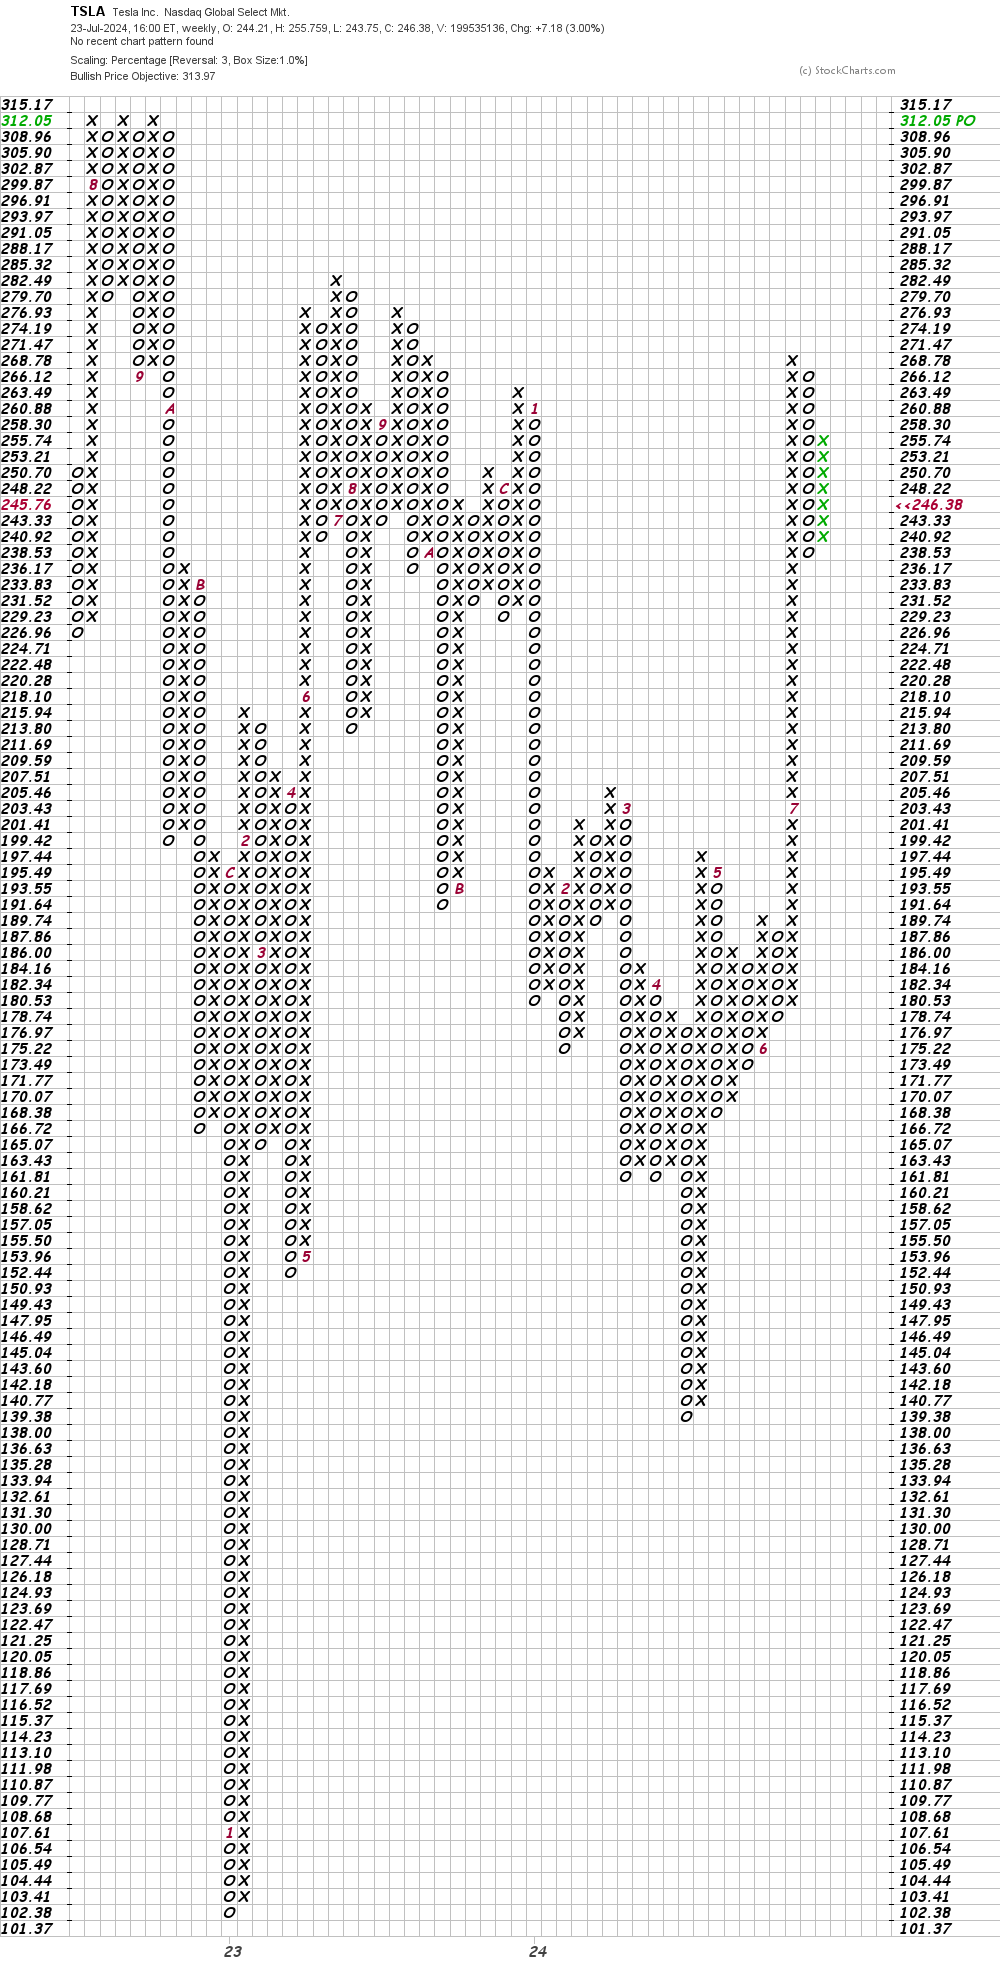
In this weekly Point and Figure chart of TSLA, below, I can see an upside price target in the $314 area but a trade at $236 will start to weaken this chart picture.
Bottom line strategy: The longer-term trend in TSLA (see the weekly candle chart above) is still down and this time weakness in the broad market averages could exert additional downside pressure on the stock price. Don't fight the trend.
Employees of TheStreet are prohibited from trading individual securities.