Tesla Makes a Key Reversal but Does Elon Musk Even Care?
Investors take note, this is a pattern that leveraged futures traders do not ignore.
You've reached your free article limit
You've read 0 of 1 free Pro articles.
Tesla TSLA is one of the most closely followed companies and one of the most closely followed stocks. I don't know about robotaxis and Cybertrucks so let's drill down on some short-term charts to get a look at what technically oriented traders look at.
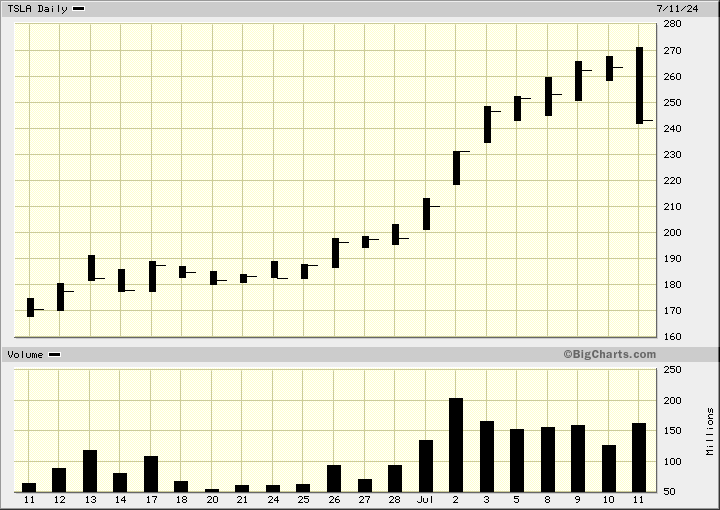
In the daily bar chart of TSLA, below, I looked at just the past month of activity. Prices made a new high for the move up Thursday morning and have turned sharply lower.
TSLA has broken below the lows of the past four trading days. This is what a "key reversal" looks like and is a pattern that leveraged futures traders do not ignore. Anyone who bought TSLA in the last four days is now "under water" with a mark-to-market loss.
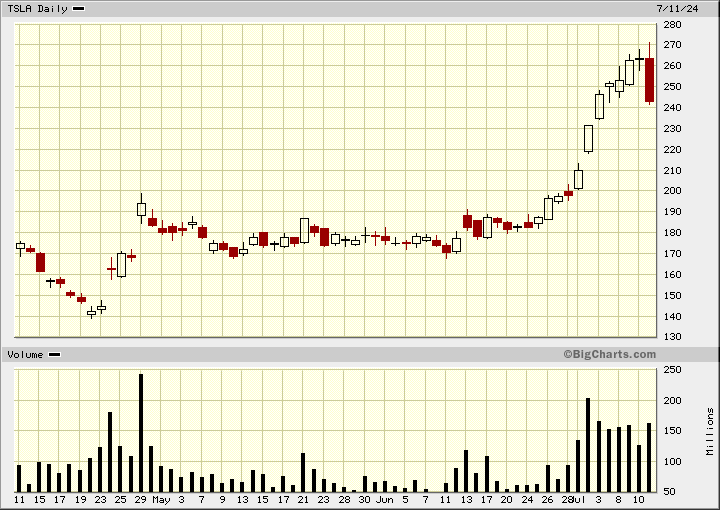
In this second chart of TSLA, below, I used Japanese candlesticks and this chart shows me a pattern called eight to ten record highs before the doji of Wednesday and the large bearish (red) candle of today.
Prices got extended on the upside with a long series of bullish (white) candles and that makes things vulnerable to a reversal.
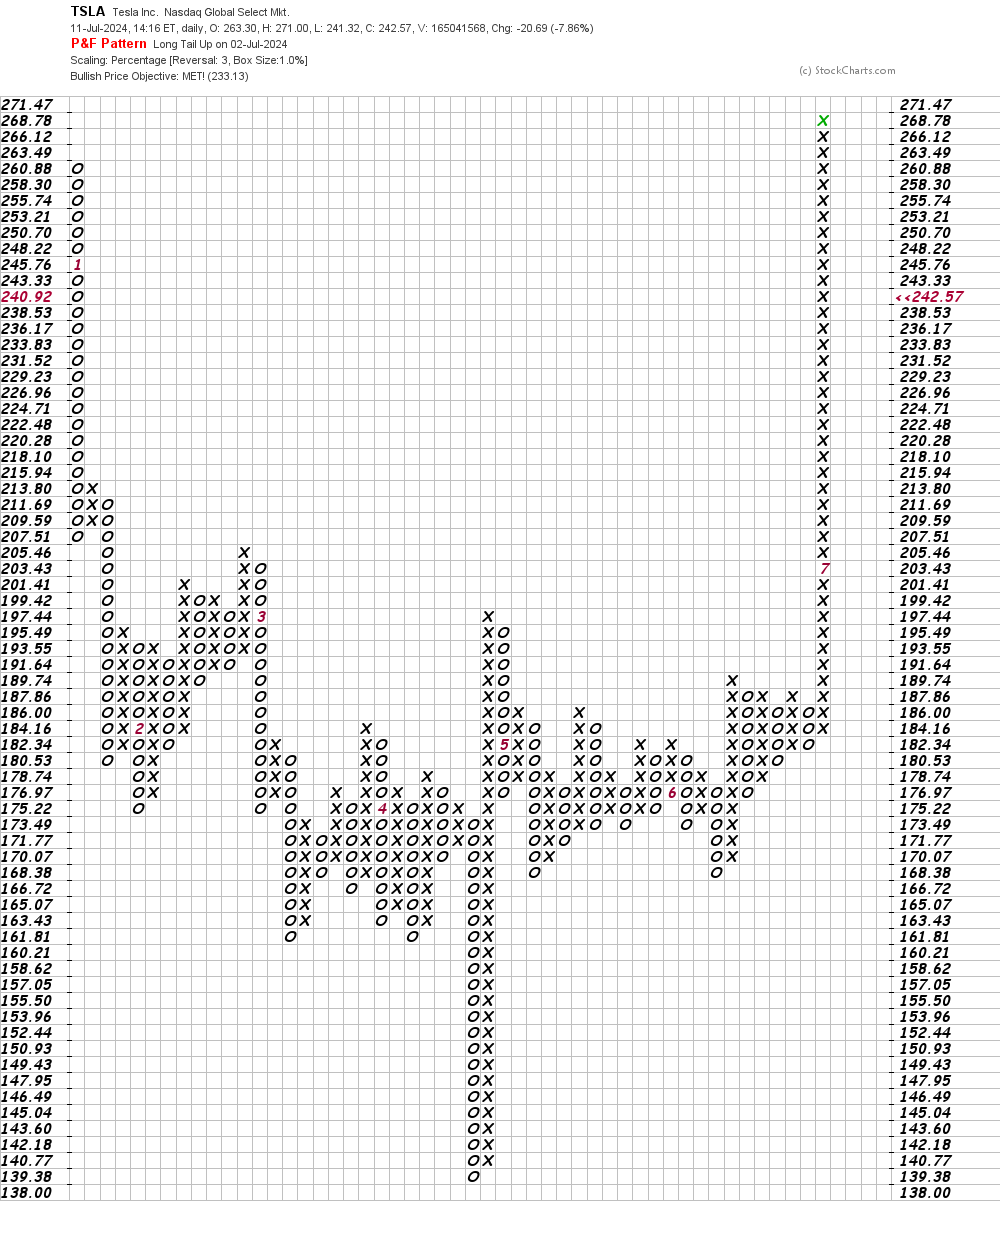
In this daily Point and Figure chart of TSLA, below, I used percentage changes to plot the X's and O's. This shows that prices reached and exceeded a target in the $233 area.
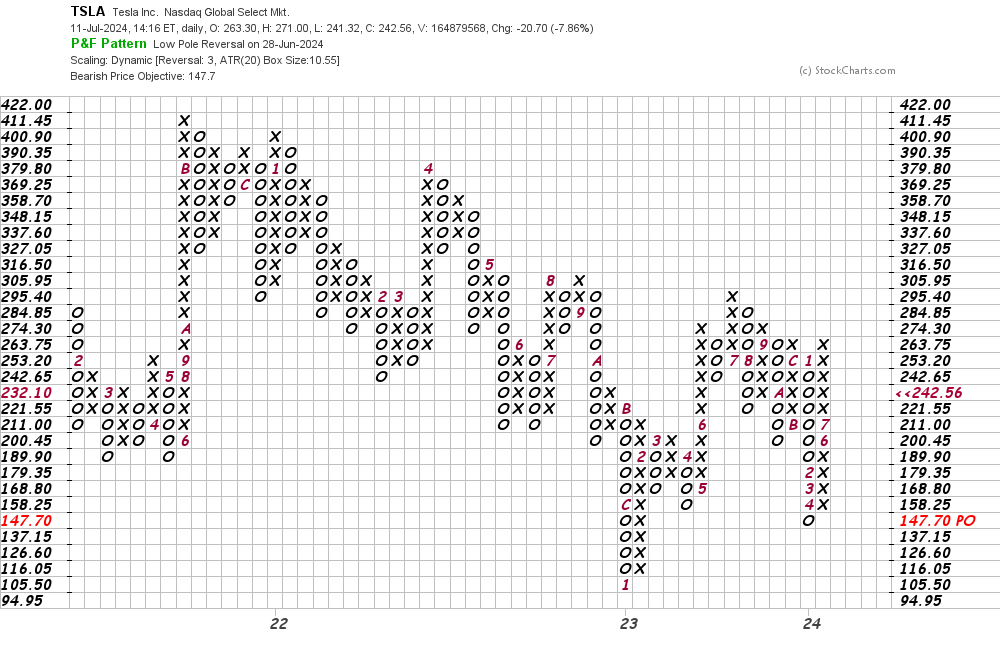
In this second Point and Figure chart of TSLA, below, I used the average true range (ATR) to plot the moves. Here it points to a price target in the $148 area.
Bottom-line strategy: Not everyone believes in technical analysis so Thursday's downside reversal may not get "traction" in the financial press. The media likes to have a story behind the price moves. Traders just want to make money and don't care all that much about the story.
What do you think?
Employees of TheStreet are prohibited from trading individual securities.