With AMD in China's Sights, Let's Review Their Charts
Who knows what China will do next?
You've reached your free article limit
You've read 0 of 1 free Pro articles.
Traders are reacting to news that China said they are going to block the use of Intel INTC and Advanced Micro Devices AMD chips in government PCs and servers, according to the Financial Times.
Let's check out the charts of AMD.
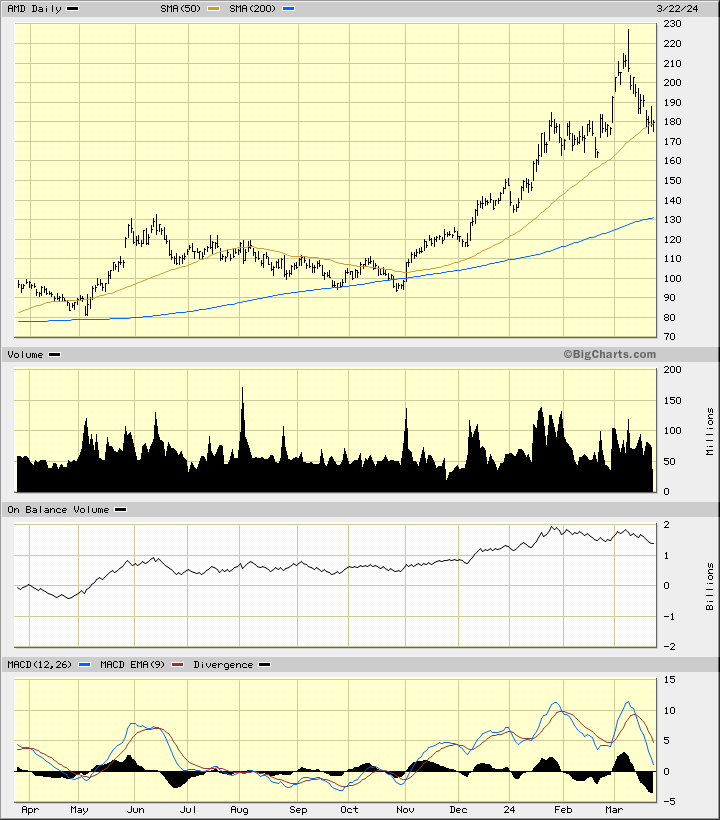
In this daily bar chart of AMD, below, I can see that prices made a key reversal day in early March and has since corrected lower. Prices are breaking below the rising 50-day moving average line. The 200-day moving average line is pointed upwards and intersects down around $130.
The On-Balance-Volume (OBV) line shows weakness from late January. The Moving Average Convergence Divergence (MACD) oscillator is weakening and is headed down towards the zero line.
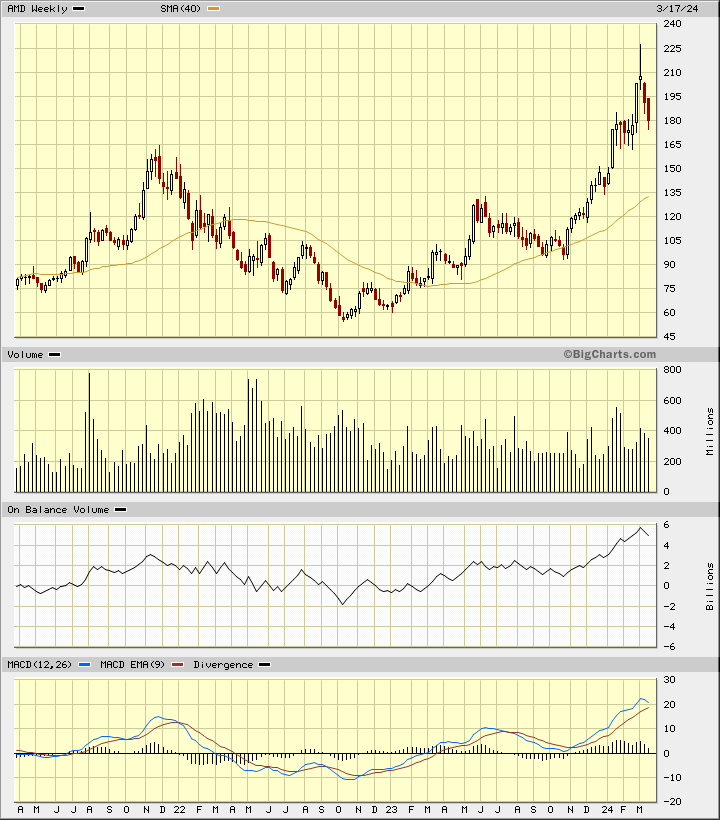
In this weekly Japanese candlestick chart of AMD, below, I can see a dramatic looking top reversal pattern in early March. Traders rejected the highs and prices closed weak. Prices are still above the rising 40-week moving average line but this is a lagging indicator.
The weekly OBV line shows us the early start of a decline. The MACD oscillator has narrowed in recent weeks and is close to a downside crossover and take profit sell signal.
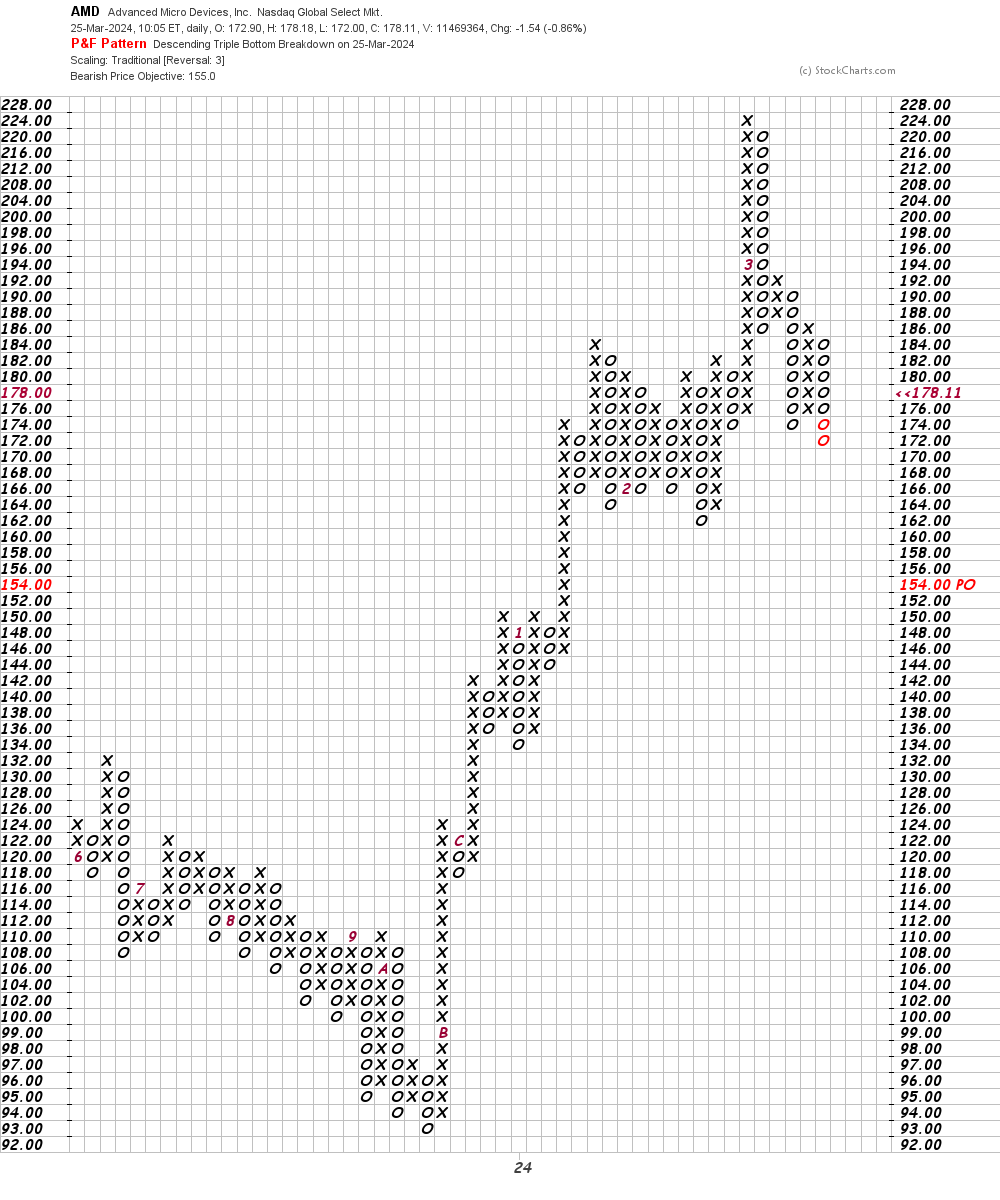
In this daily Point and Figure chart of AMD, below, I can see a potential downside price target in the $155 area.
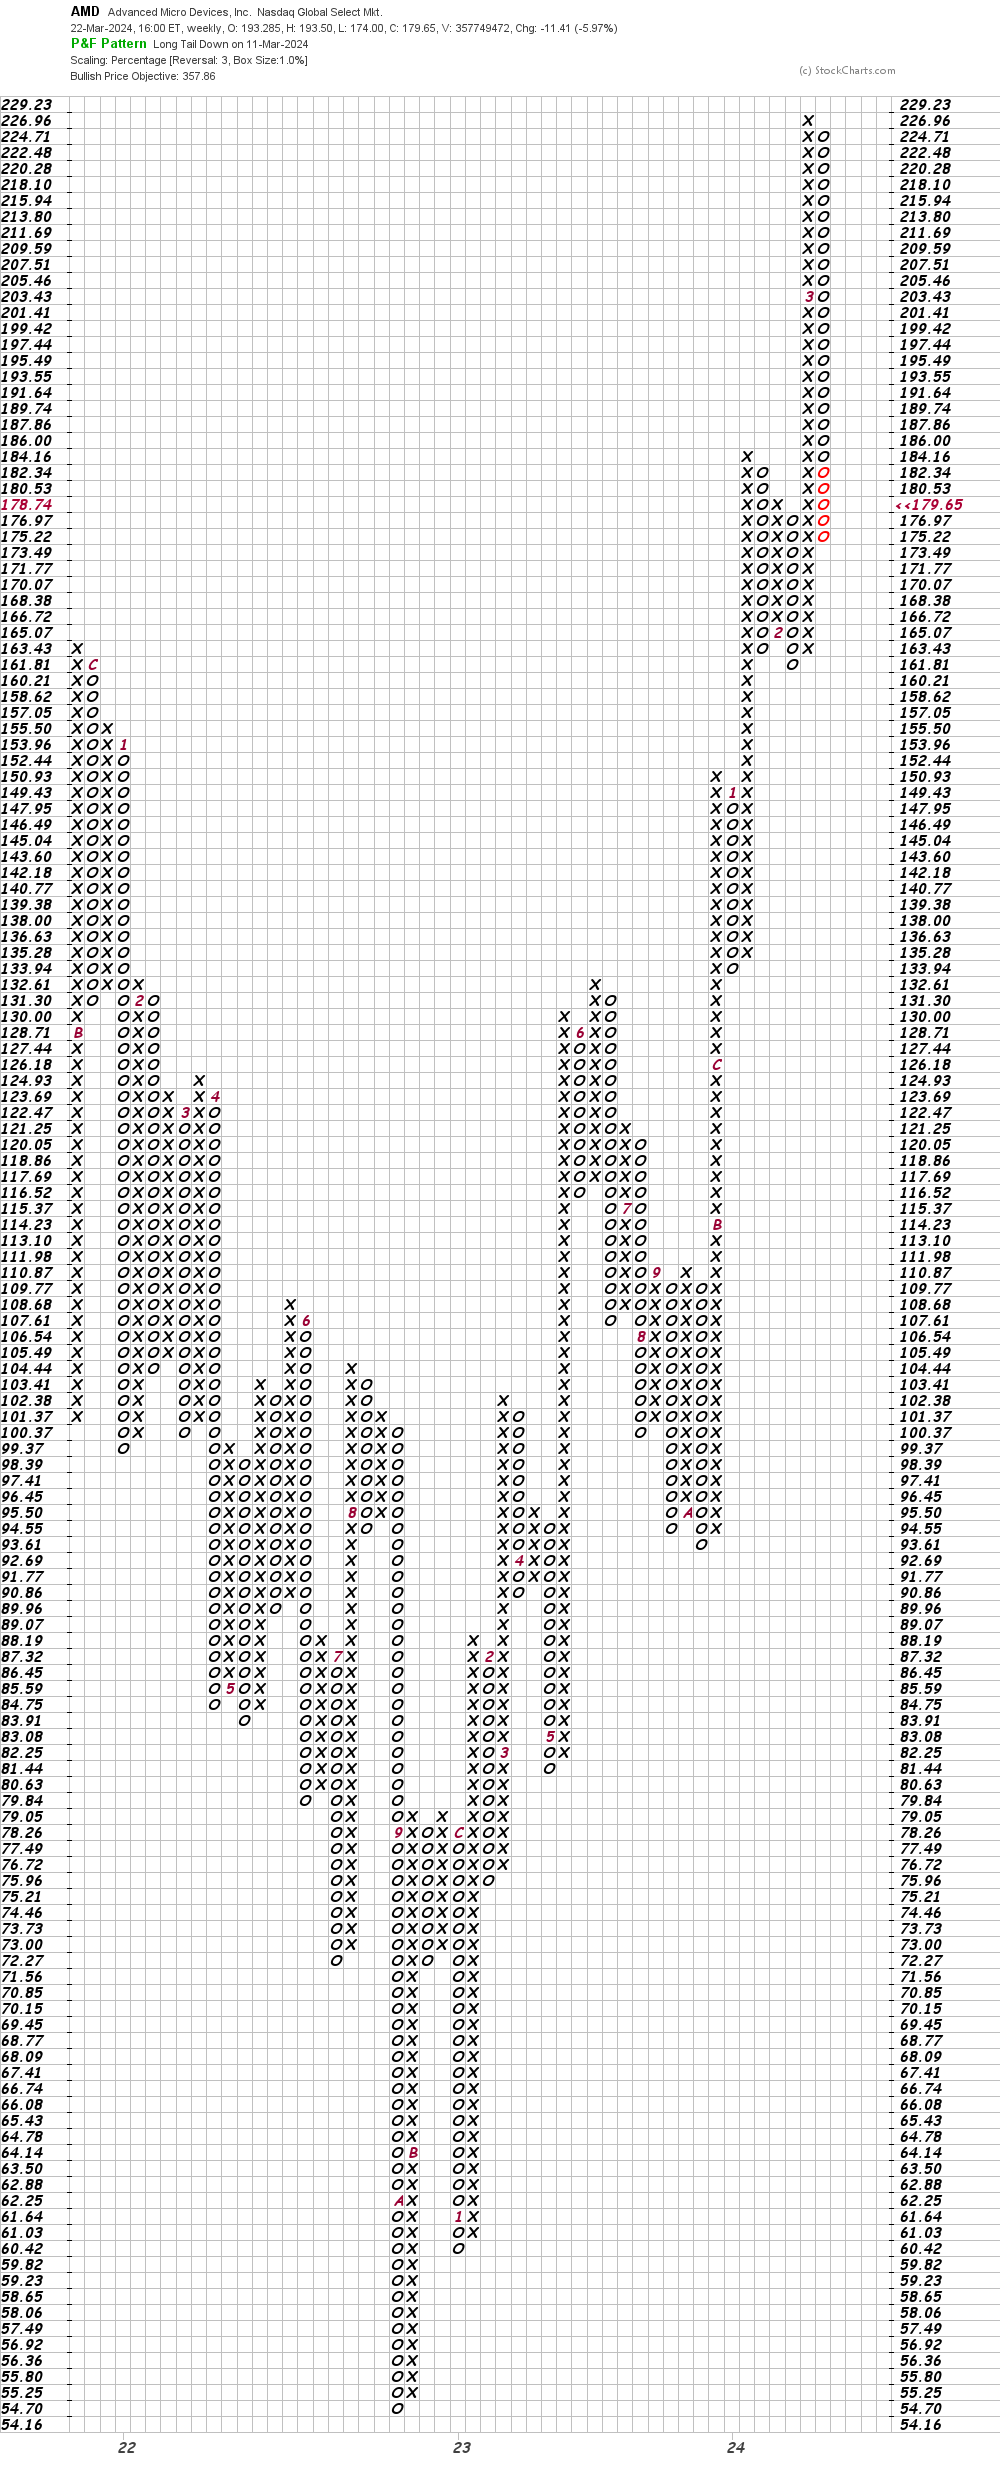
In this weekly Point and Figure chart of AMD, below, I can see an upside price target in the $358 area. Impressive but this could change with the price action.
Bottom line strategy: The charts of AMD are weakening and I would not venture what China may do next in our "tit for tat" technology "spat".
Employees of TheStreet are prohibited from trading individual securities.