With Airbnb, Don't Overstay Your Welcome
As the stock begins another leg down, here's how traders can play it.
You've reached your free article limit
You've read 0 of 1 free Pro articles.
Shares of the short-term housing rental company Airbnb ABNB have weakened since March and are now starting another leg lower.
Let's check out the charts and indicators (and the reviews).
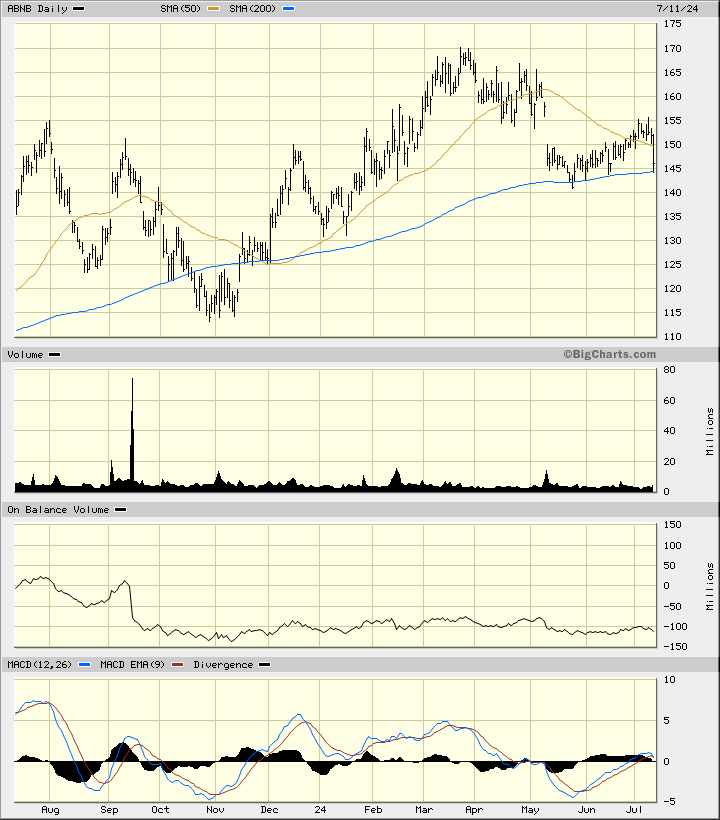
In the daily bar chart of ABNB, below, I can see that the shares bounced off the rising 200-day moving average line in May and June. Prices are now in a position to test the 200-day line again but the risk of a break of this indicator is greater.
The declining On-Balance-Volume (OBV) line suggests that sellers of ABNB are being more aggressive than buyers. The trend-following Moving Average Convergence Divergence (MACD) oscillator is close to moving below the zero line again.
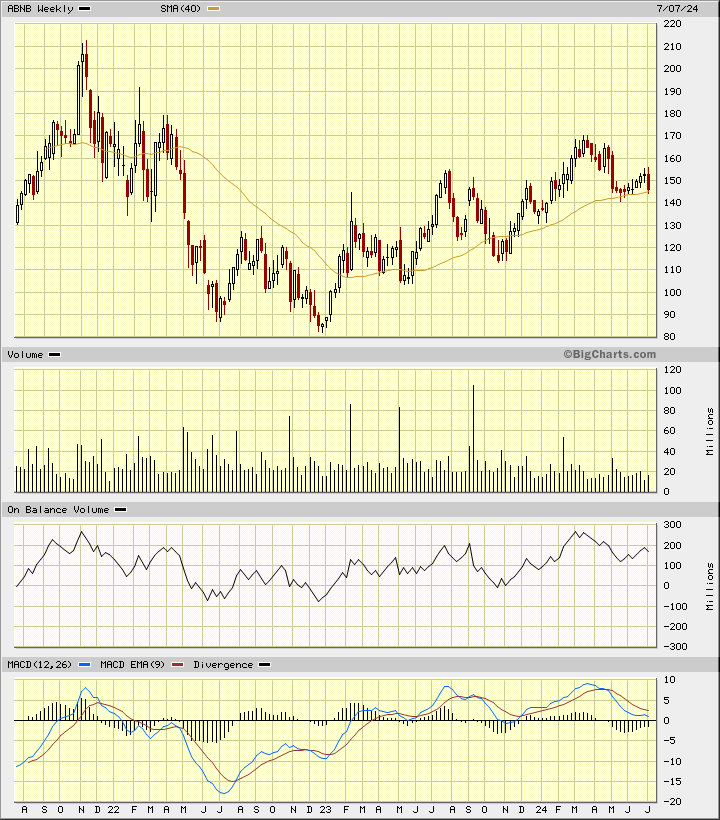
In the weekly Japanese candlestick chart of ABNB, below, I see a less-than-bullish picture. Prices have turned direction from being in an uptrend to a sideways trend. ABNB looks poised to test and perhaps break the rising 40-week moving average line.
The weekly trading volume has declined the past six months or so suggesting that investor interest has declined. The weekly OBV line is still down from its March peak. The MACD oscillator has been correcting lower but is still holding (for now) above the zero line.
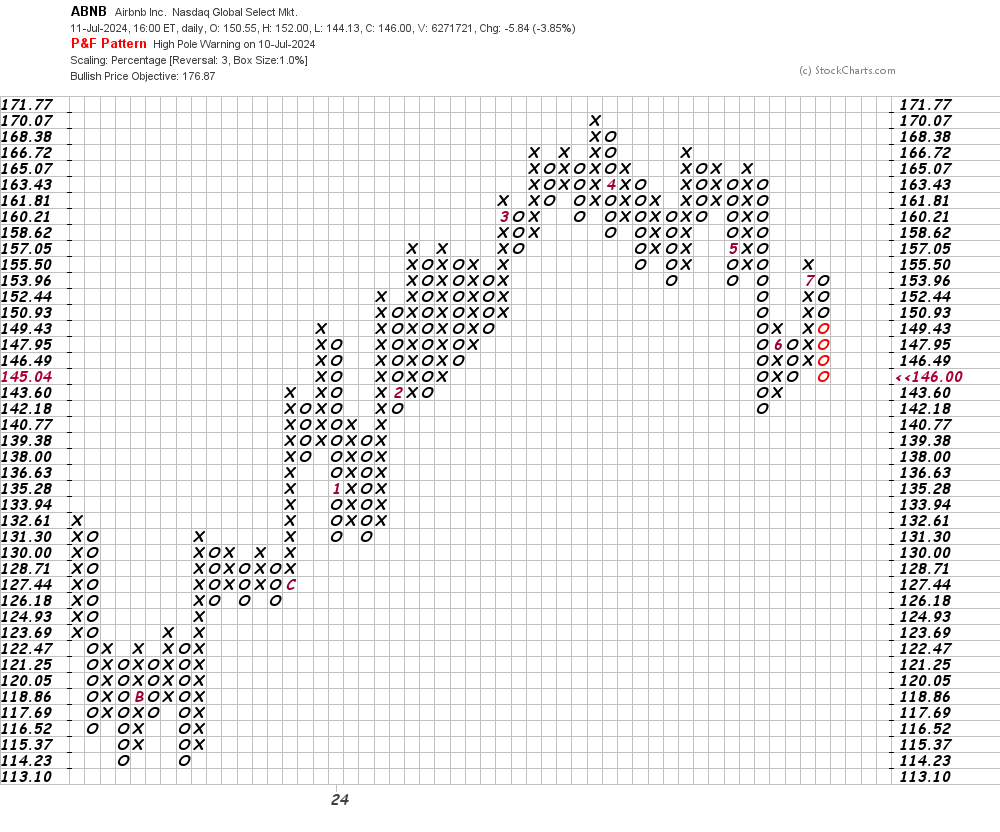
In this daily Point and Figure chart of ABNB, below, I can see that the software still shows an upside price target of $177 for the stock but a trade at $140.77 will refresh the downtrend.
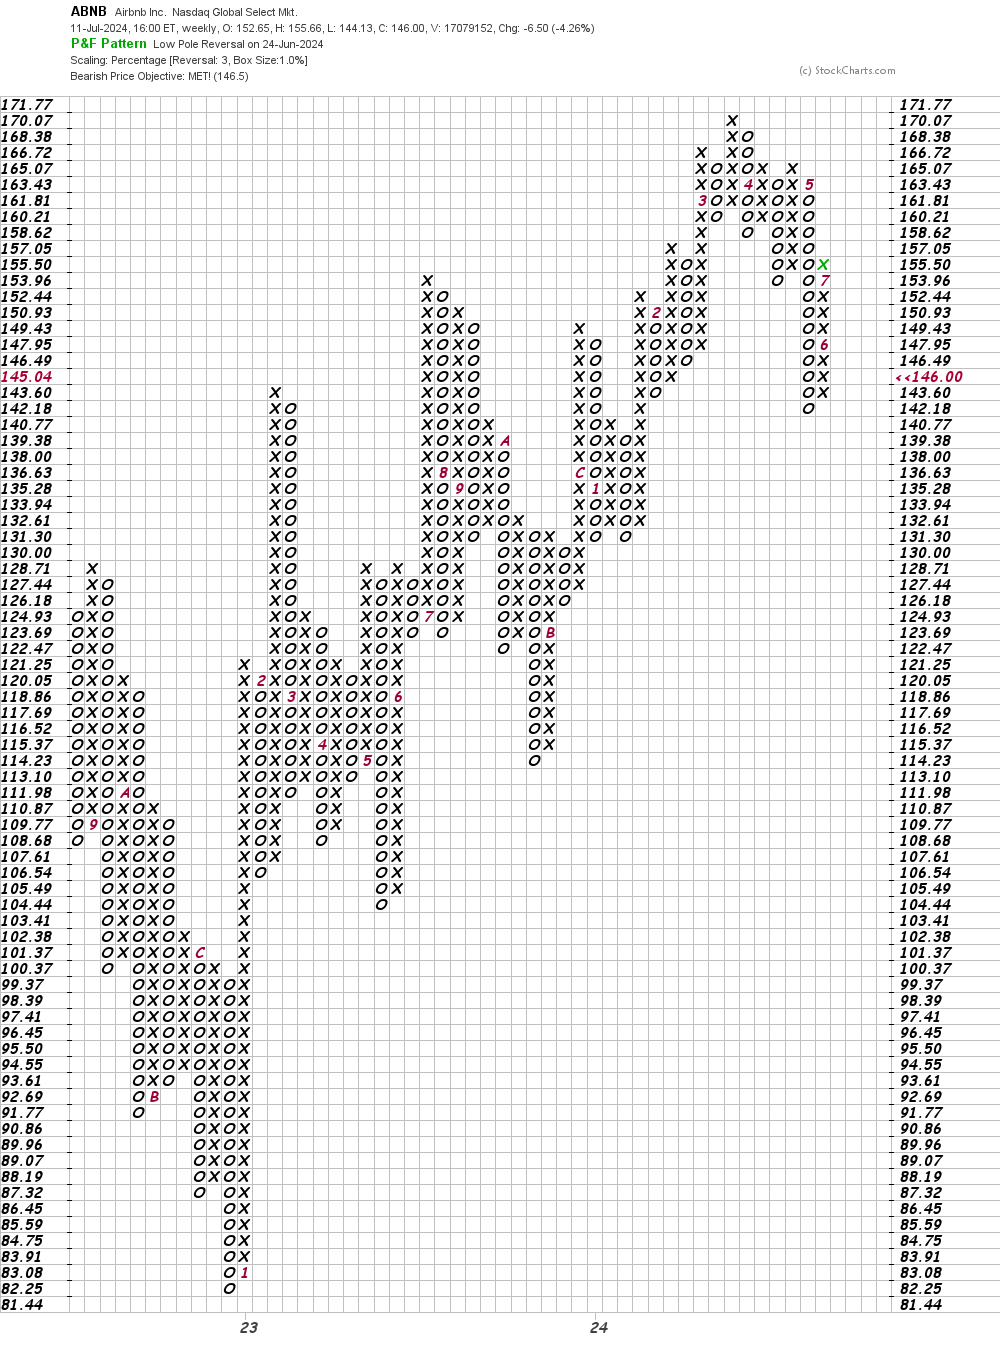
In this weekly Point and Figure chart of ABNB, below, I can see that prices reached a downside price target in the $146 area.
Bottom-line strategy: If you need to get away for a few days by all means do it but I would not overstay your welcome with the shares of ABNB.
Employees of TheStreet are prohibited from trading individual securities.