Will DraftKings Hit It on the Green or Into the Rough?
Let's check out the charts during Masters week.
You've reached your free article limit
You've read 0 of 1 free Pro articles.
This coming weekend the spotlight is on golf and The Masters so let's check out a gaming stock, DraftKings DKNG. I have no shot at the $18,000,000 purse but maybe we can make some money with the right technical strategy.
Let's check out the charts.
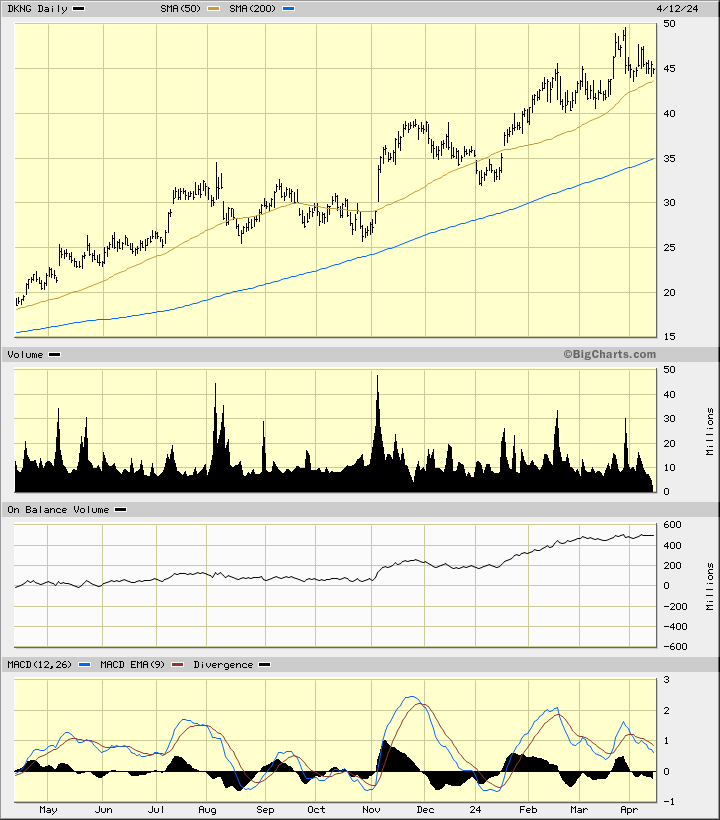
In the daily bar chart of DKNG, below, I can see that share prices have trended higher the past 12 months but not without a number of corrections. DKNG now trades above the rising 50-day moving average line and above the rising 200-day line.
The daily On-Balance-Volume (OBV) line has turned sideways the past six weeks. The daily Moving Average Convergence Divergence (MACD) oscillator has made lower highs from November. This tells me that the trend-strength has been weakening and also gives a bearish divergence when compared to the price action.
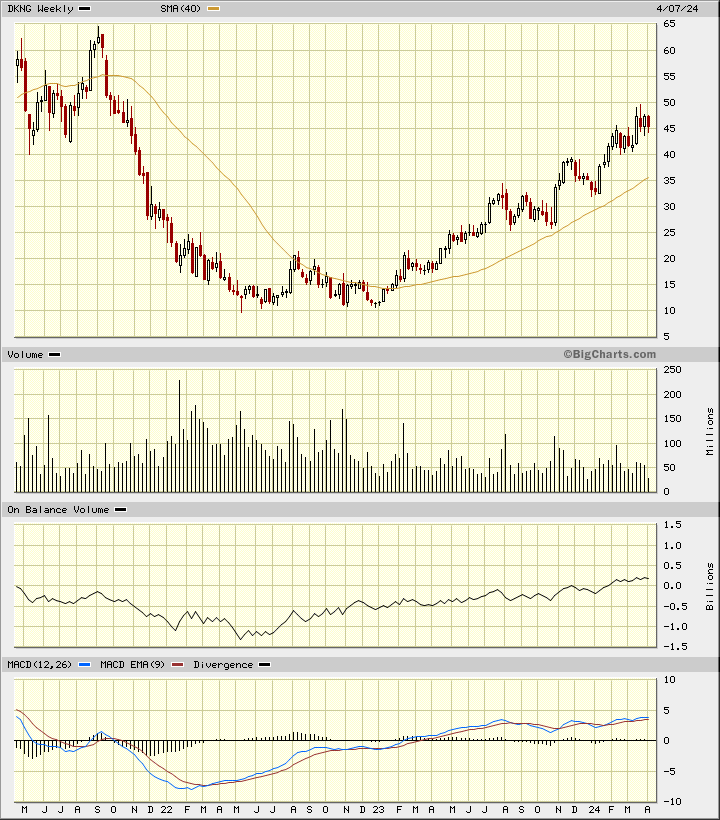
In the weekly Japanese candlestick chart of DKNG, below, I can see subtle signs of weakness. The shares have rallied and trade above the rising 40-week moving average line. The weekly volume histogram shows a pattern of declining volume the past two years. Investor interest seems to be weakening over time.
The OBV line shows us a rise but it looks like things are starting to level off. The MACD oscillator is close to a possible downside crossover and take profit sell signal. The candles show that traders are starting to reject the $50 level.
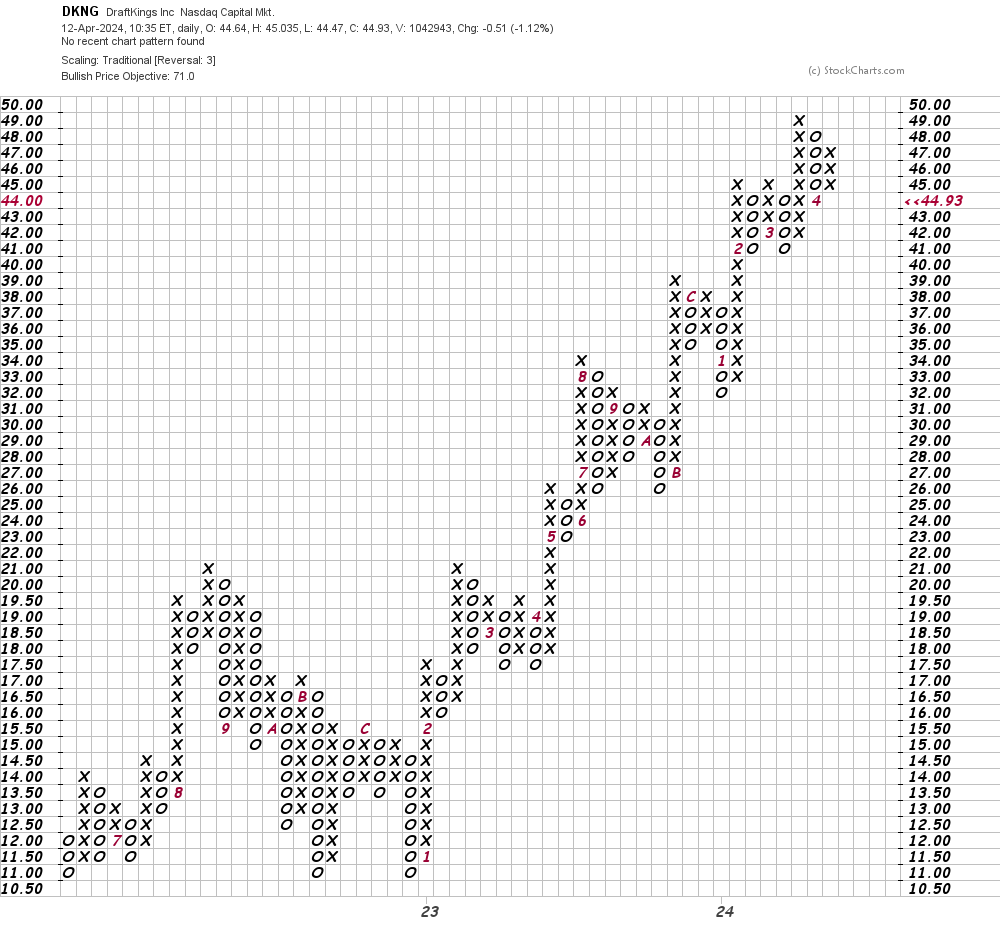
In this daily Point and Figure chart of DKNG, below, I can see a possible upside price target in the $71 area but a trade at $43 or $40 weakens the picture.
In this weekly Point and Figure chart of DKNG, below, I can see the same picture as the daily chart above.
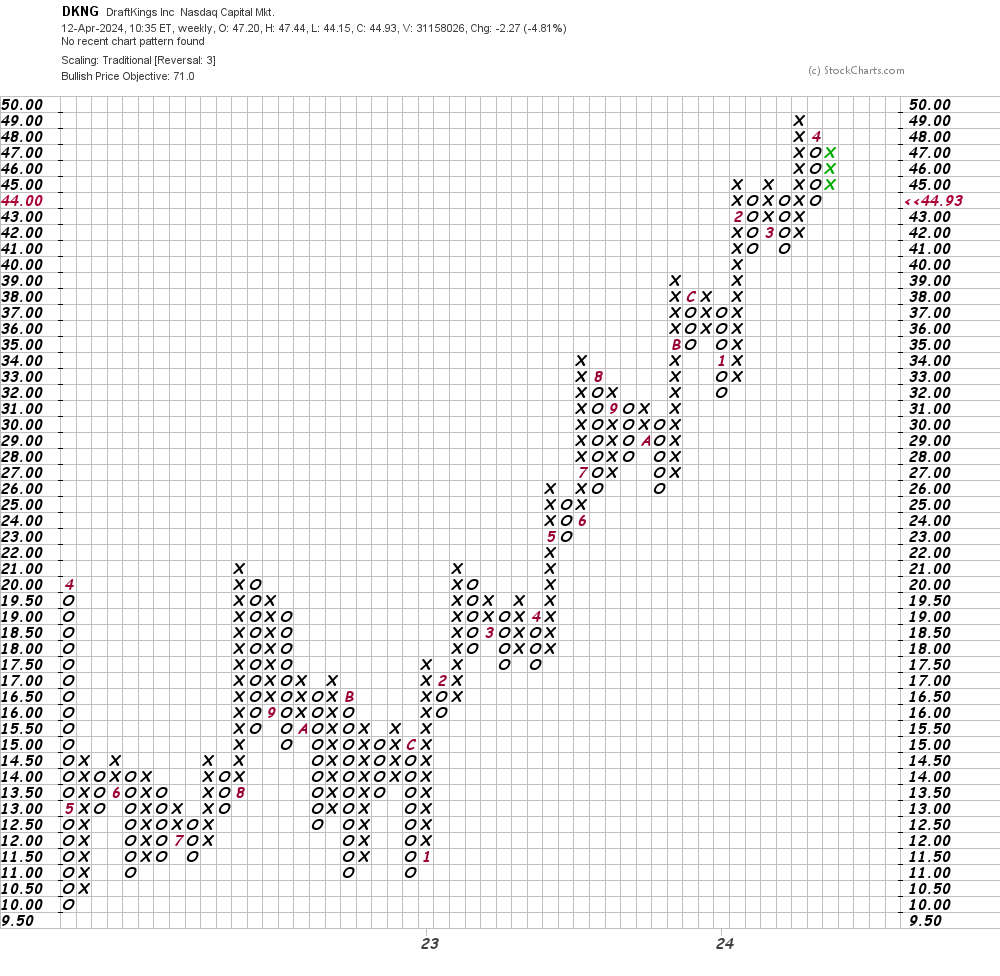
Bottom-line strategy: Traders should either take profits on long positions or at least raise stops to $42 to lock in gains.
Employees of TheStreet are prohibited from trading individual securities.