Why Boston Beer Is Showing Wicked Moves on the Charts
The stock is experiencing sharp ups and downs. Here's how to play it now.
You've reached your free article limit
You've read 0 of 1 free Pro articles.
Boston Beer SAM jumped sharply Friday on a report that Japanese beverage company Suntory Holdings STBFY was in talks to buy the maker of Sam Adams beer. It's Monday and Suntory Holdings says it is not in discussions to buy SAM.
Let's check out the charts.
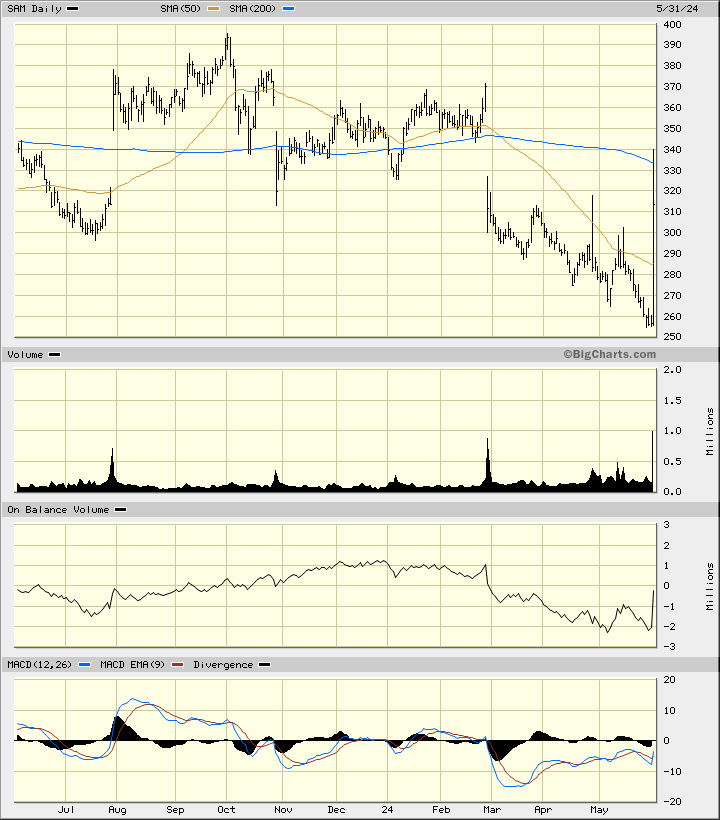
In the daily bar chart of SAM, below, I can see a downward trend in the stock price until this past Friday. Prices surged sharply higher but closed off their best levels of the day. Trading volume was heavy.
The daily On-Balance-Volume (OBV) line turned higher and so did the Moving Average Convergence Divergence (MACD) oscillator. This Monday morning prices are sharply lower in the early going (not plotted).
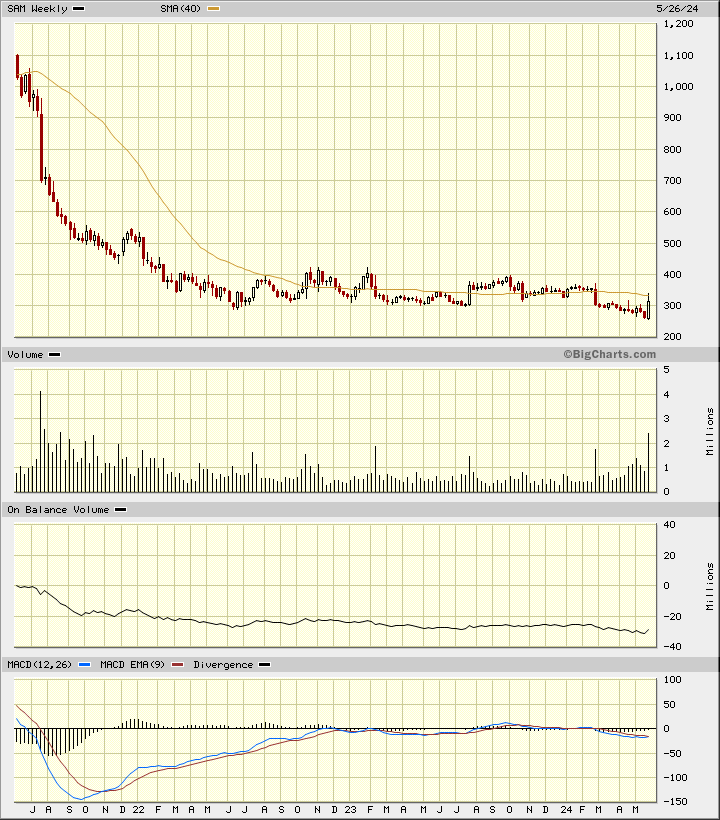
In this weekly Japanese candlestick chart of SAM, below, I can see that prices have been in a longer-term decline. Friday's rally only took prices to the underside of the 40-week moving average line.
The trading volume shows an increase in recent weeks and that can sometimes be a "tell" of investor interest or even an impending "deal."
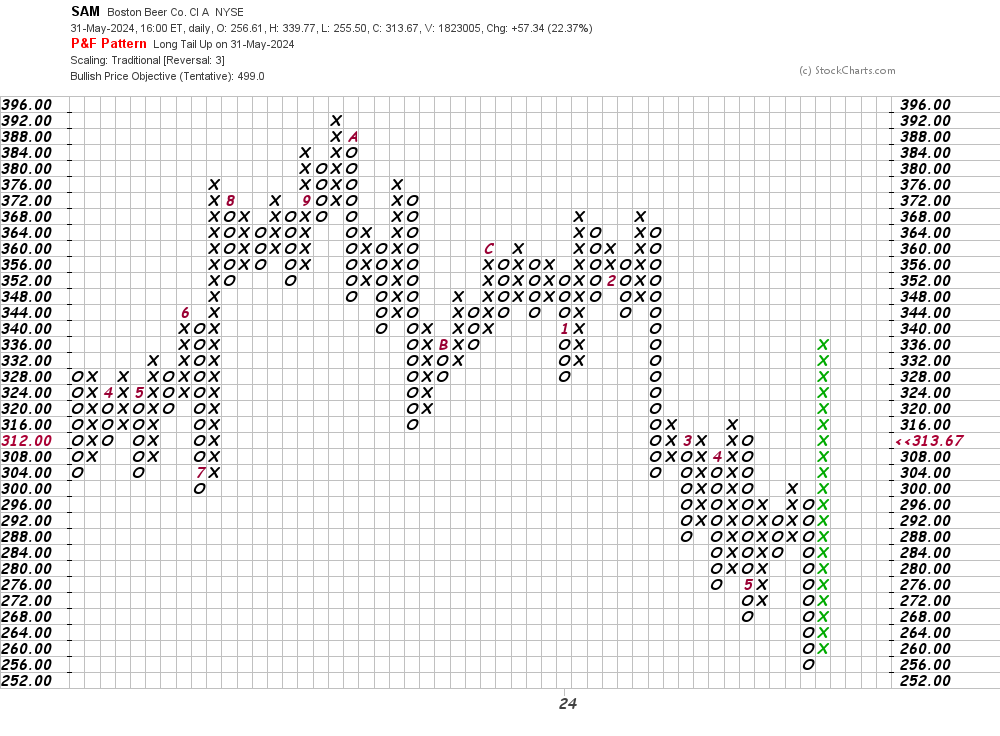
In this daily Point and Figure chart of SAM, below, I can see an upside price target in the $499 area.
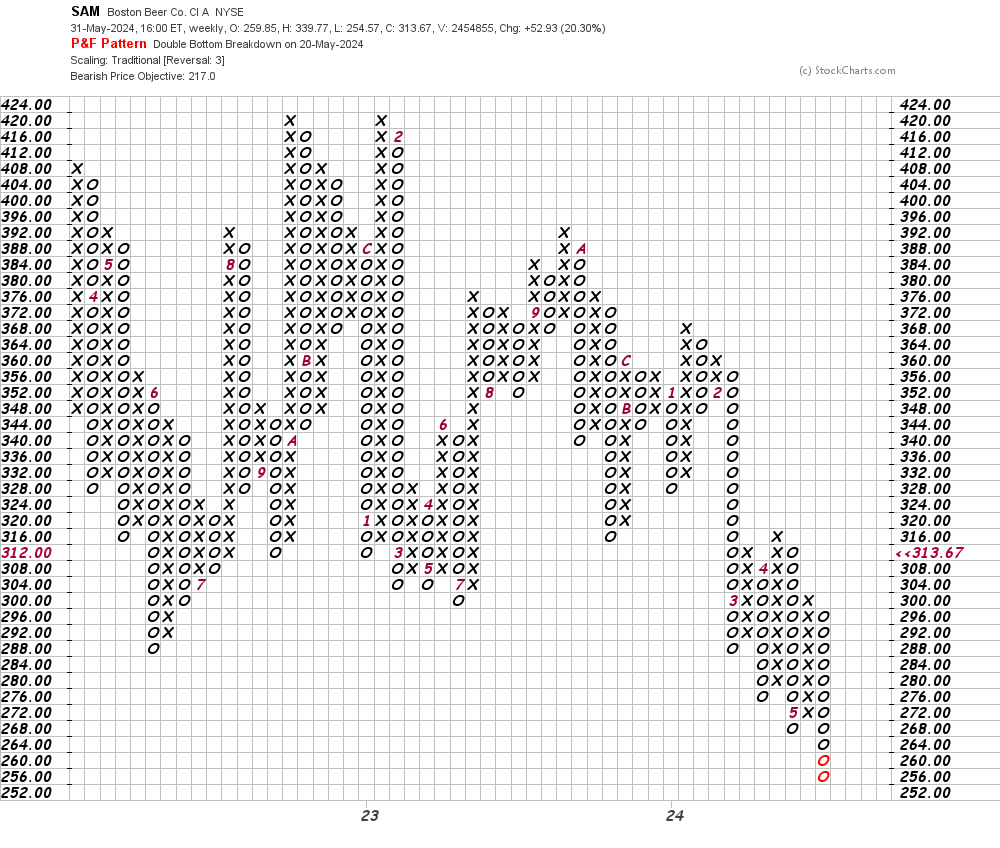
In this weekly Point and Figure chart of SAM, below, I can see a downside price target in the $217 area.
Bottom-line strategy: I have no special knowledge of any deal to buy SAM. I have no idea if there could be other interested parties. With these sharp up and down moves I would just pick up a six pack of your favorite and avoid trading the stock for now.
Employees of TheStreet are prohibited from trading individual securities.