We Can't Read Buffett's Mind on BofA, but We Can Read the Charts
Berkshire sold a chunk of its Bank of America shares, so let's see what the technicals say about the bank.
You've reached your free article limit
You've read 0 of 1 free Pro articles.
Traders learned this weekend that Warren Buffett's Berkshire Hathaway BRK.A sold part of its large stake in Bank of America Corporation BAC. The transaction saw Buffett's firm decrease its position in BAC by 3.28%. After this sale, which was reported Friday, BAC still represents 12.85% of Buffett's total portfolio.
Let's check out the charts and indicators of BAC.
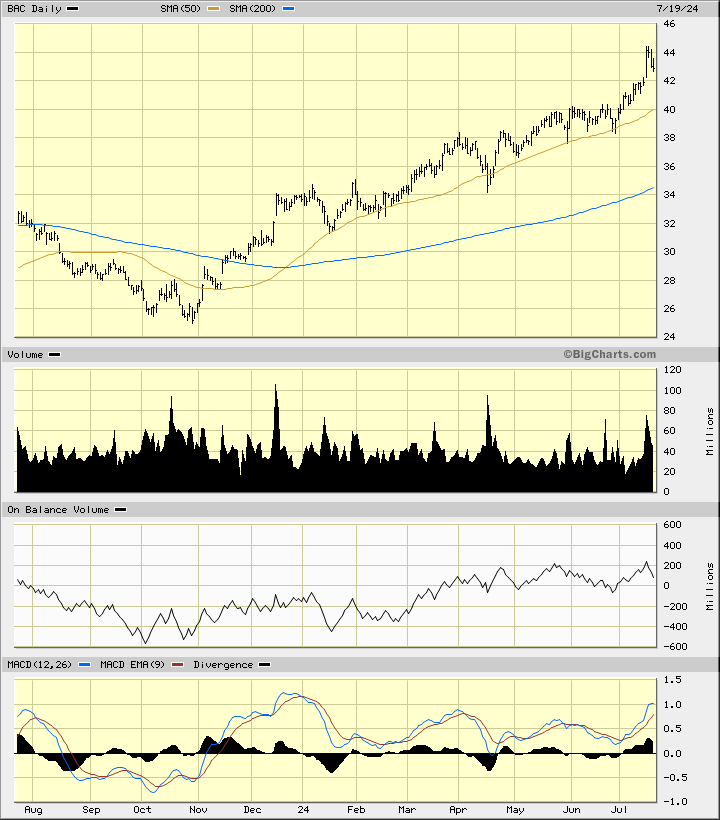
In this daily bar chart of BAC, below, I can see that prices have made a strong advance, since making a low back in October. Prices are trading above the rising 50-day moving average line and above the rising 200-day moving average line. Trading volume increased in the past week and probably helped to hide the actions of Buffett's trading team. The daily On-Balance-Volume (OBV) line shows me a pattern of three highs over the past four months. This is a bearish divergence as prices made higher highs while the indicator did not confirm the move to the upside. The Moving Average Convergence Divergence (MACD) oscillator is above the zero-line but narrowing. Also the MACD oscillator has made its own bearish divergence since December with low highs while prices made higher highs.
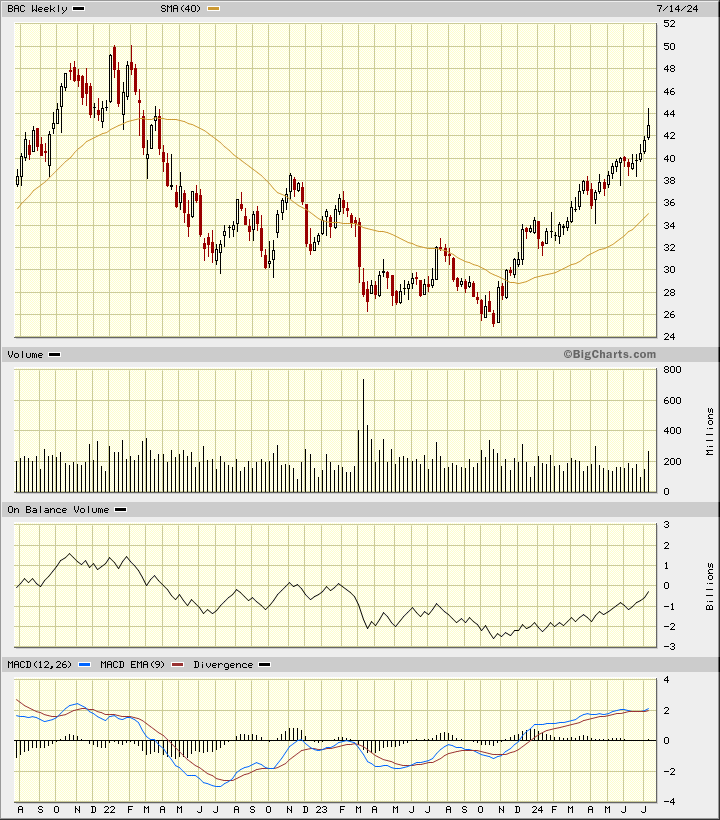
In this weekly Japanese candlestick chart of BAC, below, I can see a large upper shadow on the most recent candle pattern. Upper shadows tell us that traders have rejected the highs with prices closing off their best levels. The weekly OBV line shows us a rise from October and suggests that Buffett's traders were good at hiding their actions. The MACD oscillator is above the zero-line but very close to a downside crossover and take-profit sell signal.
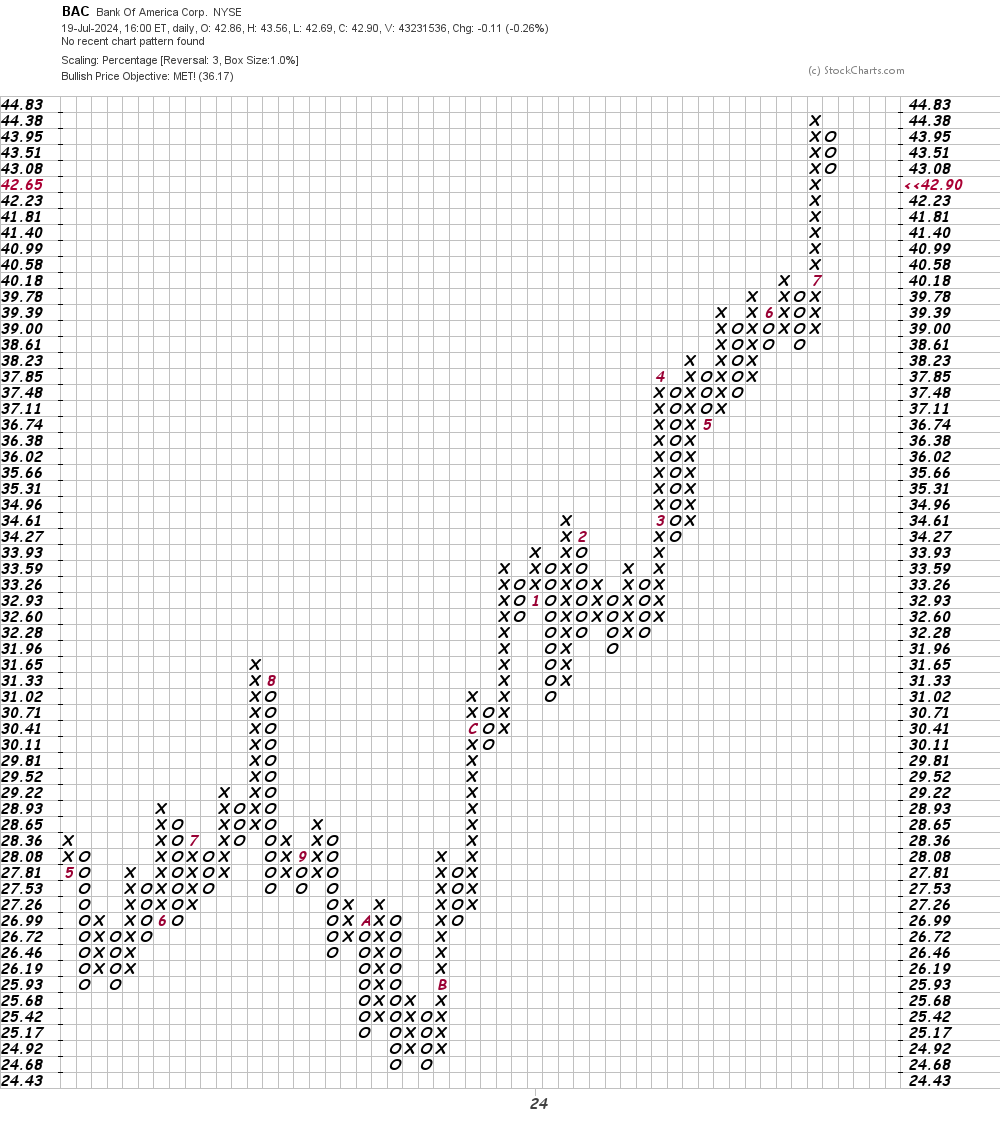
In this daily Point and Figure chart of BAC, below, I can see that prices reached and exceeded a price target in the $36 area.
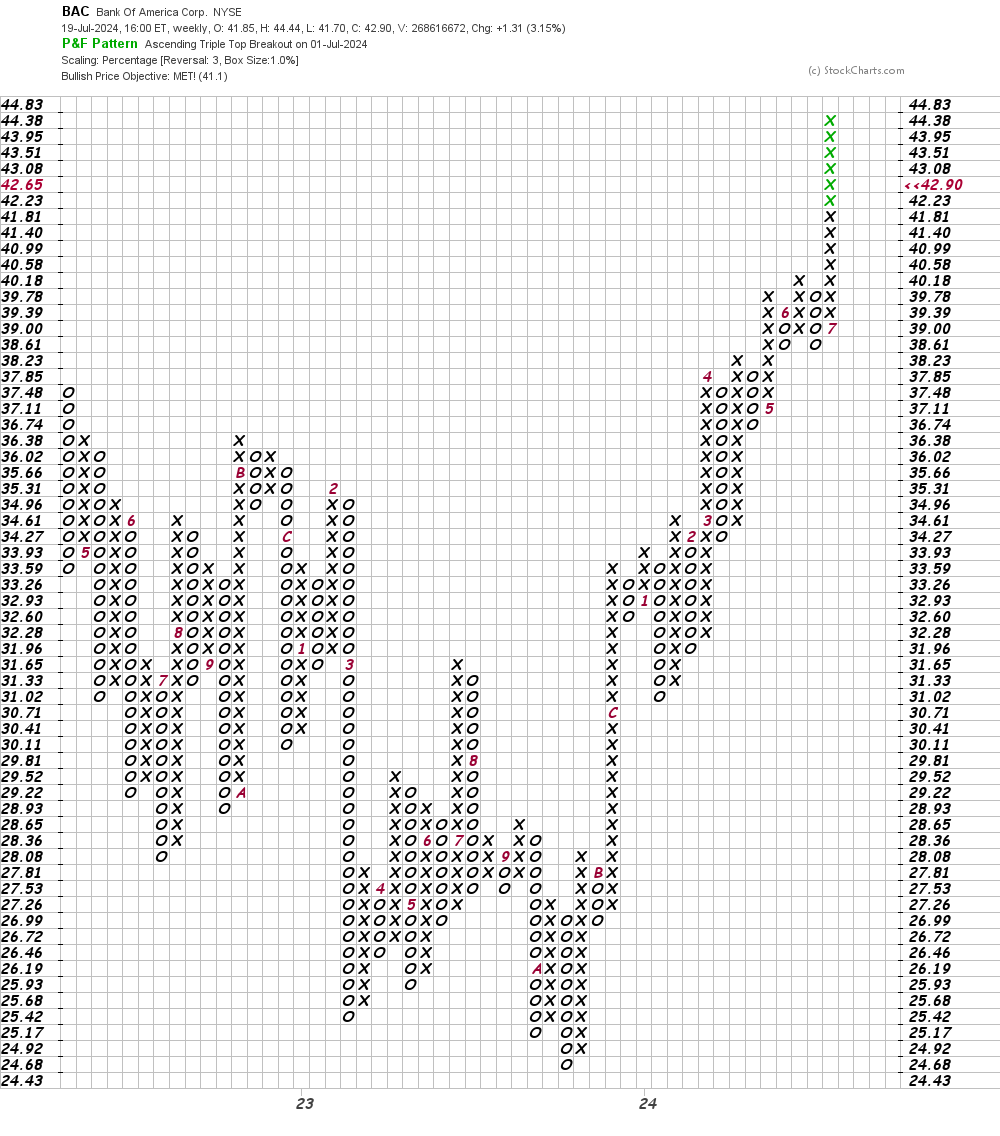
In this weekly Point and Figure chart of BAC, below, I can see that prices reached and exceeded a price target in the $41 area.
Bottom line strategy: Keep in mind that not all of Warren Buffett's trading decisions have made money, but his long-term track record has stood the test of time. Traders should keep in mind that the charts of BAC are not as strong as they used to be. If you are nervous you should raise your stop protection.
Employees of TheStreet are prohibited from trading individual securities.