Wait for This Price Before Buying Hewlett Packard
Shares of Hewlett Packard Enterprise are rallying but the data shows a critical intraday pullback target to wait on.
You've reached your free article limit
You've read 0 of 1 free Pro articles.
Shares of Hewlett Packard Enterprise HPE are rallying Wednesday morning after topping the consensus expectations in FQ2 results and providing an upbeat outlook on Tuesday evening. The company provides intelligent solutions and cloud-based services. The company’s product portfolio comprises servers, storage devices, networking products, converged systems, software and customized financial solutions.
Let's check the charts and indicators.
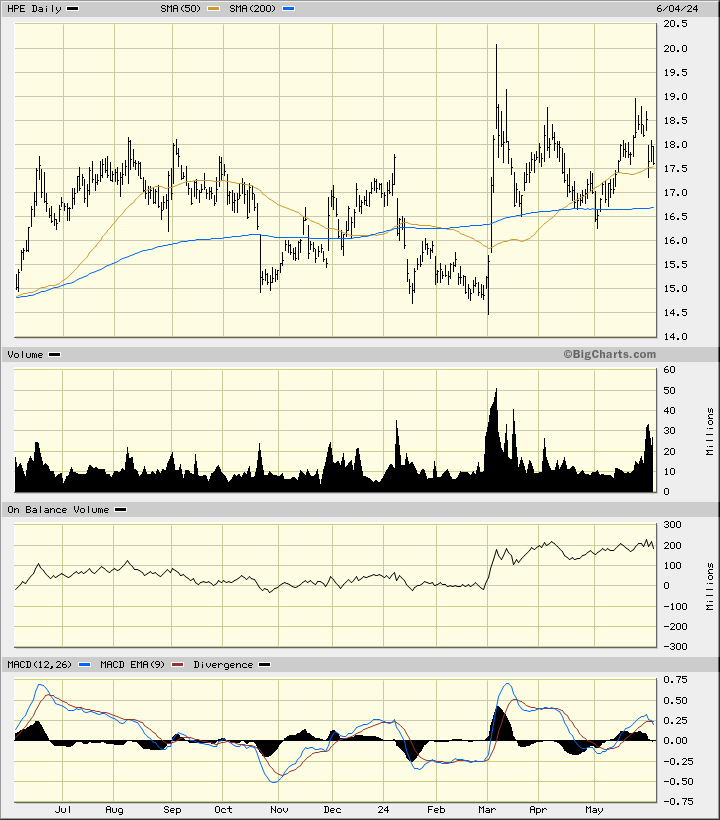
In this daily bar chart of HPE below, I can see that prices have been moving in a choppy sideways "trend" for the past year. I have to imagine prices trading around $20 this morning before the NYSE opens. HPE could reach a new high for the move up today. The trading volume has been more active since early March, suggesting increased investor interest. The slope of the 50-day moving average line is positive and so is the 200-day line. The On-Balance-Volume (OBV) line jumped higher in early March and has remained steady. The Moving Average Convergence Divergence (MACD) oscillator is above the zero line.
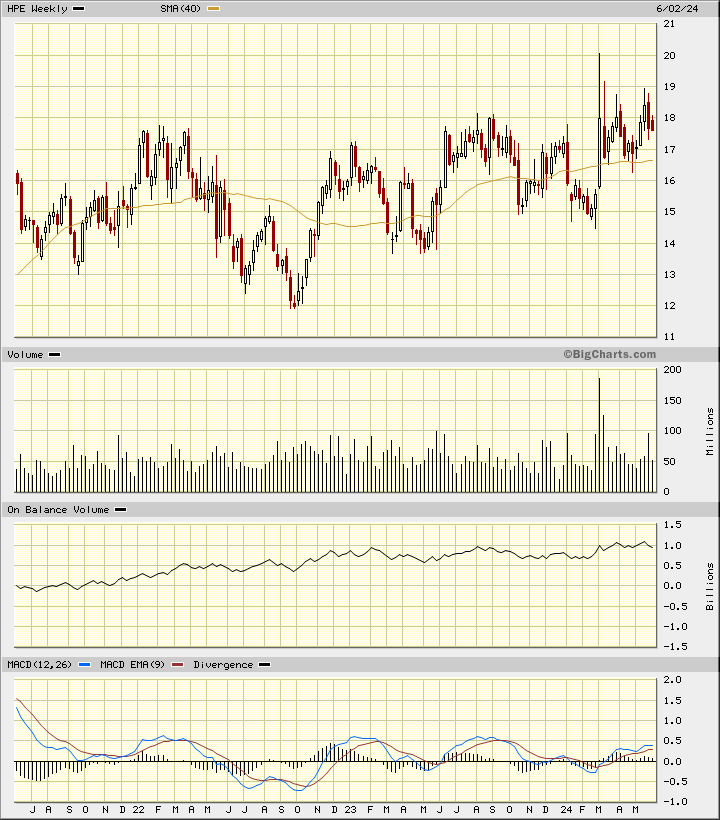
In this weekly Japanese candlestick chart of HPE below, I can see an upward sloping channel from a low in 2022. Wednesday's rally should put prices at the upper return line of the channel. Prices trade above the rising 40-week moving average line. The OBV line shows us a rising trend the past three years. The MACD oscillator is in a bullish alignment above the zero line.
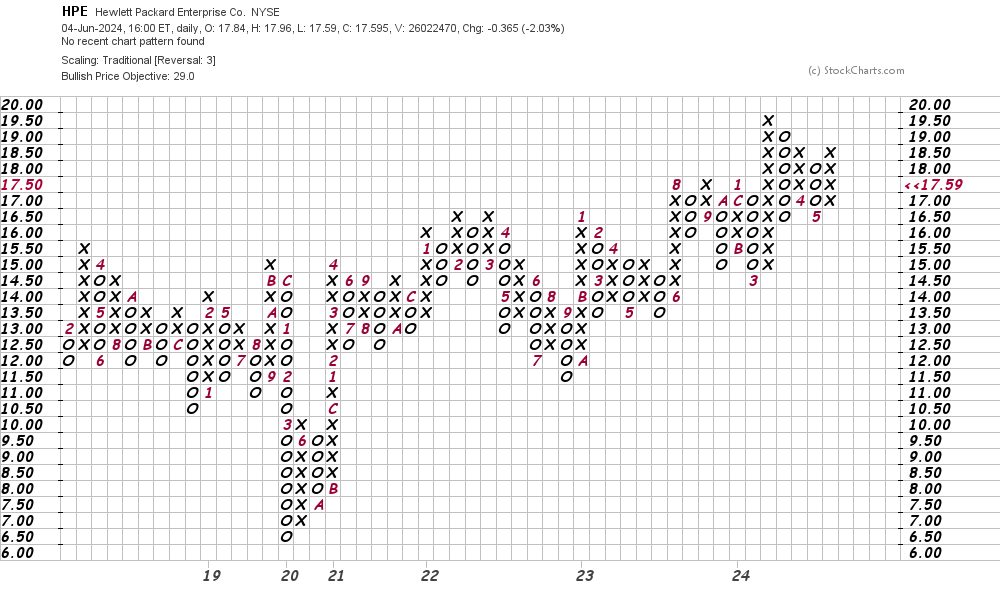
In this daily Point and Figure chart of HPE, below, I can see a price target in the $29 area.
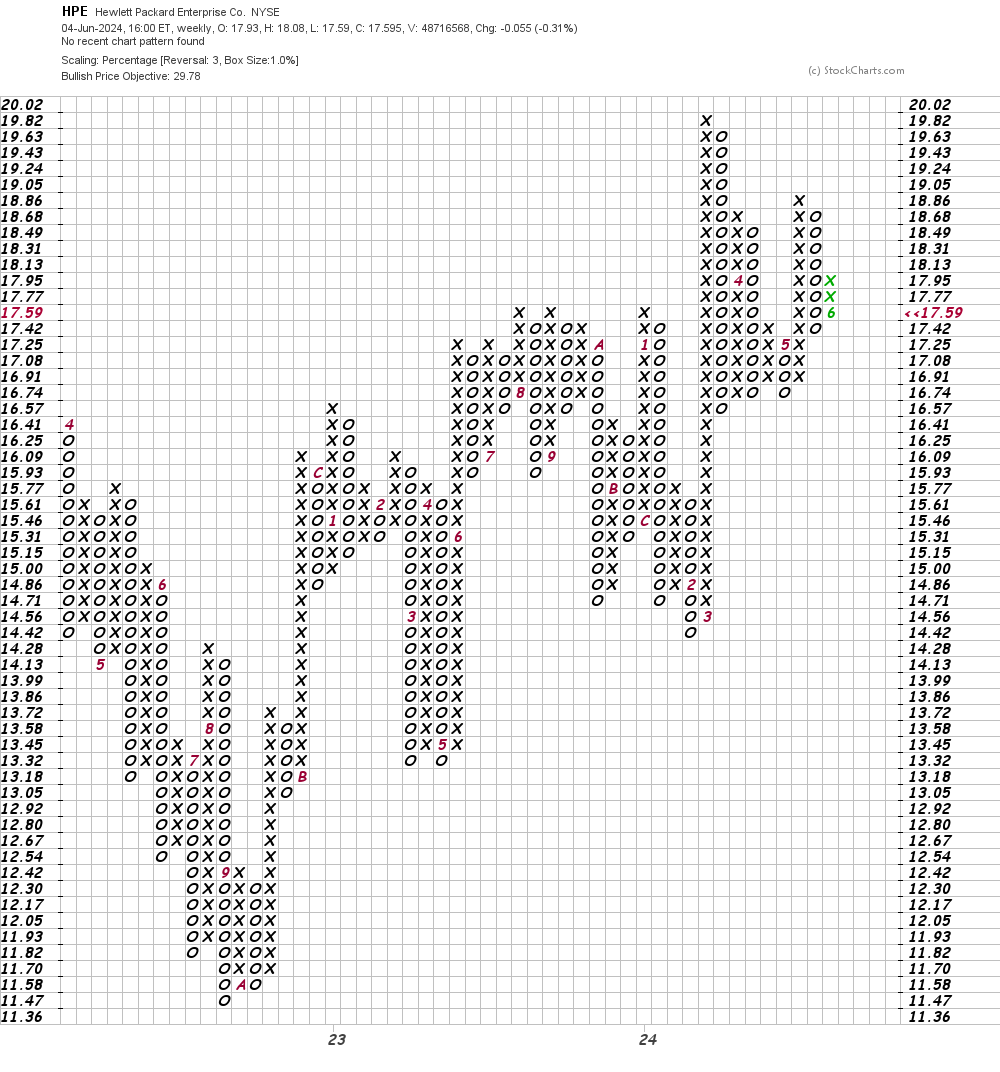
In this weekly Point and Figure chart of HPE, below, I can see a price target of $30.
Bottom line strategy: Traders who are looking to buy HPE should wait for an intraday pullback to the $19 area. Risk to $17.50. The $29-$30 area is my price target for several months out.
Employees of TheStreet are prohibited from trading individual securities.