TransUnion Looks Like a Credit-Worthy Trade
Let's check the charts and see where to buy this stock and updated price targets.
You've reached your free article limit
You've read 0 of 1 free Pro articles.
TransUnion TRU is one of the three major credit bureaus. (The other two are Equifax and Experian.) TRU gathers information on credit history and activity, among other things, to generate credit reports.
I want to report that the charts of TRU are looking pretty good. Let's check.
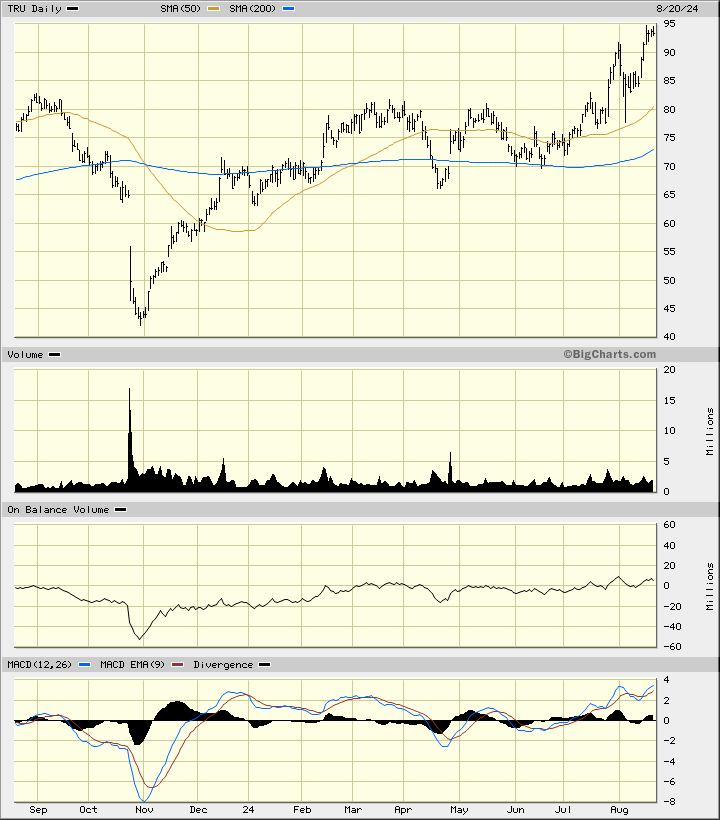
In this daily bar chart of TRU, below, I can see that prices made a "V" bottom in late October. Prices have rallied and now trade above the rising 50-day moving average line and above the rising 200-day line. The On-Balance-Volume (OBV) line shows us a gentle rise the past year and supports the price gains we have seen so far. The Moving Average Convergence Divergence (MACD) oscillator is in a bullish alignment above the zero-line.
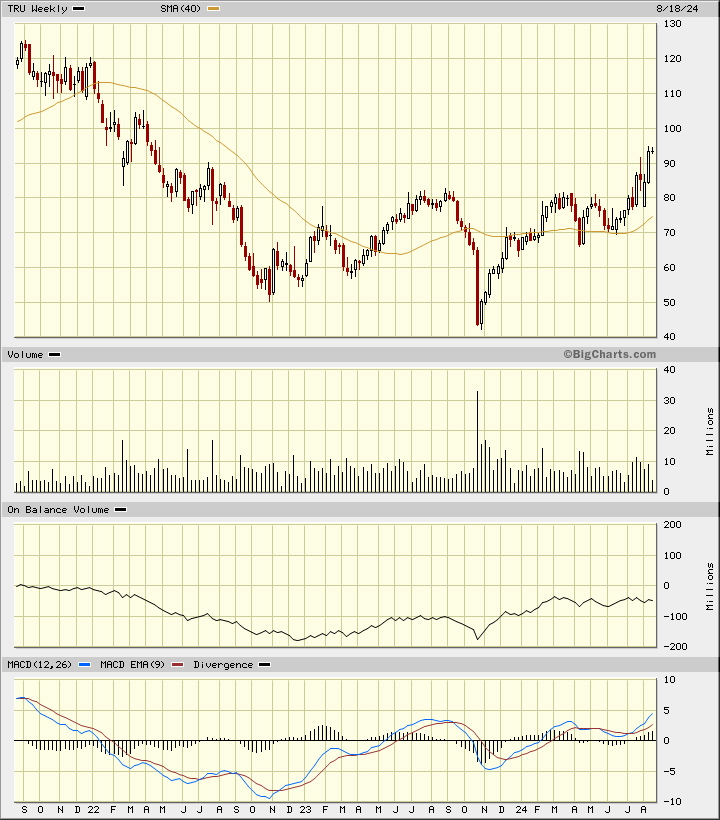
In this weekly Japanese candlestick chart of TRU, below, I can see an impressive-looking bottom formation over the last three years. Prices trade above the rising 40-week moving average line. The weekly volume histogram shows more activity in the past year. The weekly OBV line has been improving the past two years. The MACD oscillator is pointed higher from above the zero-line. All good.
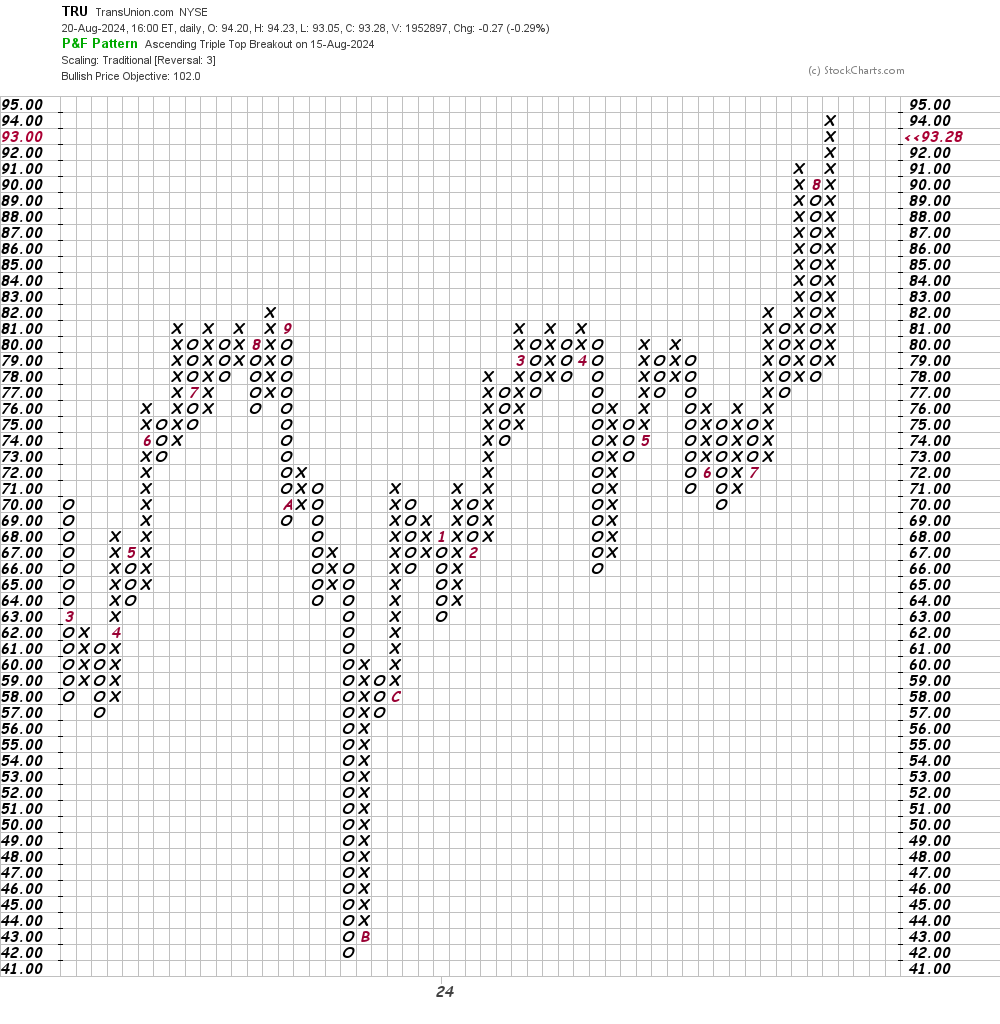
In this daily Point and Figure chart of TRU, below, I can see an upside price target in the $102 area.
In this weekly Point and Figure chart of TRU, below, I can see that the software is projecting a price target in the $129 area.
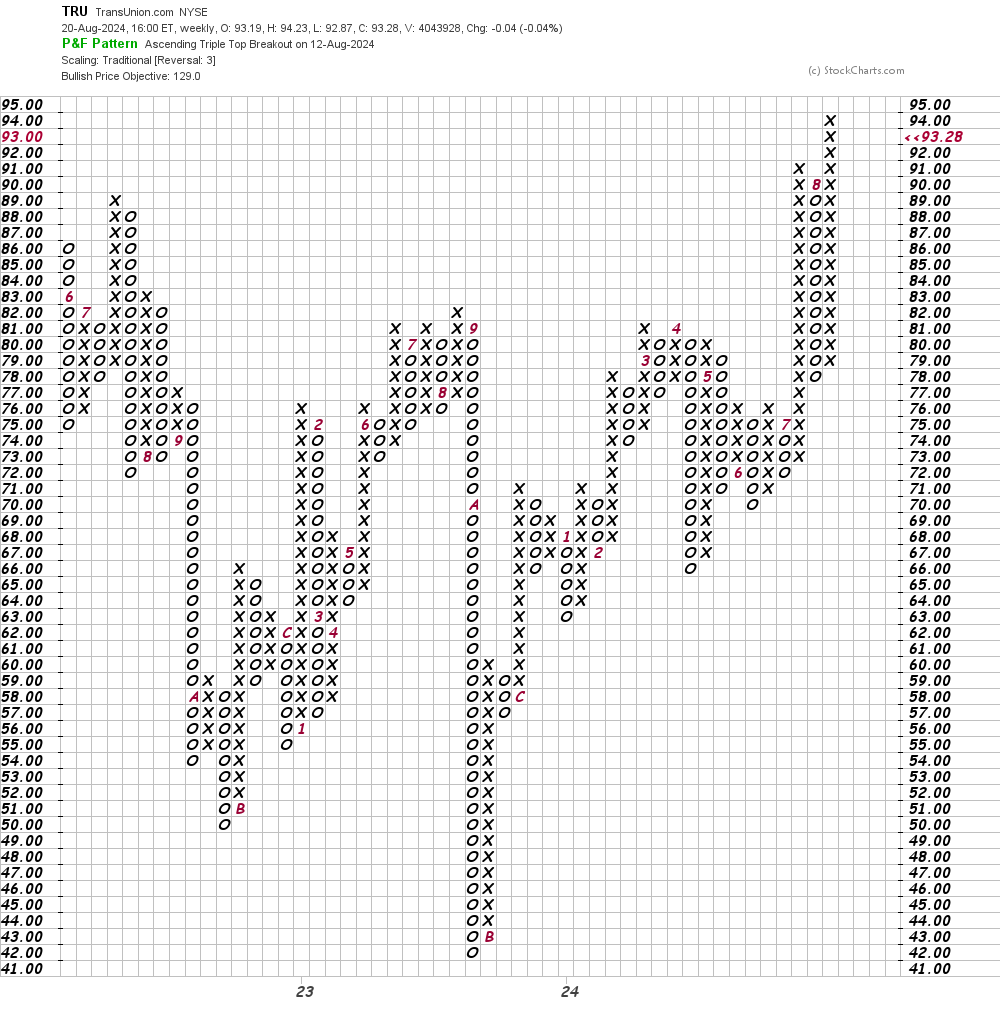
Bottom line strategy: Traders could go long TRU on a dip closer to $90 risking to $83. The price targets are $102 and then the $129 area.
Employees of TheStreet are prohibited from trading individual securities