Traders Can Go Long on Netflix
A deep dive on the charts shows an opportunity in Netflix for traders who can afford it.
You've reached your free article limit
You've read 0 of 1 free Pro articles.
Streaming service Netflix NFLX has been trading higher in August and just posted a new 52-week high. Will prices continue to get clear reception or will the signal be intermittent?
Let's check out the charts and indicators.
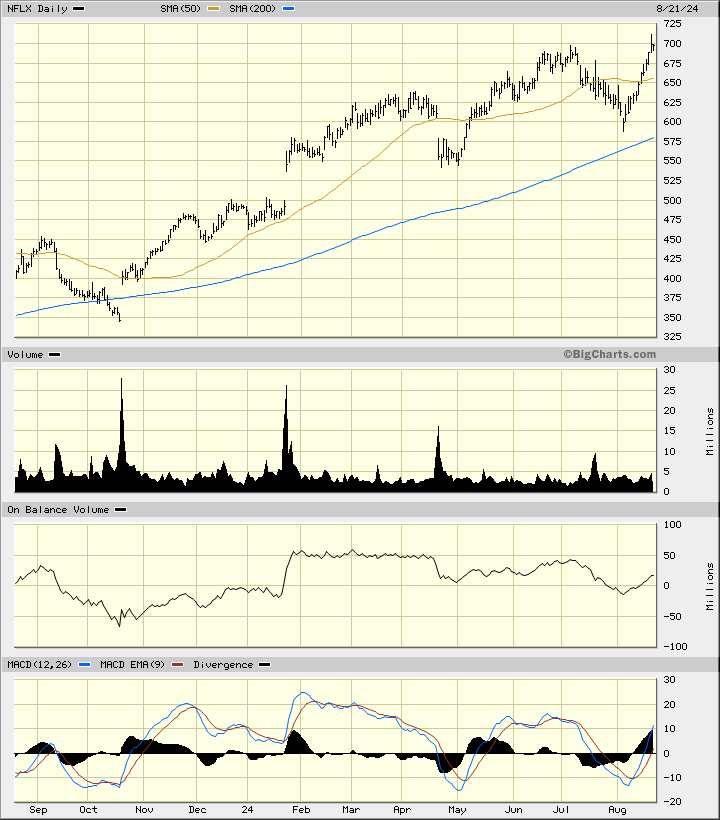
In this daily bar chart of NFLX below, I can see that prices have been moving higher and trade above the rising 50-day moving average line and above the rising 200-day moving average line. The On-Balance-Volume (OBV) line shows me an uneven pattern that does not really confirm the price action. Trading volume has been steady. The trend-following Moving Average Convergence Divergence (MACD) oscillator has been moving around the zero line the past year but is now above it.
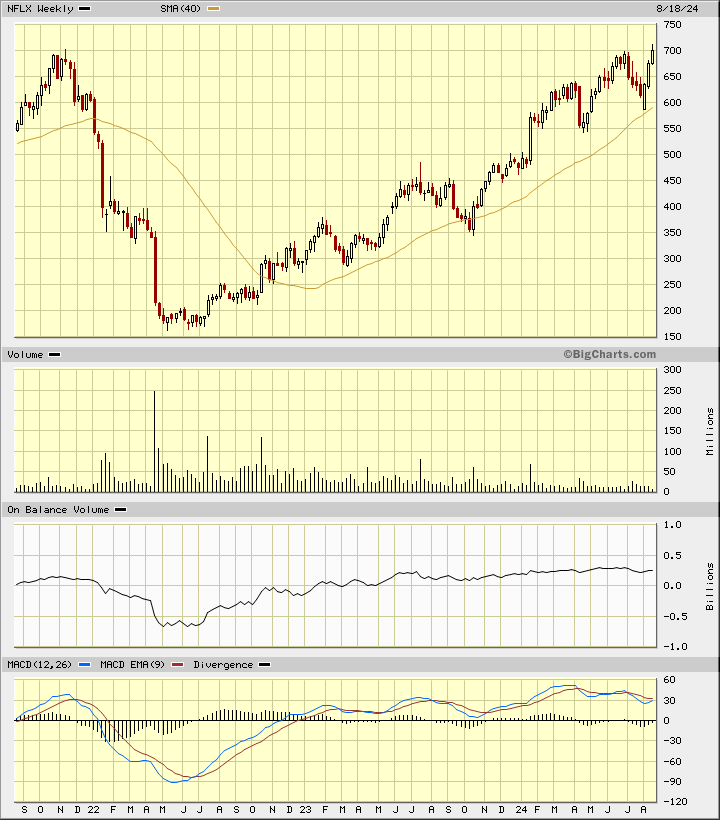
In this weekly Japanese candlestick chart of NFLX below, I can see a constructive looking setup. Prices are trading above the rising 40-week moving average line. The volume histogram does not show a pattern of increasing volume but the weekly OBV line has been positive for the past two years. The MACD oscillator is above the zero line and poised for a bullish cross to the upside.
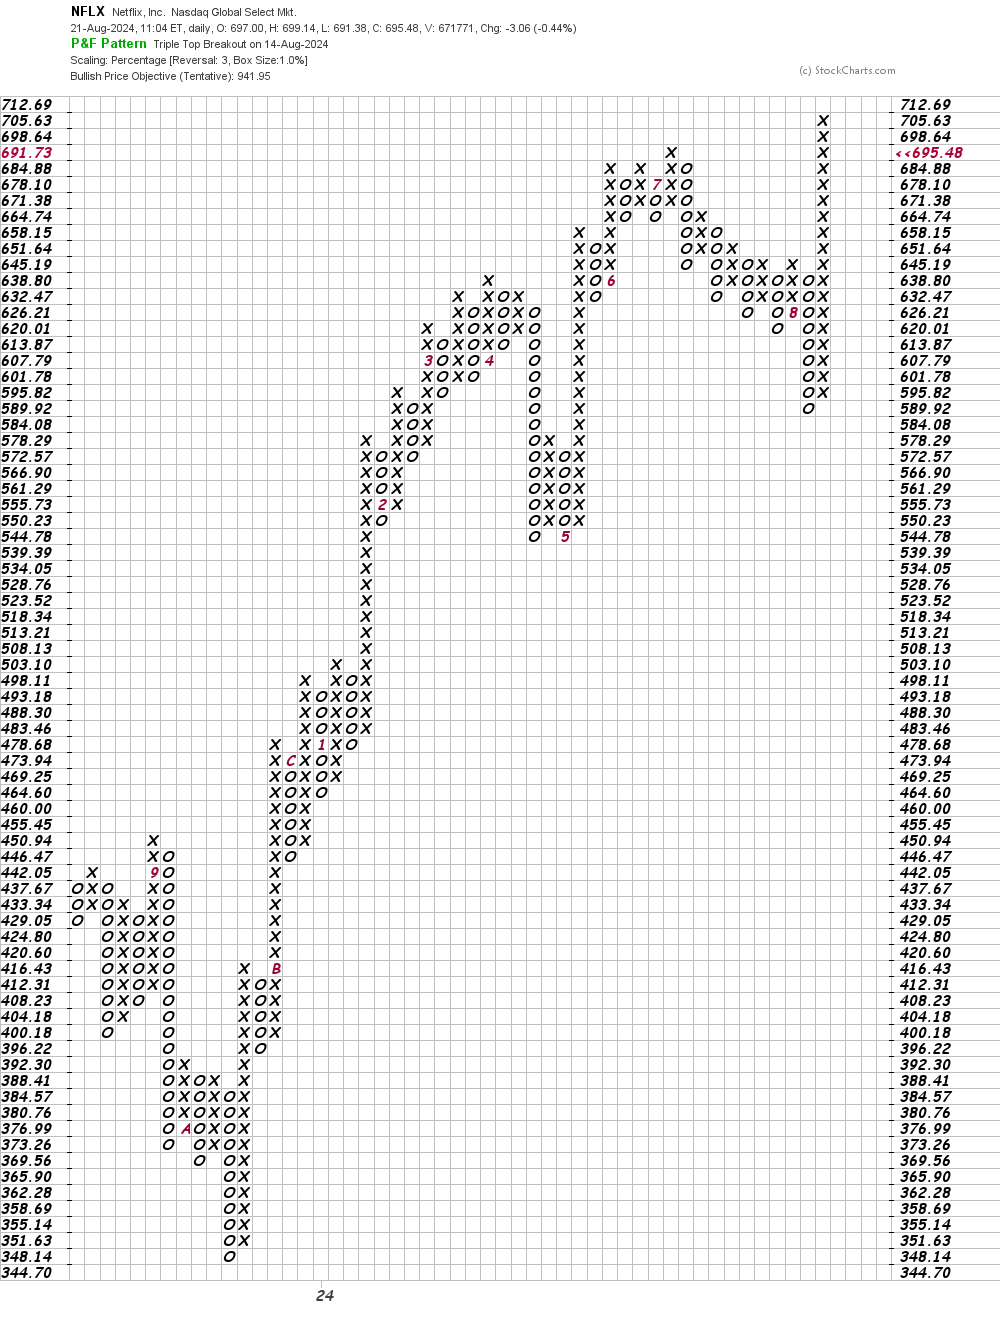
In this daily Point and Figure chart of NFLX below, I can see an upside price target in the $942 area.
In this weekly Point and Figure chart of NFLX below, I can see the same price target as the daily chart above — $942.
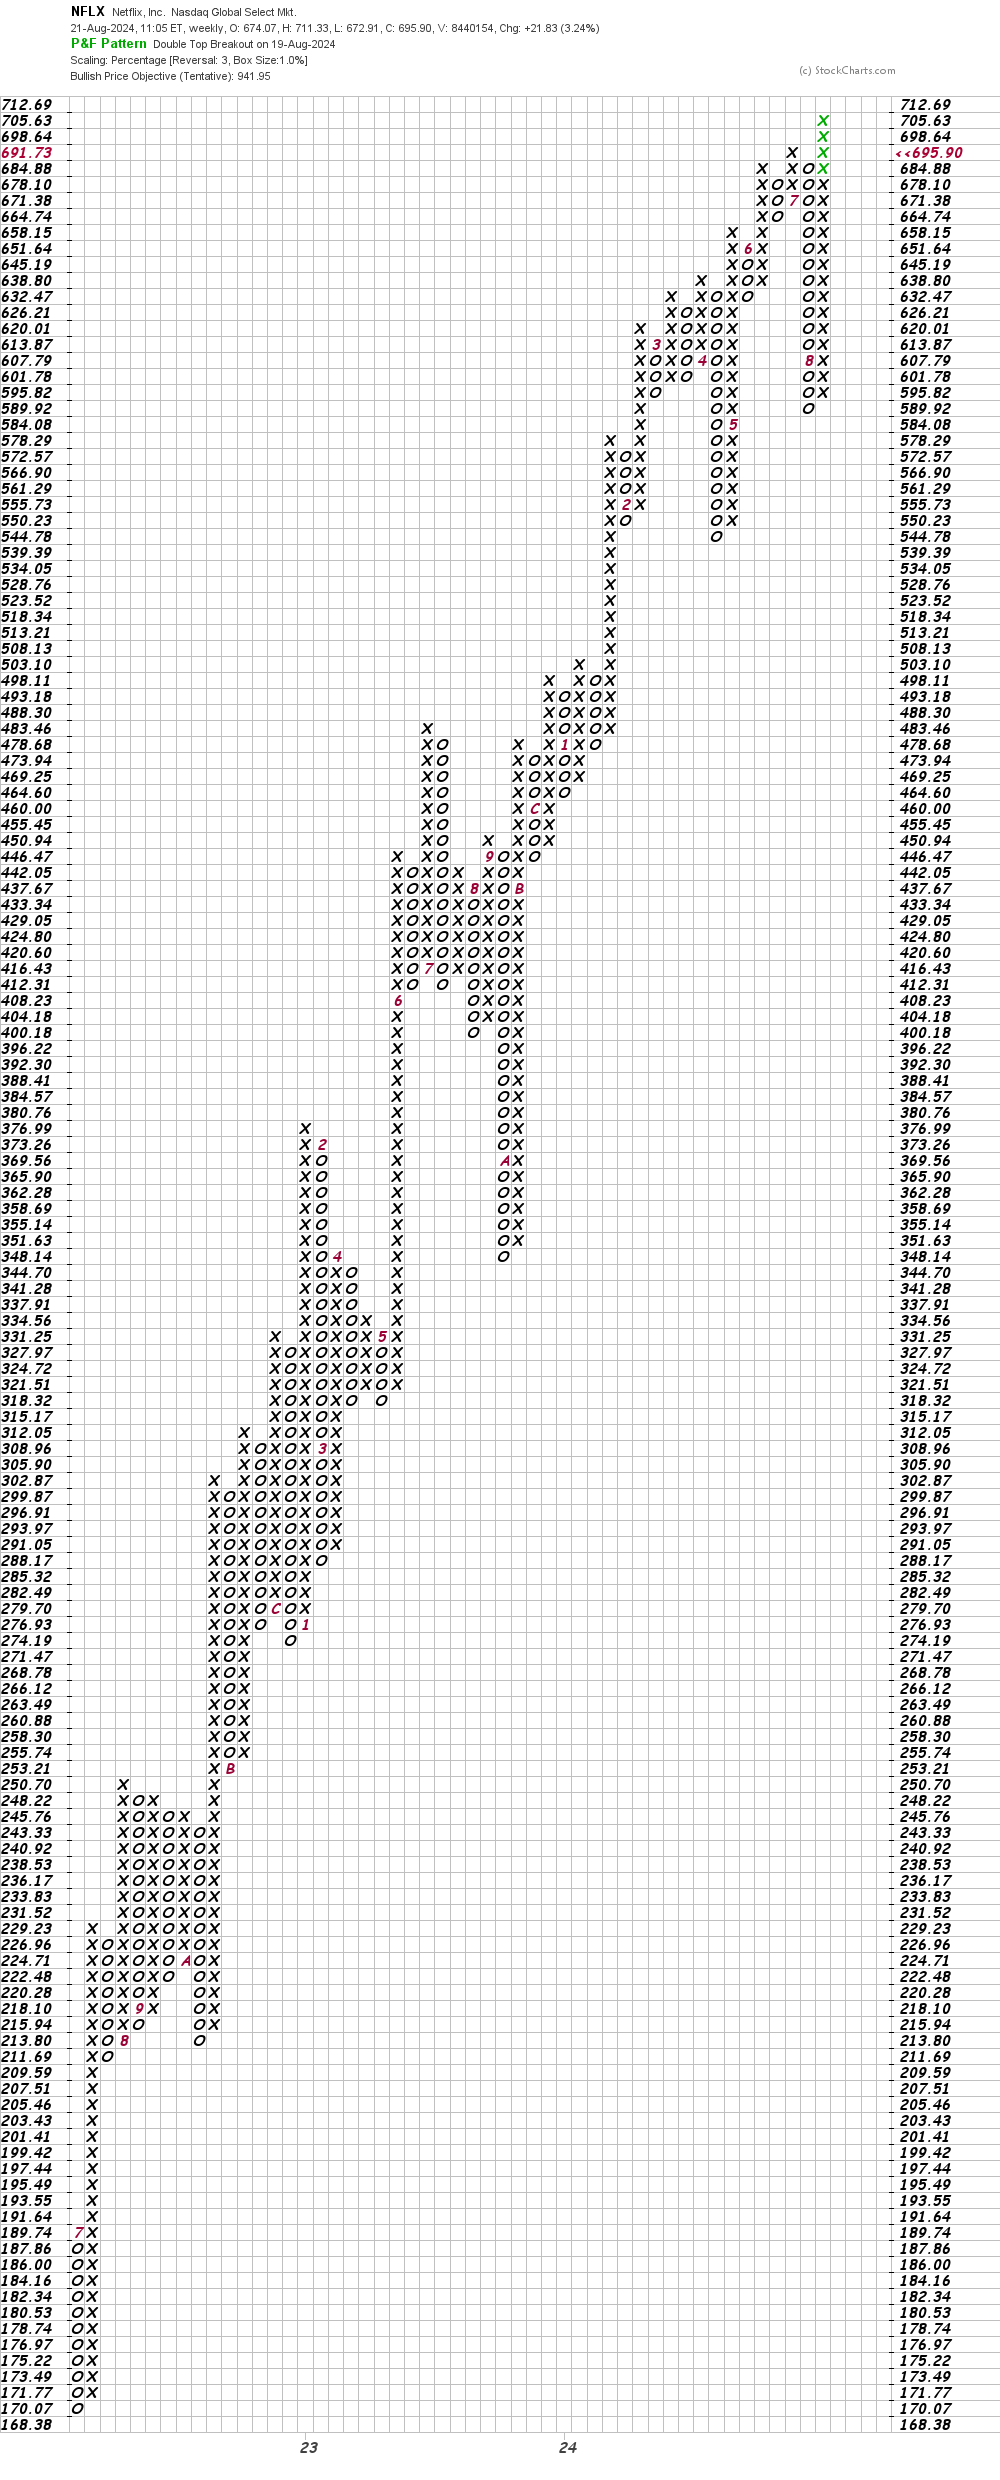
Bottom line strategy: In my July 17, 2024 review of NFLX, I looked for prices to weaken and now the picture has improved. Traders who can afford an appropriate sell stop could go long NFLX at current levels.
Employees of TheStreet are prohibited from trading individual securities.