Monday’s Market Settled Nothing, Though There Is a Bright Side
An up day for stocks. Well, about half of them, that is. Here’s what I’m watching.
You've reached your free article limit
You've read 0 of 1 free Pro articles.

The Market
Well, that was disappointing. It was all about the Terrific Ten rather than the others.
Upside volume on the NYSE amounted to 52%. Breadth on the NYSE was barely positive at +300. In fact, the NYSE did not even see an increase in the number of stocks making new highs.
The Transports were down (with that oil spill!). The Bank Index closed in the red. And most stocks, even if they stayed positive on the day, closed near the low of the day. Oh, but don’t fret, SpaceX was up as were the semis, and apparently that’s all that matters.
So after three up days, are we still oversold? Of course not. But we are not yet overbought. If Tuesday is a down day, I would expect the market to rally again. After all, even the options players could see today for the poor action it was, as the put/call ratio didn’t see a ton of puts bought, but certainly way more than Friday. The reading was .88.
We got a little bit of movement in the DSI’s for the indexes, as the Nasdaq is at 80 and the S&P is at 79. Neither of those readings tells us much. If Nasdaq rallies again tomorrow, it is possible we can see this metric head into the mid 80s, but it would have to be one heckuva rally to get it to 85.
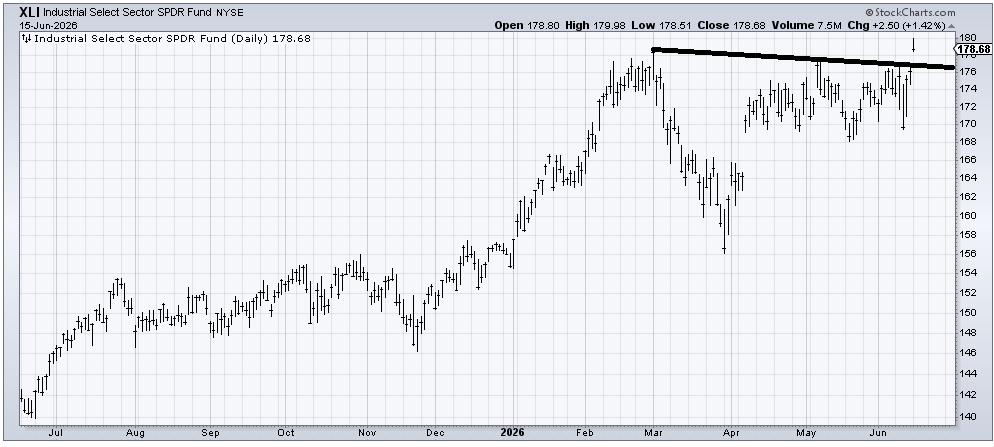
You can see XLI, an ETF to be long the industrials, a group I highlighted here yesterday, broke out on a nice gap up. But then closed on the low of the day. If it pulls back to 176 and holds, then that’s okay. If it gaps under 176, then it leaves today’s trading up there as an island. It’s charts like these that I will watch as the week progresses.
So, the bottom line is today settled absolutely nothing. And if you want to look at the bright side, I don’t think the action today got anyone terribly bulled up.
New Ideas
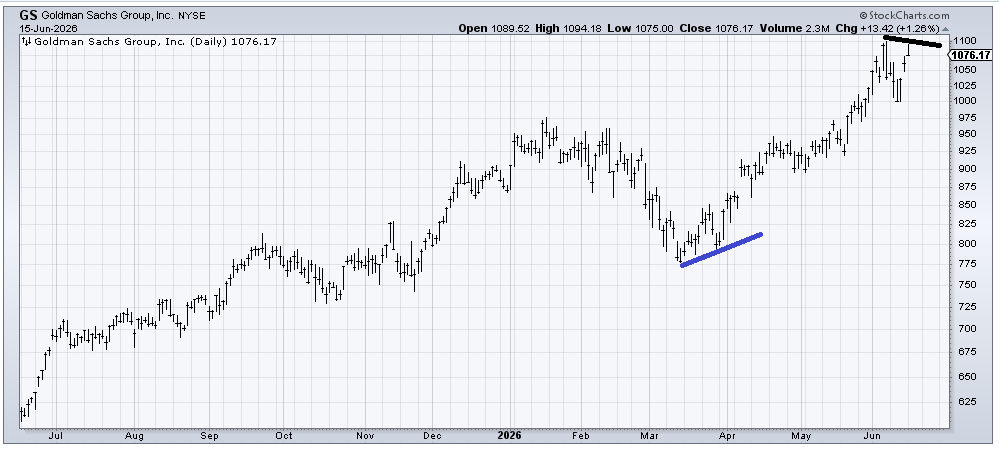
I’m going to keep my eye on Goldman Sachs (GS) because it couldn’t make a higher high today, and it closed on the low of the day. At the lows in late March, it was making higher lows, so a lower high now would have me concerned.
Today’s Indicator
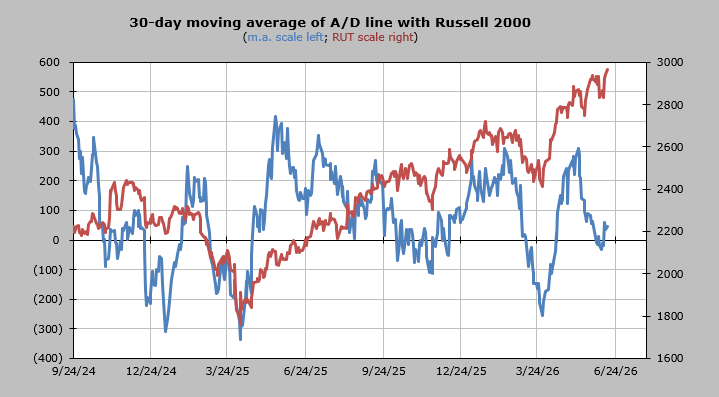
The 30-day moving average of the advance/decline line did not budge today (it ticked down fractionally). That’s because the intermediate term is not oversold. I do think it lifts tomorrow (based on the math), but mostly I’m not sure it is going anywhere special.
Q&A/Reader’s Feedback
Helene welcomes your questions about Top Stocks and her charting strategy and techniques. Please send an email directly to Helene with your questions. However, please remember that TheStreet.com Top Stocks is not intended to provide personalized investment advice. Email Helene here.
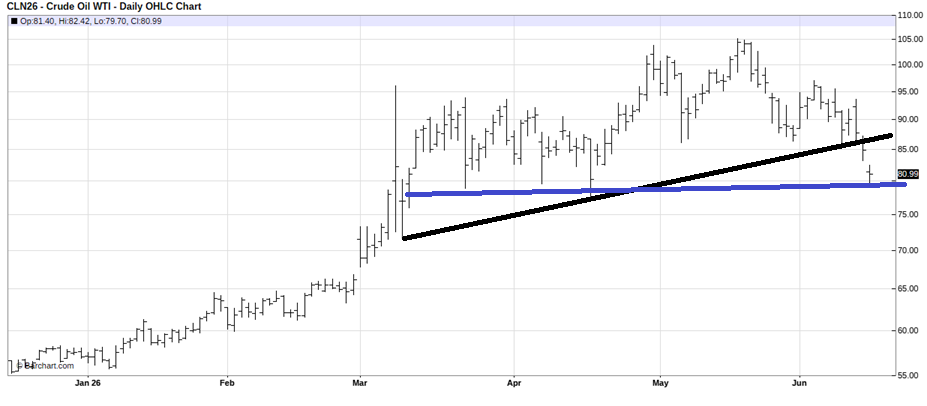
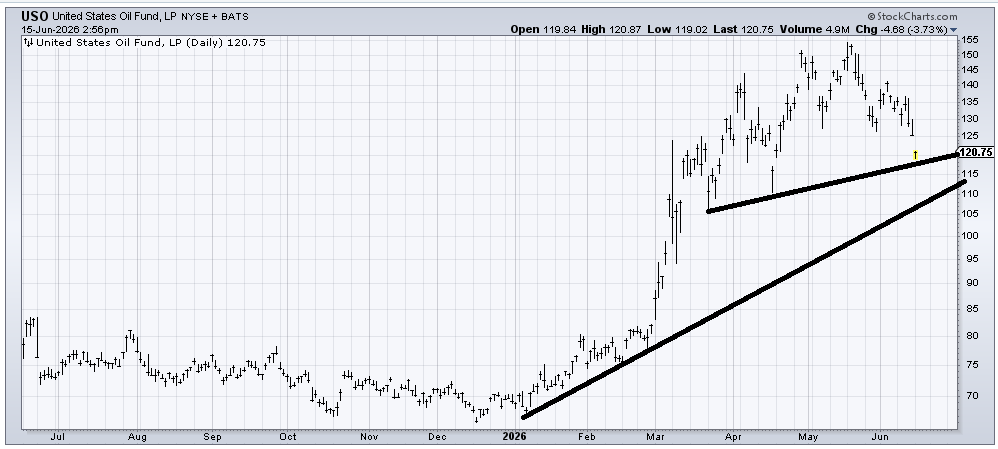
I have not liked the chart of USO (USO), an ETF to be long oil, or the chart of oil itself (WTI Crude) since back in late March. I am still not a fan. However, the fact that USO held that uptrend line is impressive. It still has higher lows.
You can see that WTI broke the line but seems to be holding 80 (blue line), which has been the area it has held since March. The DSI (30) is not low enough, or within striking distance, for me to have much confidence that the current oversold condition in USO or WTI will yield more than an oversold bounce right now. And I do think by the end of the week, they will both bounce.
Let’s imagine that we see a rally this week, and the next time down the DSI is low enough, I might find a reason to like USO/WTI again. But so far, that is not the case.
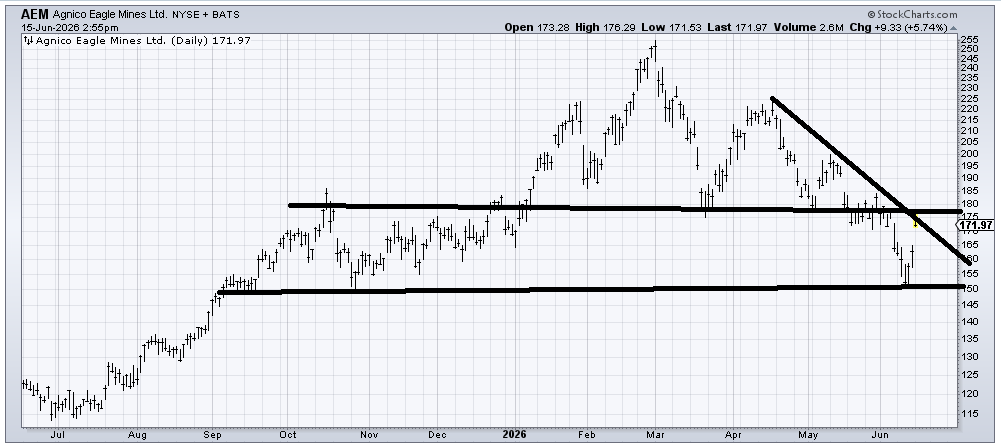
Agnico Eagle Mines (AEM) broke down from a head and shoulders top in May. IT measures to the 110-120 area. I don’t know if AEM will get there. For the time being, the bounce from last week (brought about by the low DSI reading) has run smack into resistance. I expect there will be some backing and filling now. So if you bought it last week, I wouldn’t argue taking a little off the table here. It’s possible this is now in a trading range.
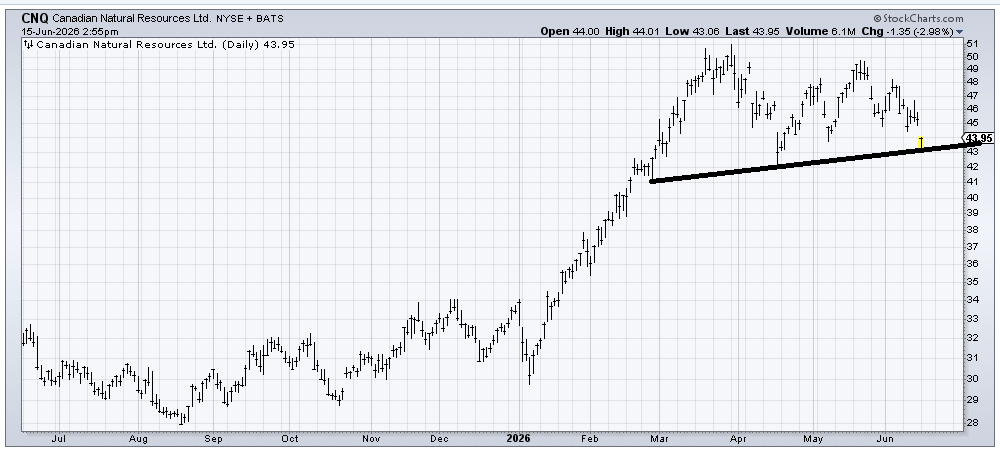
Canadian Natural Resources (CNQ) is a similar chart to oil/USO. It has held the low at 43 (uptrend line). You can buy it here with a stop under 43, but it feels a bit early to do that to me.
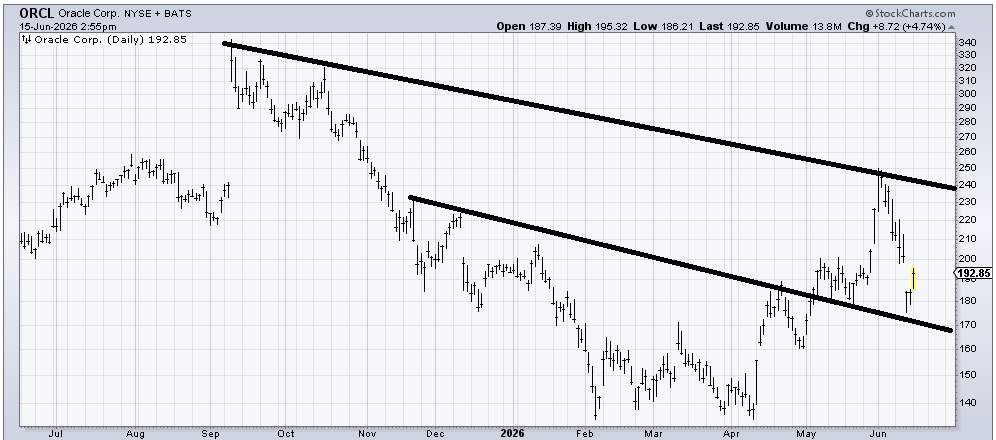
Oracle (ORCL), being a software stock, is mapping out as the Sentiment Cycle chart I showed here last week. So, I imagine it fills that gap around 200 and then does some chopping around. It’s in no-man’s land right now. But as long as 170-ish holds, the stock is okay.