This Is No Time to Stand Up and Run
Let's look at the indicators and see if we're getting into bounce territory. Plus, QQQ, KWEB, FXY, EWN, and EWQ.
You've reached your free article limit
You've read 0 of 1 free Pro articles.
The Market
I’ve got a lot of statistics for you today. So bear with me.
First, we did get a day with 90% of the volume on the downside. That tends to mean we should bounce.
Next, the VIX got jumpy with that run to 65. But admittedly, I thought it was jumpy on Friday as well.
The ISE call/put ratio fell under 1.0 for the first time since May 3rd. So we can say we’re finally seeing a bit of fear there. Keep in mind the 21 dma of this indicator has barely come down (that’s the intermediate-term situation)
The put/call ratio zipped right up to 1.29 which is quite high. It has taken the ten-day moving average to 1.03 which means we’re getting some fear in there too.
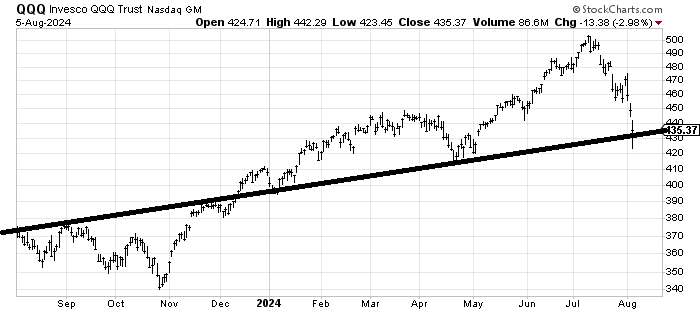
The volume for the QQQs reached 87 million shares. That is the highest volume since March 2023 during the SIVB crisis.
Then there are the DSI readings. Bonds are at 86. I maintain I think bonds are a bit overdone here. Notice the Utes, which I also thought were overdone after Friday, were down over two percent today.
The Yen, which has been cited as the culprit for today’s decline (yen carry trade; see below), finds its DSI at 87. This is the highest reading for the Yen since September 2017. Maybe there are a few more days left but keep in mind that the Nasdaq and S&P only got to the upper 80s in July; they never made it to 90+. Seems the move in the Yen is getting late.
The DSI for the Dollar Index is 15. So the USD is getting close to overdone on the downside as well.
Since I know someone will ask about the DSI for the S&P and Nasdaq: they are down but not yet into the territory that screams anything. The S&P is at 26 and Nasdaq is at 34. So sure a few more down days would get the S&P to be a teenager, but it’s got some room.
Then there are the new lows which soared. Nasdaq’s new lows are at 600 and the NYSE is at 220. We need to see that contract. The Hi-Lo for Nasdaq is at .50. Once again, not intermediate term oversold.
Yet so many indexes are now either just over or just under their 200 dma so short term I think we should see a bounce. But if someone fell off a building and survived it would take time for them to heal. Only in Hollywood do they get up and start running immediately. That’s the difference between the short-term (survive and stand up) oversold bounce and the intermediate-term (time to heal).
New Ideas
If you want to play for a rally, once again I would suggest the QQQs. For a trade only.
Today’s Indicator
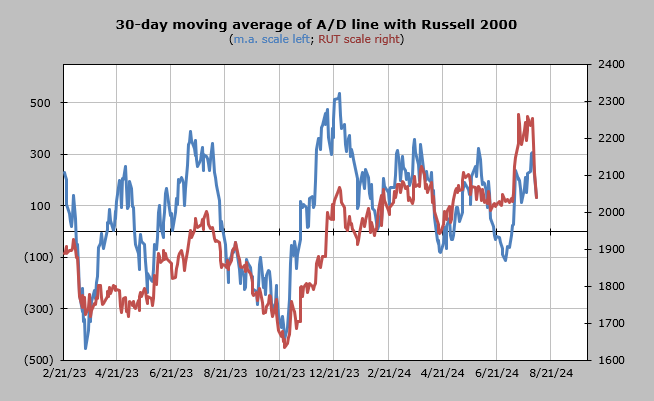
The 30 day moving average of the advance/decline line is still overbought.
Q&A/Reader’s Feedback
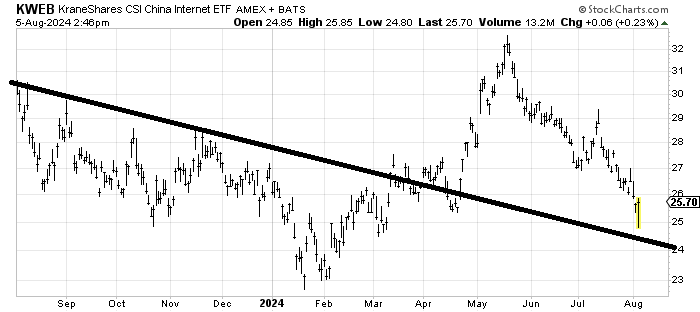
I was certain that KWEB would bounce off 27. I figured by the time it had gotten there from 32 we would have shaken out all the weak holders. And you know what I got? A bounce to 29 and then decimation. Can it rally from here? It sure can but if it gets to 27-28 I’d look to sell it.
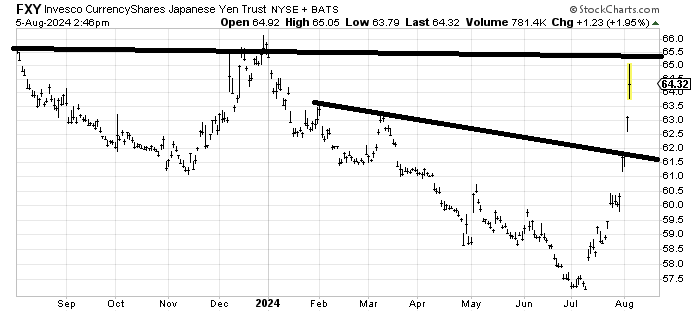
With the Yen carry trade being cited as the reason for the wild market moves these days I was asked about FXY, an etf to be long the yen vs the US Dollar (keep in mind most currency traders trade the pair as USD/JPY so they are long the USD and short the yen. It got to resistance in that mid 60s area. I can calculate a measured target in the 65-67 area so right now I would take profits if long FXY and look for a pullback in the next month or so toward the 62-ish area.
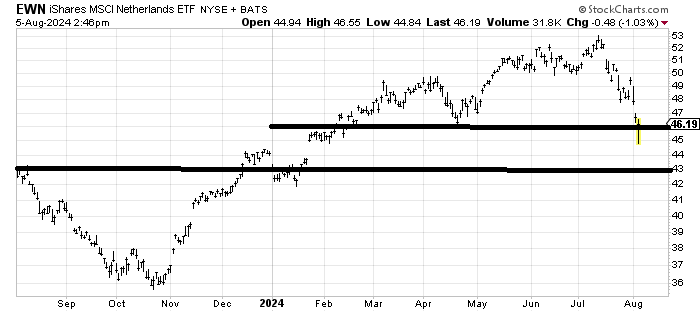
I would say the chart of EWN, an ETF to be long the Netherlands looks like it is missing the right shoulder of a head and shoulders top so I’d sell a rally to 48-49.
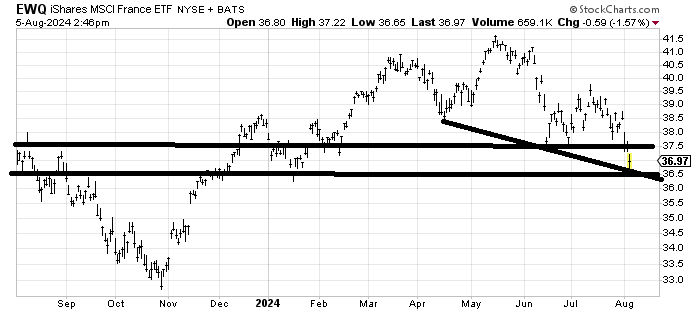
EWQ an etf to be long France looks like it is breaking down, although it has some support here. I would be inclined to sell a rally in the 38-39 area.