This Energy Stock Looks Like a Great Total Return Play
The shares have 'stair-stepped' higher from a low in early October, and pay a nice dividend.
You've reached your free article limit
You've read 0 of 1 free Pro articles.
Duke Energy DUK is a leading energy company focused on electric power and gas distribution operations. It pays a healthy dividend too.
Let's check out the charts and indicators of this utility to see if the stock can perform for us.
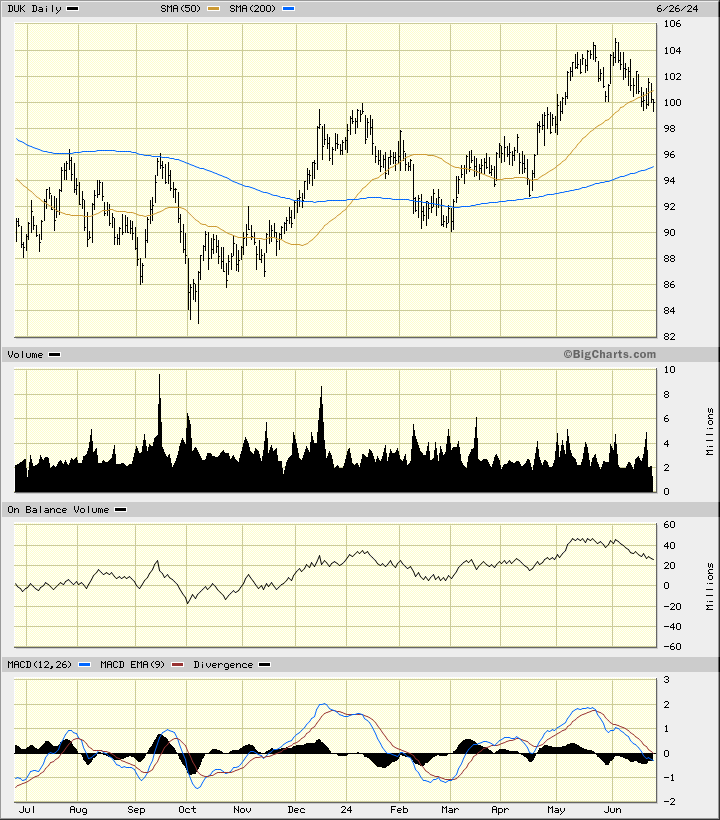
In the daily bar chart of DUK, below, I can see that prices have "stair-stepped" higher from a low in early October. Prices are currently trading below the 50-day moving average line but above the 200-day line.
The daily On-Balance-Volume (OBV) line has mirrored the action of prices the past year. The Moving Average Convergence Divergence (MACD) oscillator has been correcting to the downside and is currently testing the zero line.
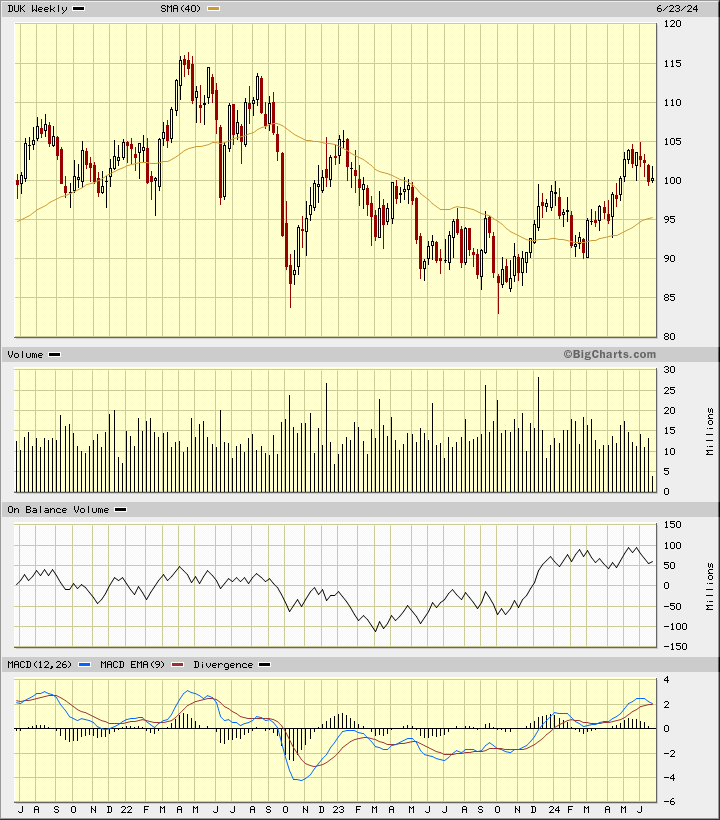
In the weekly Japanese candlestick chart of DUK, below, I see a picture with potential. Prices are trading above the rising 40-week moving average line.
The weekly OBV line made a low in early 2023 and advanced into February before turning sideways. The MACD oscillator is above the zero line but has narrowed significantly.
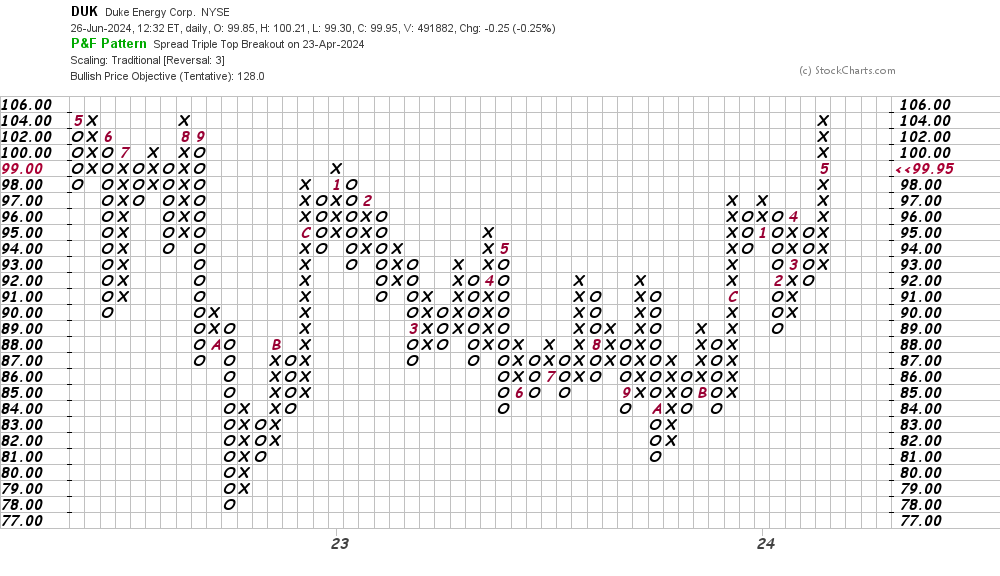
In this daily Point and Figure chart of DUK, below, I can see an upside breakout and a price target in the $128 area.
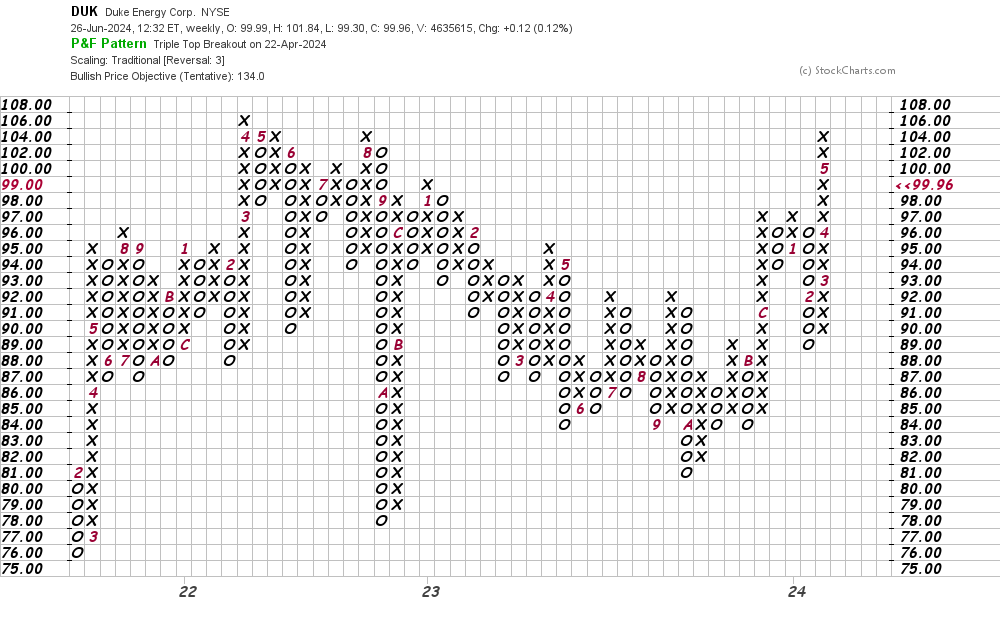
In this weekly Point and Figure chart of DUK, below, I can see a price target in the $134 area.
Bottom-line strategy: Traders and investors could go long DUK at current levels risking to $95. The $128 area and then the $134 area are my price targets for now. Capital gains and a healthy dividend make for a great total return.
Employees of TheStreet are prohibited from trading individual securities.