This Biopharma Stock Could More Than Double
The stock recently gapped higher and keeps on going.
You've reached your free article limit
You've read 0 of 1 free Pro articles.
In late May Insmed Inc. INSM surged on a late-stage win for its lung disease therapy. Insmed is a New jersey-based biopharmaceutical company that focuses on developing and commercializing inhaled therapies for patients with serious lung diseases.
Let's check out the charts and indicators.
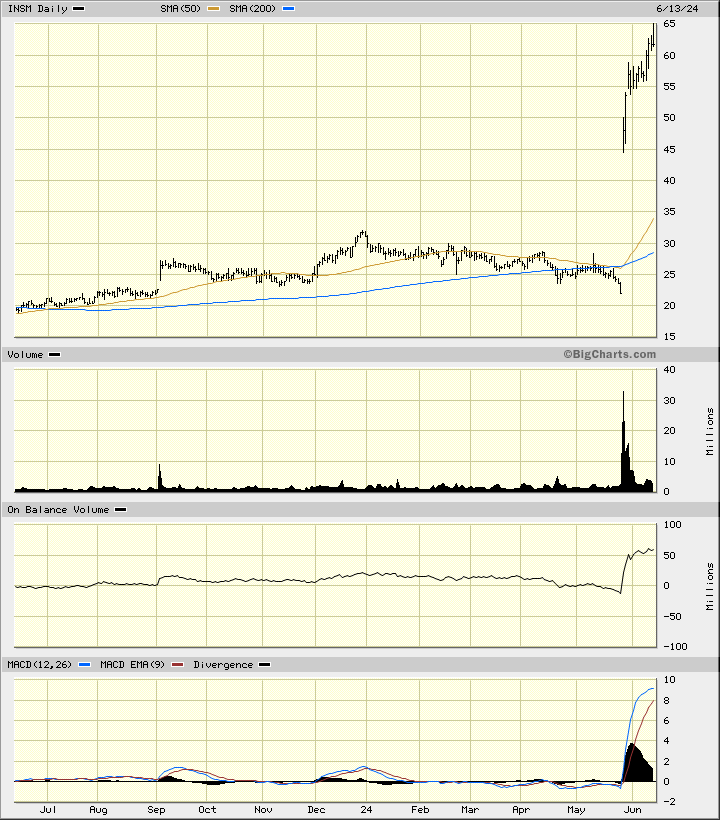
In the daily bar chart of INSM, below, I can see that share prices gapped sharply higher in late May. The shares jumped higher and are now trading above the rising 50-day moving average line and above the rising 200-day moving average line.
The On-Balance-Volume (OBV) line has surged higher. The Moving Average Convergence Divergence (MACD) oscillator has turned higher and is in a very positive move above the zero line.
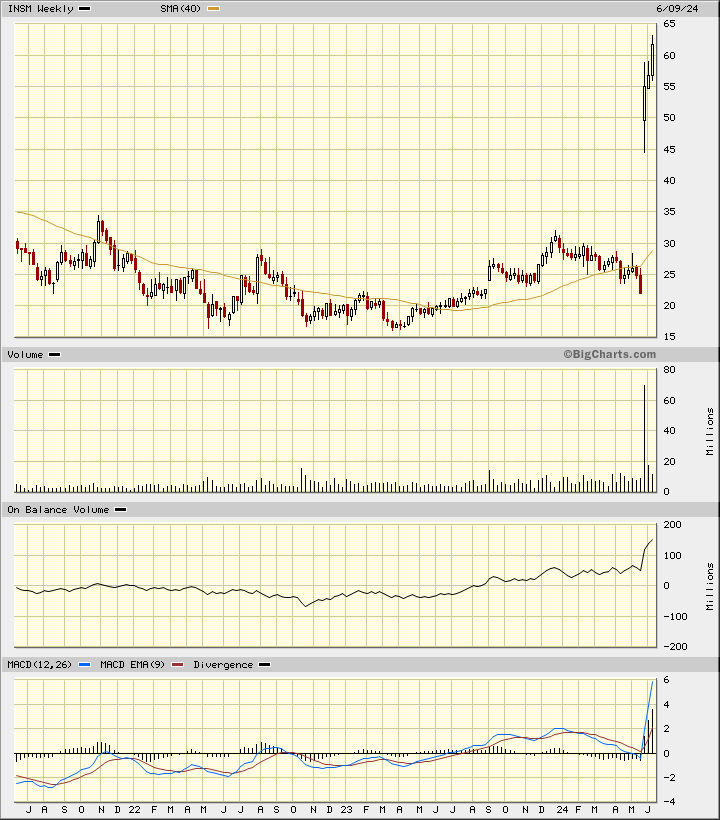
In the weekly Japanese candlestick chart of INSM, below, I can see that the shares were making a base pattern before the upside jump in prices in late May. Prices are trading above the rising 40-week moving average line.
The weekly trading volume has been quietly increasing. The weekly OBV line shows gains the past two years. The MACD oscillator is in a bullish alignment above the zero line.
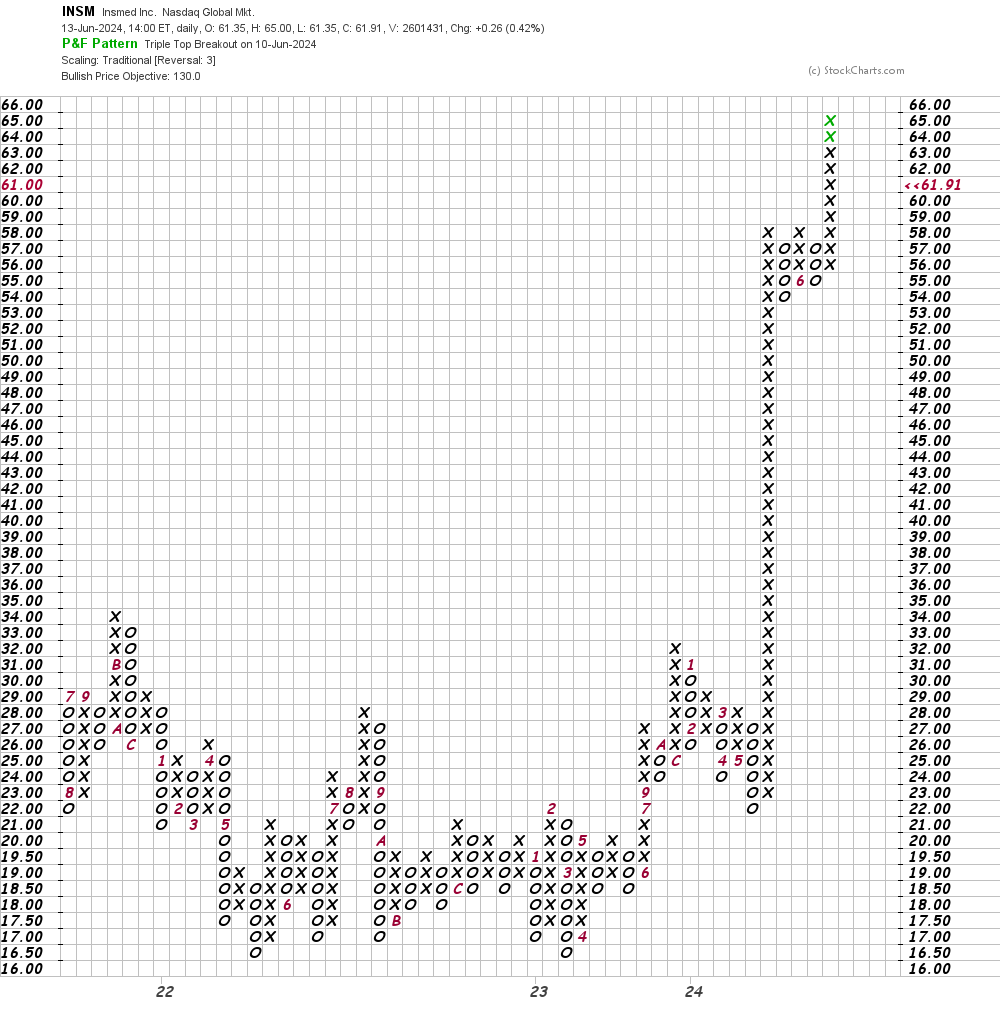
In this daily Point and Figure chart of INSM, below, the $130 area is my price target.
In this weekly Point and Figure chart of INSM, below, I can see a price target in the $130 area just like the daily chart above.
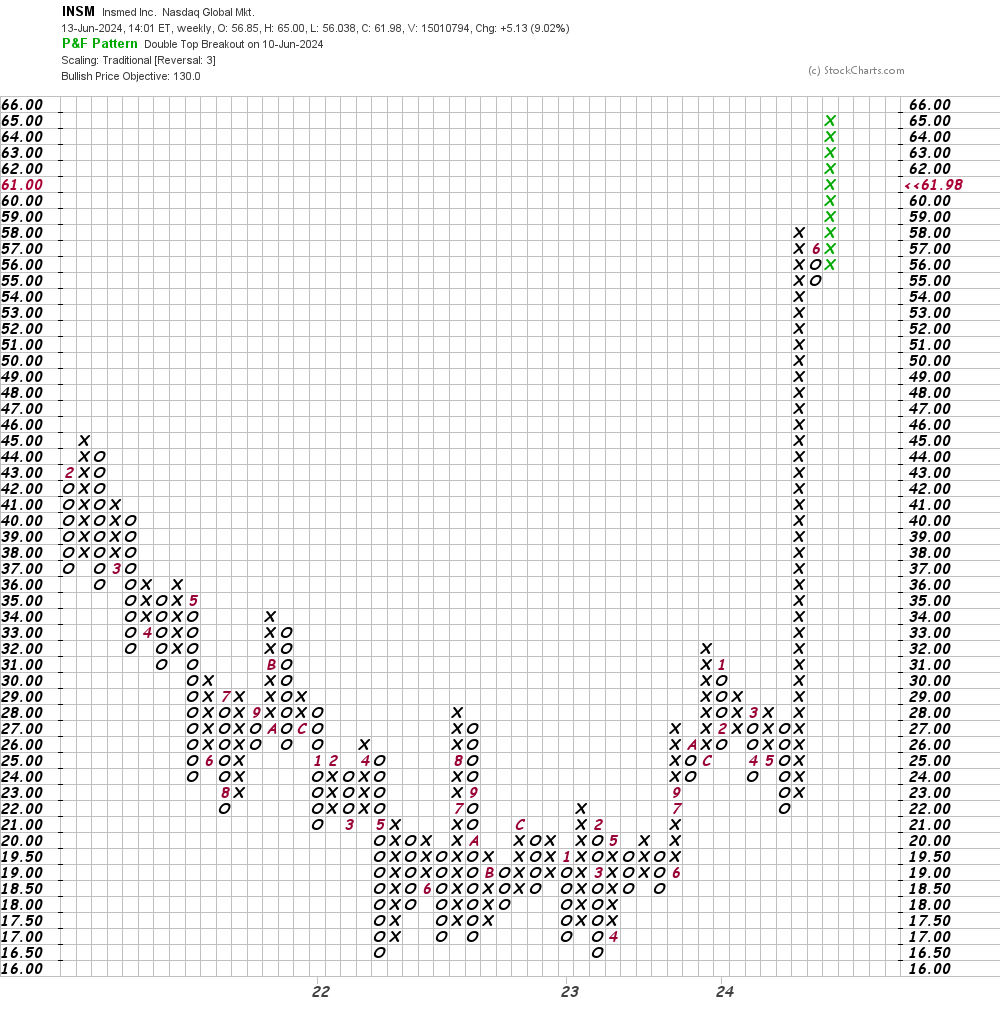
Bottom-line strategy: Traders could use a dip into the $60-$55 area, if available, to do some buying of INSM. Risk to $53. The $130 area is my price target.
Employees of TheStreet are prohibited from trading individual securities.