There's Weakness Beneath October's Strong Start
Sure, the S&P has hit new highs so far this month. But lots of individual names aren't following along. Plus, we'll take a look at TLT, IWM, CSX, ZS, AMD, MRK, and MS.
You've reached your free article limit
You've read 0 of 1 free Pro articles.
The Market
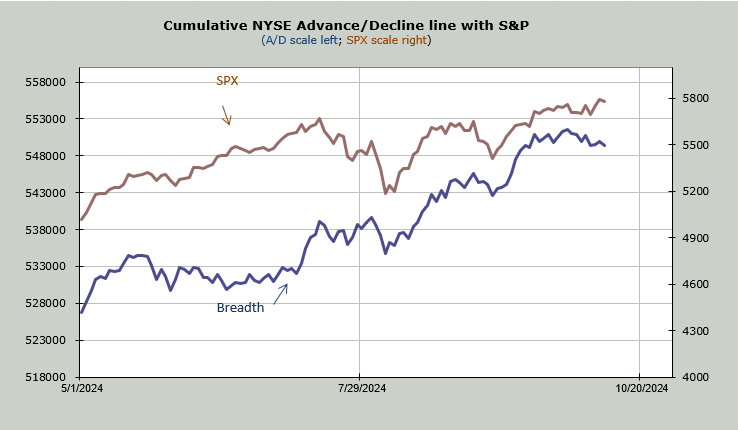
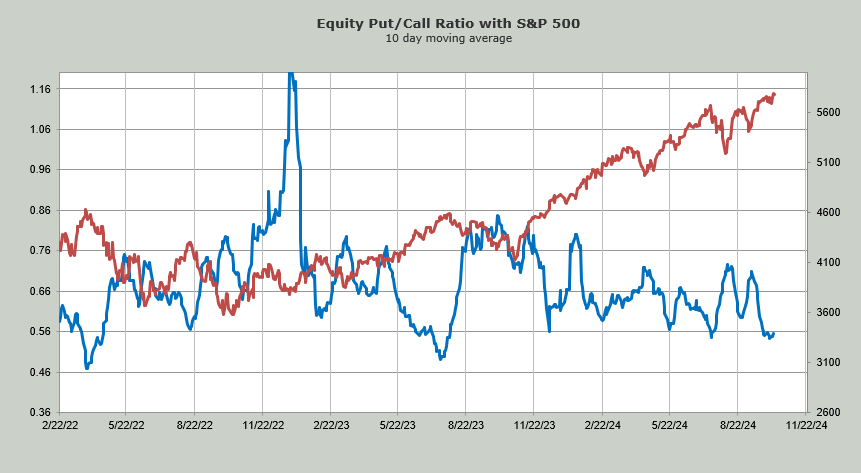
While I know we’ve had a couple of nice trades in the month of October, I have to report that the statistics are not great for the month. Oh sure, the S&P is up, but breadth has been trending lower. Up until October, breadth had been fine, it even led for most of the third quarter. But now, the blue line heads lower while the brown line (S&P) heads upward.
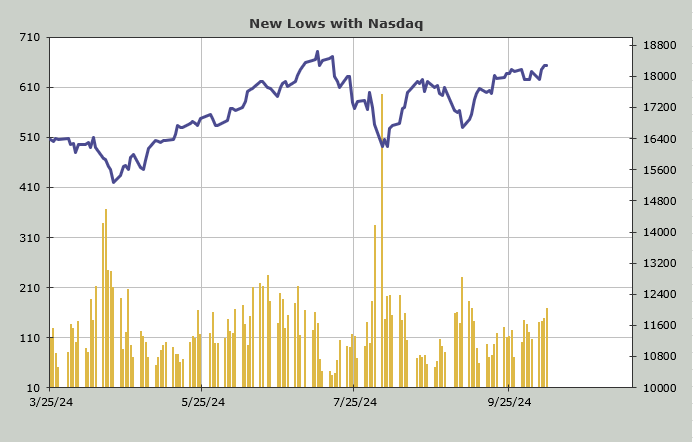
In the month of October, the number of stocks making new highs has contracted. The new high in the S&P this week had 163 stocks making new highs on the NYSE. Nasdaq is not much better, and today, Nasdaq had more new lows than new highs. In fact, in the month of October, there have been exactly two days with more stocks making new highs than new lows on Nasdaq. And today, we saw an uptick in stocks making new lows. Notice the upward move in new lows since the calendar turned to October.
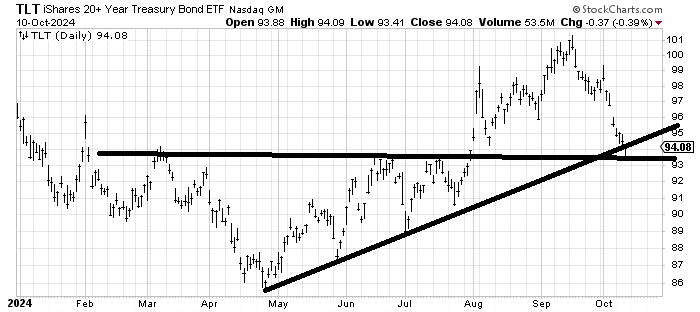
I am sure much of this has to do with higher interest rates, and you can see in October the slide in TLT has seemingly accelerated. Yet squint hard and notice that TLT closed at the high of the day. Right in this 94 area I have been harping about for weeks. I think bonds bounce.
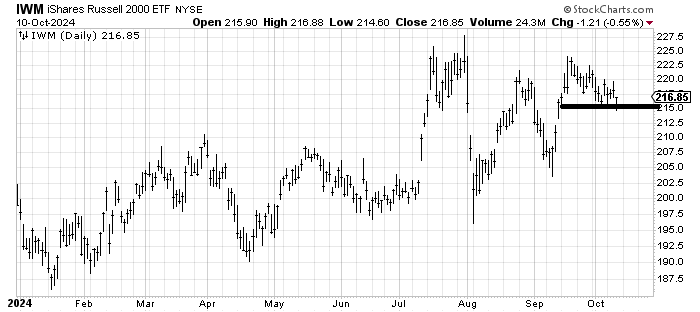
You know what else closed at the high of the day, oddly enough? IWM. And once again it bounced off 115. It’s just my sense that IWM is likely to bounce next week. You can see how awful the last month has been for it. If it cracks under 215 I am wrong because then it is gunning for that gap around 212.
Sentiment hasn’t changed, as it is still far too complacent and bullish for my taste. The DSI for the S&P and Nasdaq backed off to 77 (for both) but now the VIX is at 15. I am like a broken clock, but I repeat when the market refuses to have a proper correction, it is hard to get an upside in synch.
New Ideas
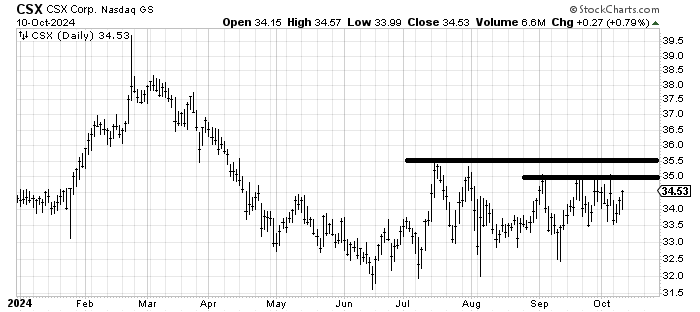
I am seeing some improvement in the chart of CSX CSX as it has been going sideways for nearly six months now. I’d use a stop under 33.50
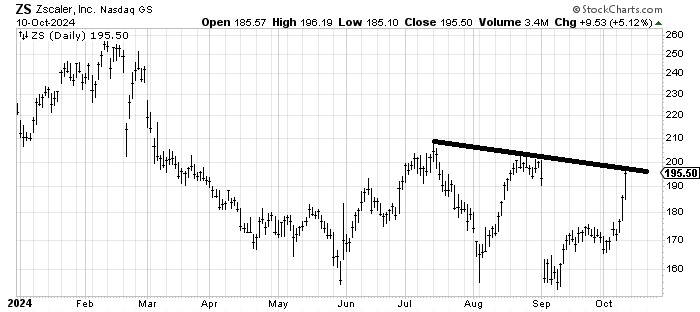
We got lucky with the move in Zscaler ZS, when I recommended it earlier this week because it filled that gap in two days, something I didn’t think it could do that fast. The chart is actually still okay, but with a move like that, I would take a few profits here to lock something in.
Today’s Indicator
The ten-day moving average of the equity put/call ratio is quite low.
Q&A/Reader’s Feedback
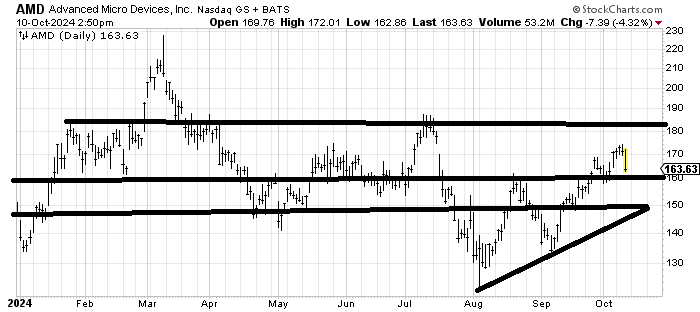
It is incredible when you sit back and realize that Advanced Micro Devices AMD has gone nowhere all year. It peaked in March, tried to rally this past summer and now, with all the hoopla over its new AI whatever it still can’t get to the summer high let alone the spring one.
It’s got some support here at 160, more down at 150. It wouldn’t surprise me to see it remain in this sideways pattern between 150 and 180 for a while longer.
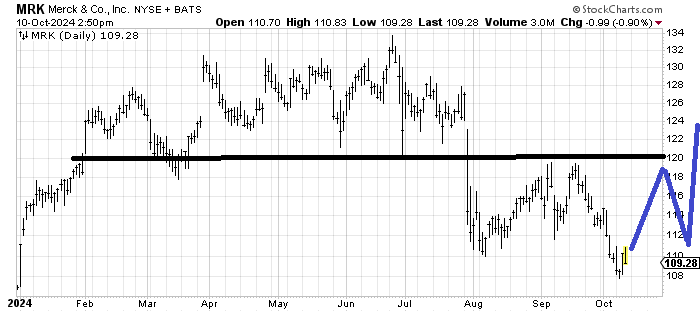
I have a few drug stocks I like but I have shied away from Merck MRK because it looks so different than the others. I mean, it is pretty much flat on the year, but not because it has spent the year basing. My guess is the recent decline is a bout of tax loss selling. The good news is that the top it broke down from measures into this 105-110 area, but unless/until I see a pattern set up, I don’t see a reason to buy it. If it can map out as I have drawn in over the ensuing months, it would improve the chart. Keep in mind the blue lines are the pattern, not the exact price I would look for.
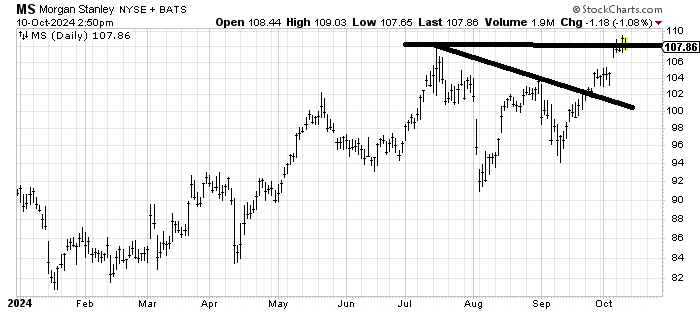
I suppose I am supposed to like the fact that Morgan Stanley MS gapped up and has held up there at the old high area. But if it is going to gap up, why didn’t it keep going? It’s not bearish but it’s hard to get excited over it here. There is an unfulfilled target in the 110-114 area.