The Tables Have Turned on Tesla
Didn't this used to be a buy-and-hold stock?
You've reached your free article limit
You've read 0 of 1 free Pro articles.
Shares of Tesla TSLA are slumping Tuesday after first-quarter deliveries for the EV maker missed already reduced expectations.
Let's plug in and check out the charts and indicators.
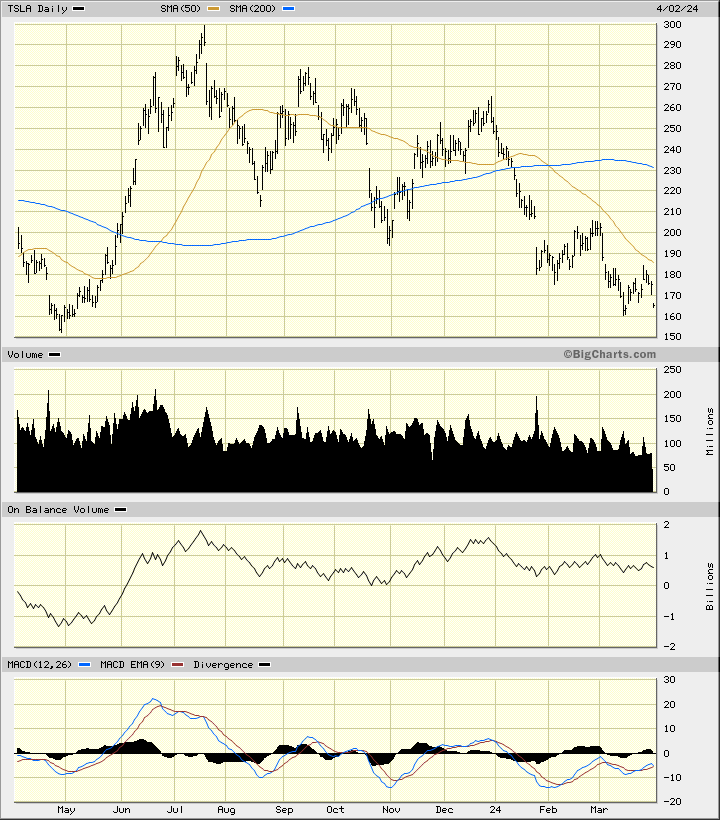
In the daily bar chart of TSLA, below, I can see that share prices have tumbled since July. TSLA trades below the declining 50-day moving average line and below the negatively sloped 200-day moving average line.
The daily volume histogram has been weakening since June. The On-Balance-Volume (OBV) line has struggled since July. The Moving Average Convergence Divergence (MACD) oscillator has spent most of its time below the zero line since August.
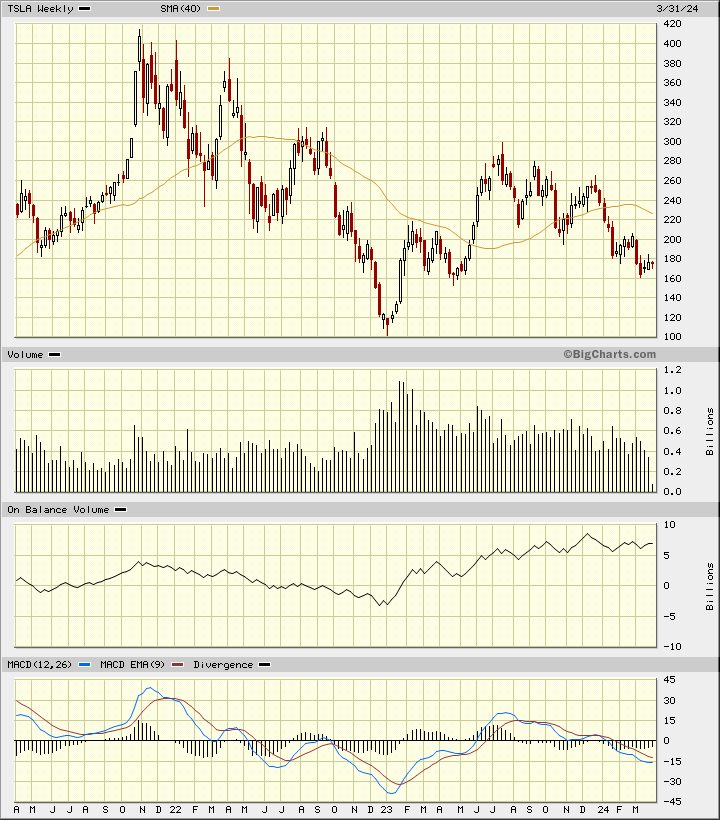
In the weekly Japanese candlestick chart of TSLA, below, I can see that share prices made a high back in late 2021. The shares have declined and trade below the negatively sloped 40-week moving average line.
The OBV line has weakened since December and tells me that traders are more aggressive sellers than buyers. The MACD oscillator is in a bearish alignment below the zero line.
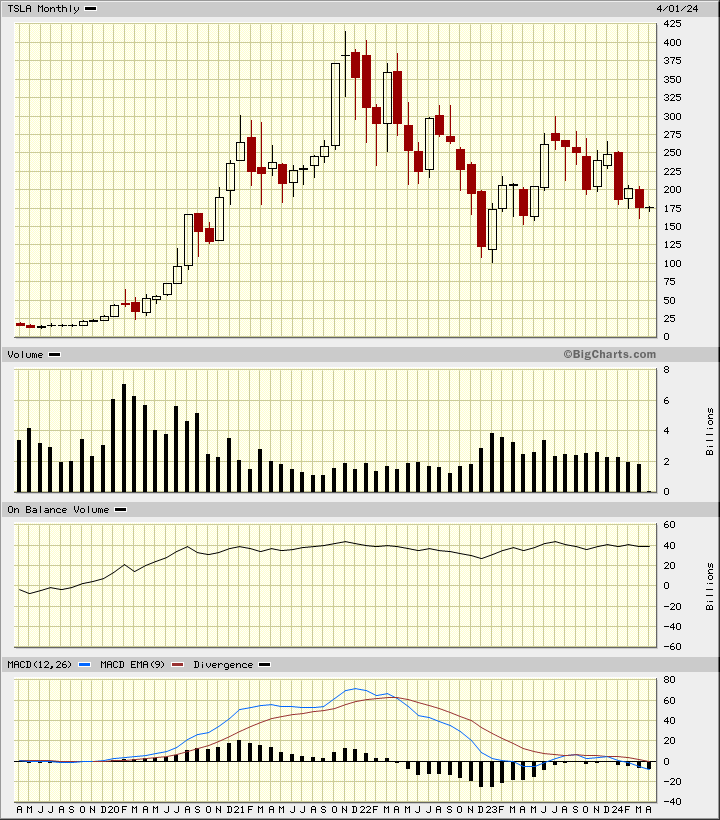
In this monthly Japanese candlestick chart of TSLA, below, I can see two lower shadows below $125. This tells me that traders rejected those lows but traders may not react the same way to these prices Tuesday. If we see much weakness below $125 this zone of buying interest (support) is likely to break and precipitate further declines.
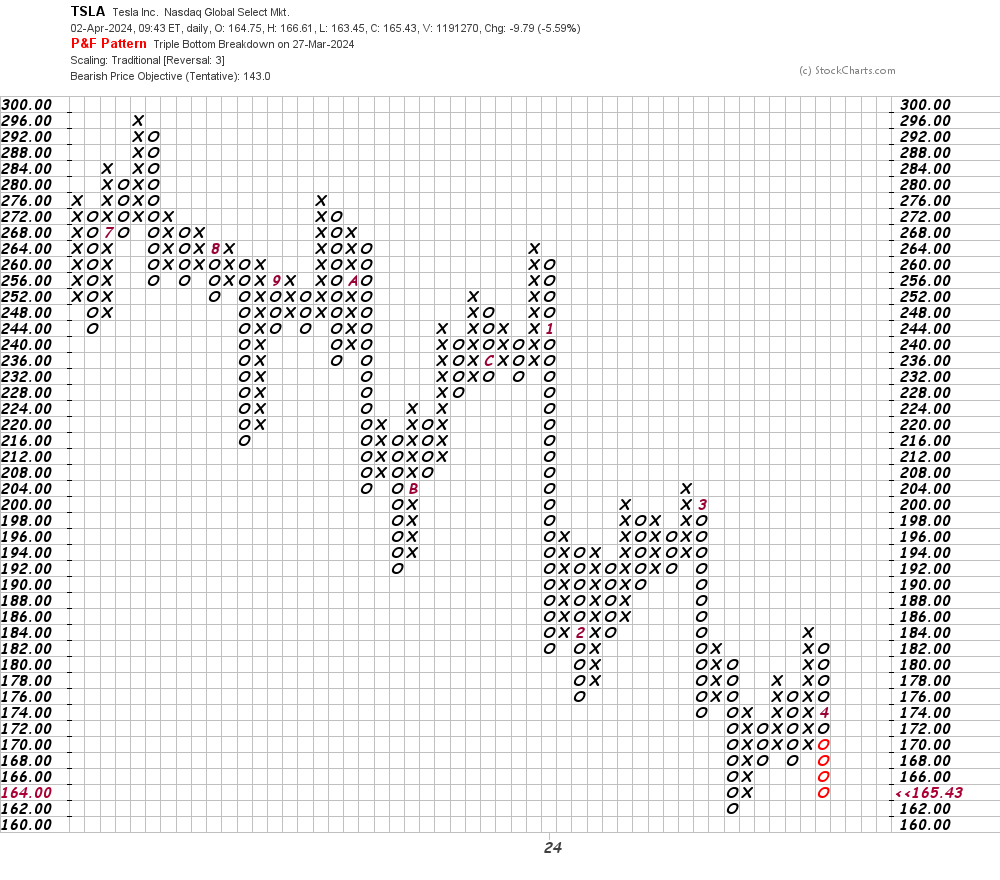
In this daily Point and Figure chart of TSLA, below, I can see a downside price target in the $143 area.
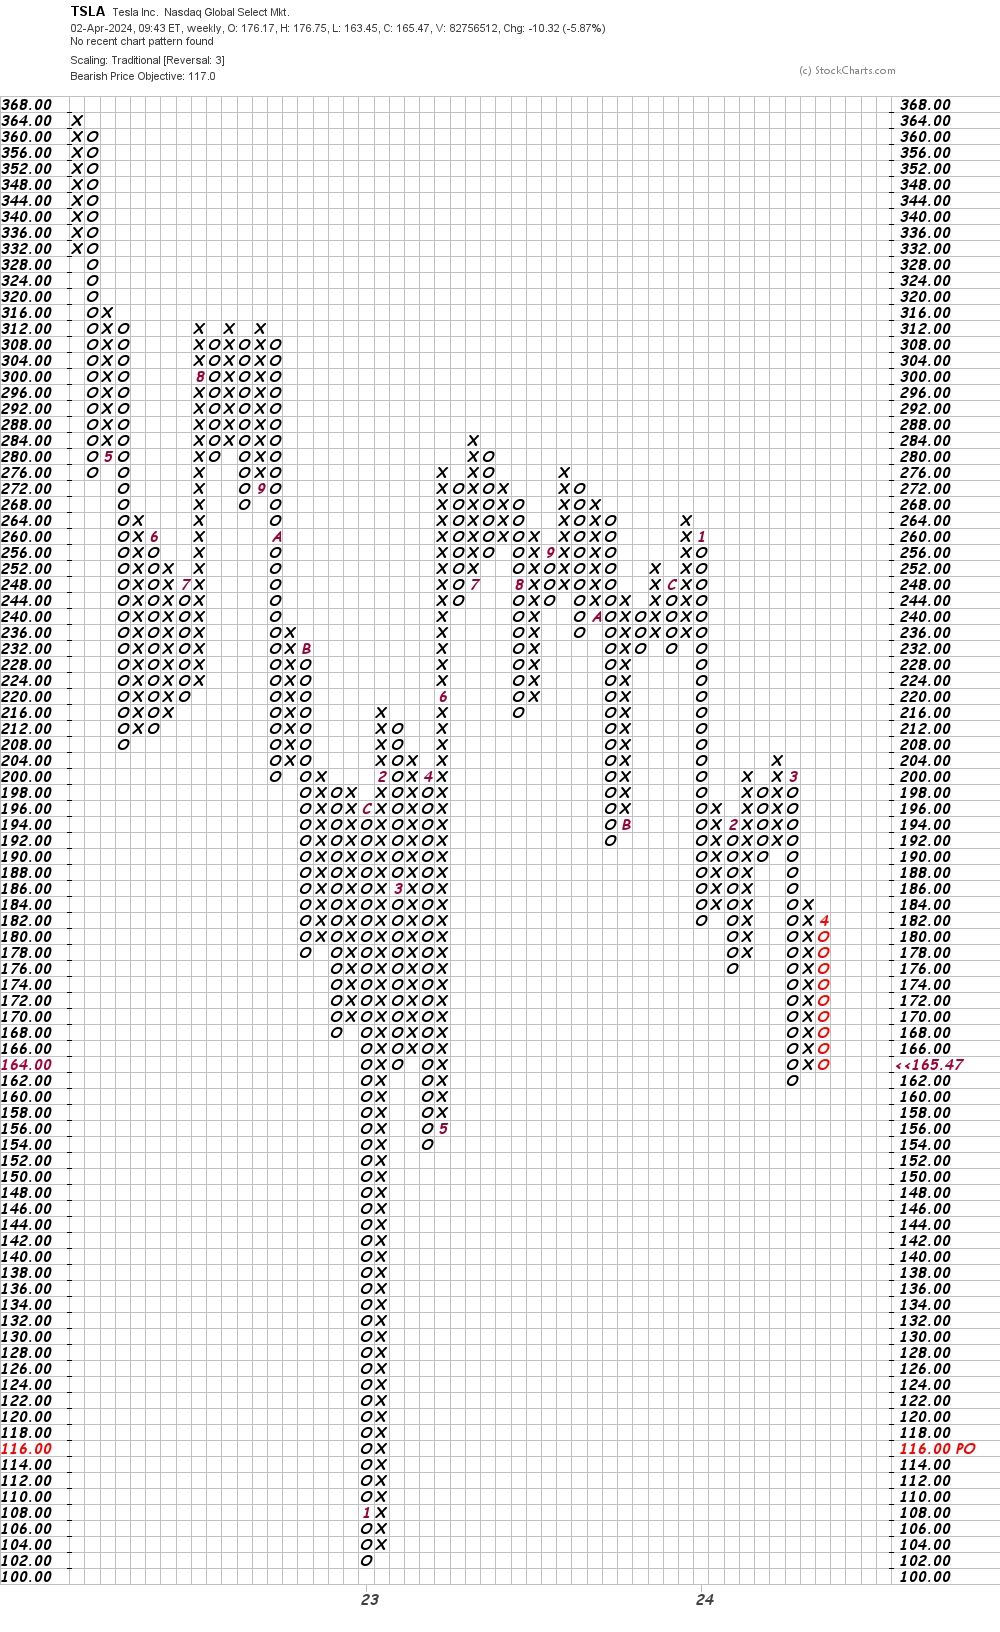
In this weekly Point and Figure chart of TSLA, below, I can see a potential price target in the $117 area.
Bottom-line strategy: TSLA used to be considered a buy-and-hold stock but now the tables are turned and it looks like a "sell on any bounce" stock. Avoid the long side of TSLA as further declines are anticipated.
Employees of TheStreet are prohibited from trading individual securities.