The Question Is, Did Last Week Take Care of the Overbought Condition?
Let's take a look at the indicators today to see what might come next. We'll also look at PFE, PG, META, VLO, and CYBR.
You've reached your free article limit
You've read 0 of 1 free Pro articles.
The Market
Since my timing was way off last week, believing we would get one more rally (and we did not), the question is if last week took care of the overbought condition. Using my own metrics (Oscillator, Momentum Indicators, ‘what if’ for the Summation Index), the answer is no.
Keep in mind I look back to see what I envision going forward. For example the Oscillator is based on the ten-day moving average or the net of the advance/decline line. So for us to be oversold I look for a string of negative numbers to be dropped. When I look at the week ahead here’s what I see to be dropped: six straight days of positive breadth readings. I can’t make that oversold no matter how hard I try.
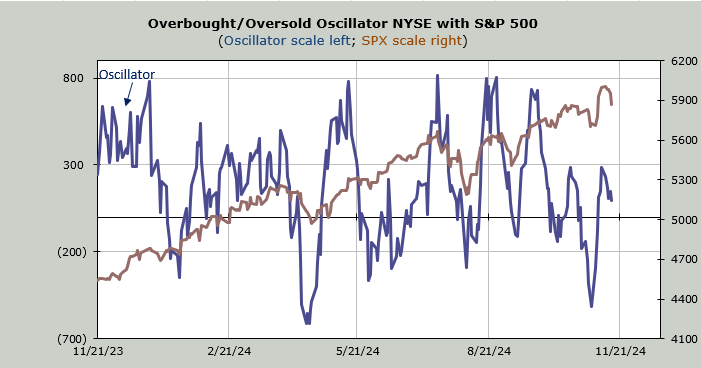
The only way that can become oversold—using this metric—is if we replace, say, Monday’s number of +530 with +530 or better. But that’s the smallest number of the week so we’d have to keep improving on that the remainder of the week to get the Oscillator to lift.
I’ve done the calculation for the Nasdaq and Russell Momentum Indicators, and they aren’t even close to turning back up, having only peaked last Thursday. The ‘what if’ for the McClellan Summation Index is the closest since it needs +2200 to stop the decline in the indicator. That means net breadth of +2200 on Monday will change that indicator. Usually oversold means it needs +3000 or greater.
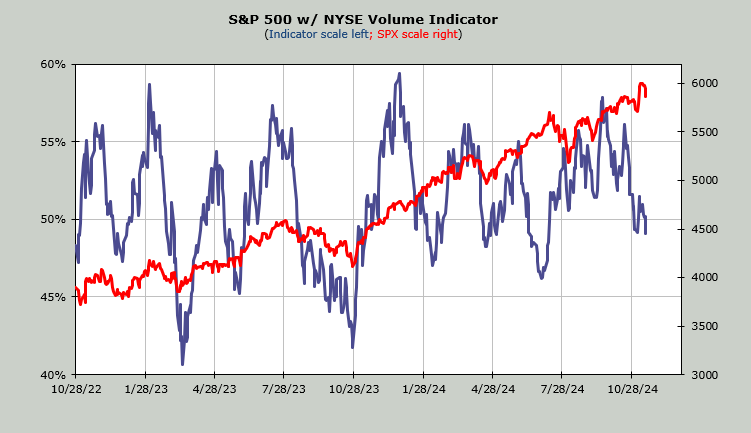
There is one indicator that is nearing an oversold condition and could get there this week. It is the Volume Indicator which now resides at 49%. At 47% that steps a toe into oversold territory.
But let me step away from that for a minute and show you some longer-term sentiment indicators. I should begin by noting that despite last week’s decline, I have seen no signs of panic stepping in. Heck, we couldn’t even get to a put/call ratio over .90 (Friday’s reading).
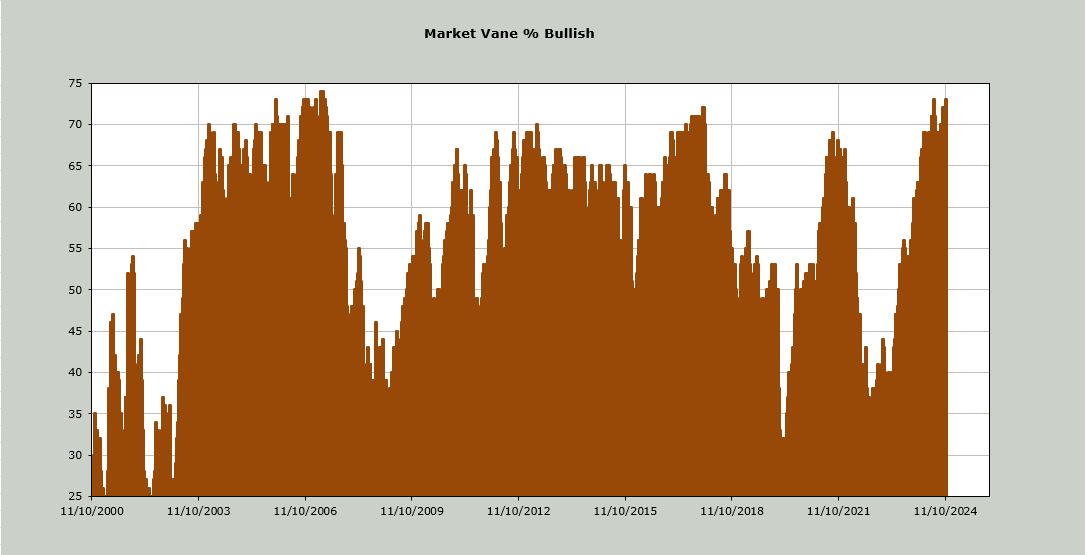
The Market Vane Bulls are now at 73. In July at the high, they were at 72. The last time they were up here was April 2007. Now let me note that the market had a rocky ride from April through October 2007 so April was not the high, and it can stay up here for a long time, but typically that needs to back off –even in July, we saw it dip back to 68. In other words, it doesn’t speak of an extended, multi-month rally.
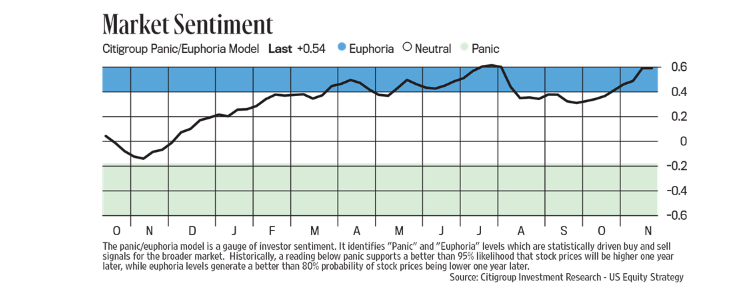
The Citi Panic/Euphoria Model is now solidly back in Euphoria, again, where it was in July.
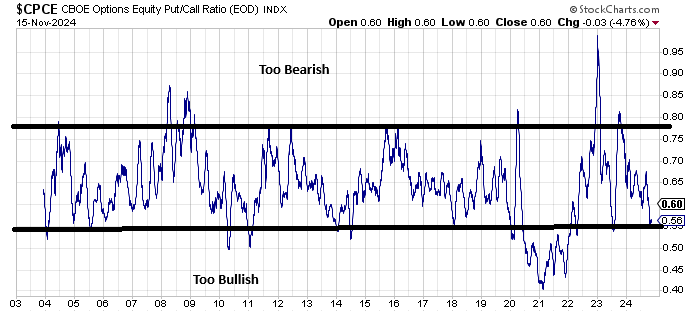
Then there is the 30-day moving average of the equity put/call ratio. Last week we looked at the ten day moving average, noting that it had barely shown any sign of fear heading into the election. The 30 dma is sitting near the low end of the range. It is possible it opts to do what it did in 2020-2021, which means get down under .55 and stays there for an extended period but that looks more like an outlier than typical.
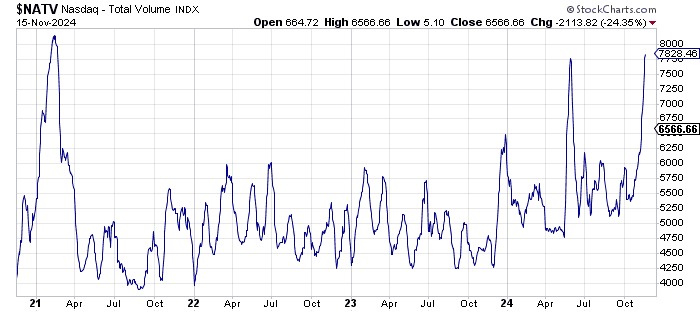
Speaking of 2021, I have noted in recent weeks the return of meme stocks. Nasdaq volume has been exploding upward. It has been doing so without most of the Mag 7 joining the move. I take that as a lot of speculation, especially when we do not have a commensurate rise in NYSE volume. Here is the 10 dma of Nasdaq volume. The 2021 peak is there (all those SPACS and meme stocks) and curiously a peak this year in May (when the Russell lobbed off five percent while the Index movers gathered steam). In other words, this is generally what happens late in the rally, not early.
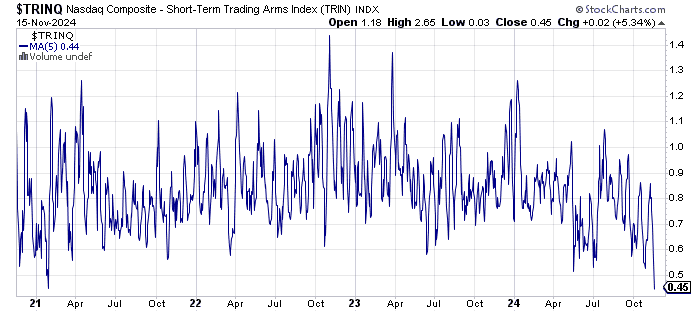
To show you this Nasdaq volume another way. We know the advance/decline line on Nasdaq is not terribly reliable but the net volume (up minus down) on Nasdaq has gotten out of control. So not just total volume but up vs down. In the last ten days net volume on Nasdaq has been negative only twice and Friday was the second day. That means Nasdaq’s TRIN (the relationship between up/down volume and the advance/decline line) on a five day moving average is now as low as it was in January 2021 when all that speculation was going on.
Year end is always a tricky time, especially when the market has been up all year, it tends to want to maintain that ‘up-ness’ into year end. I would like to see some panic rather than complacency.
New Ideas
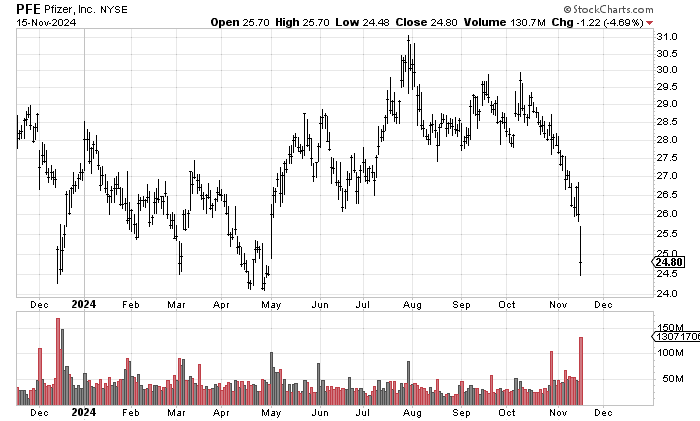
I believe it was sometime in the last week where we looked at Pfizer PFE and I noted that it would probably have some year end selling and maybe test the prior lows around 24-25. I did not think it would come about in the manner it has. This is a support level and that volume on Friday was quite high (not as high as December 2023). I don’t know if the dividend is secure (currently yielding over 6%) but I imagine a stock like this should bounce this week.
I do want to note that many of the defensive names (not drugs though) were up on Friday. Staples and Utes rallied. The DSI for the bonds is down to 14. I am going to watch this group to see if they can improve.
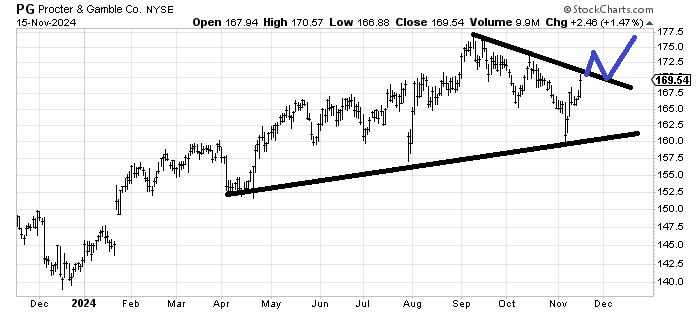
For example can Procter and Gamble PG cross that downtrend line and map out something akin to what I have drawn in blue?
Today’s Indicator
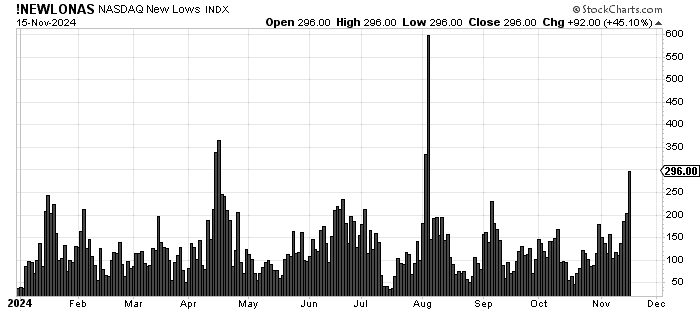
Both the NYSE and Nasdaq saw new lows increase on Friday. Nasdaq had just shy of 300 new lows.
Q&A/Reader’s Feedback
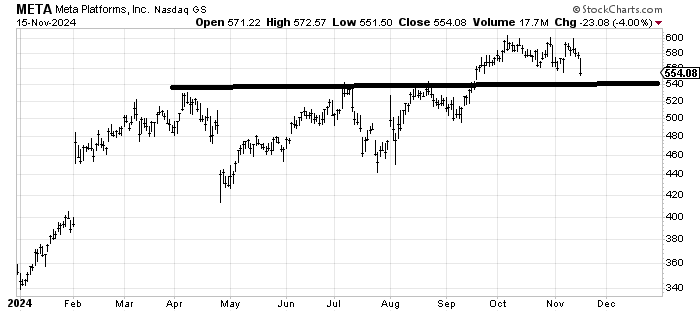
Meta META looks like it is trying to form a top but it’s not that large so for now I expect if it comes down into that 540 area we will see it bounce. I’m just not sure how far it can go but first let’s see if we can get that bounce.
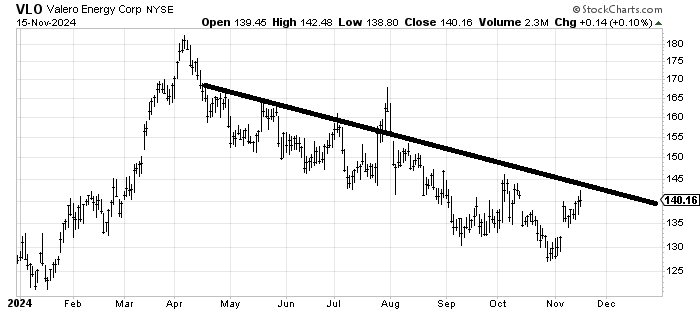
The line I have drawn on the chart of Valero VLO would probably be laughed out of any lesson on Technical Analysis but with the exception of that false breakout in late July it has stopped every rally since the downtrend began. I am drawn to a stock like this because it is down and out and it has held that gap up so well. I would like to see it cross that line and maintain that. There is a lot of resistance all the way up but maybe it develops and improves as we head into 2025.
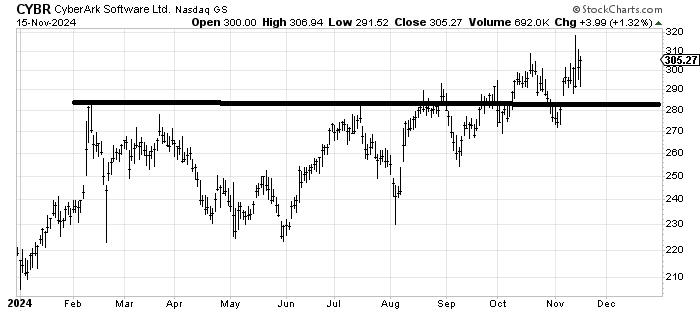
Cyberark CYBR is a decent chart even if it is up so much already. It has a measured target around 330 as long as it doesn’t break under 280 in a meaningful way.