The One Chart Screaming That It's Late in This Rally
Perhaps sentiment is changing. We'll look at the charts. As well as QCOM, BIDU, GT, BOOT, and CVNA.
You've reached your free article limit
You've read 0 of 1 free Pro articles.
The Market
Well that was a dull day in the market. I would have thought after a four-percent, five-day decline in the IWM, we would have seen more pep in the step of the small caps.
But hey, bonds finally found a day of calm and green. If I am correct about the bonds (so far, I have been wrong) holding down here, then maybe the deterioration we’ve seen over the last month can fix itself.
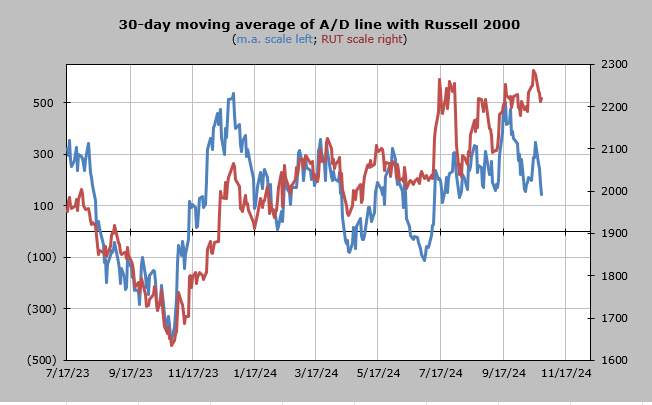
Take a look at the 30-day moving average of the advance/decline line. Each time it has gotten to this general level, we’ve seen a bounce. Only the September bounce (into the high) had any momentum (blue line). Now, since this is the 30-day moving average of the a/d line, we look back thirty trading days ago to see what numbers we are dropping. There are still a lot of green numbers to drop until after the election.
However, in the next two trading days, we will drop the two largest positive numbers. On Friday we drop +1948 (net breadth) and Monday we drop +1200. Unless the market soars tomorrow, for some reason, it’s likely that whatever number we get for breadth, even if it’s positive, will not be more than +1948, thus that blue line should fall. If we get a negative number, imagine the plunge that line will take.
I highlight this because if we can get this down under the zero line it would be the first time since June. And I do hope you will recall that in late June/early July, the set up was for those others to rally. And they did. So, I say we should cheer some downside for the next few days.
Heck, the AAII Bulls are already down to 37%, so this week has changed some of the sentiment.
New Ideas
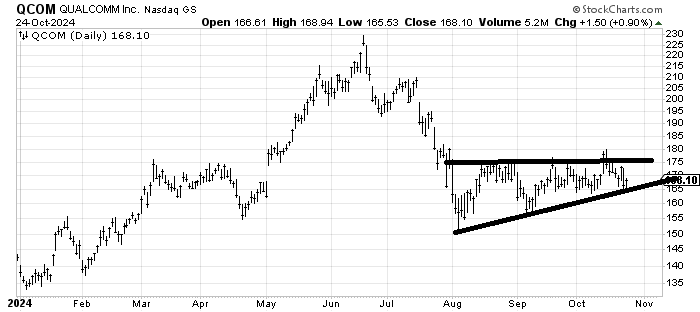
I was asked about Qualcomm QCOM a few weeks ago, and I was non-plussed. Heck, the stock hasn’t done anything since August, and it is the same price it was in March. But if the stock can hold this line, it would be a positive.
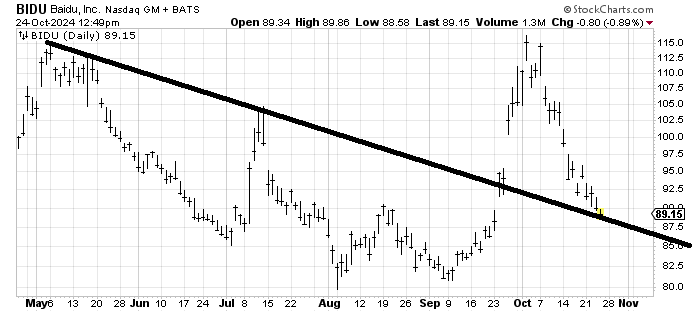
Someone asked me about Baidu BIDU recently and I wanted to follow up by showing this line because it also closed that gap at 89-ish today. I still think it’s a pretty ugly chart now but it is getting oversold enough that it should at least bounce.
Today’s Indicator
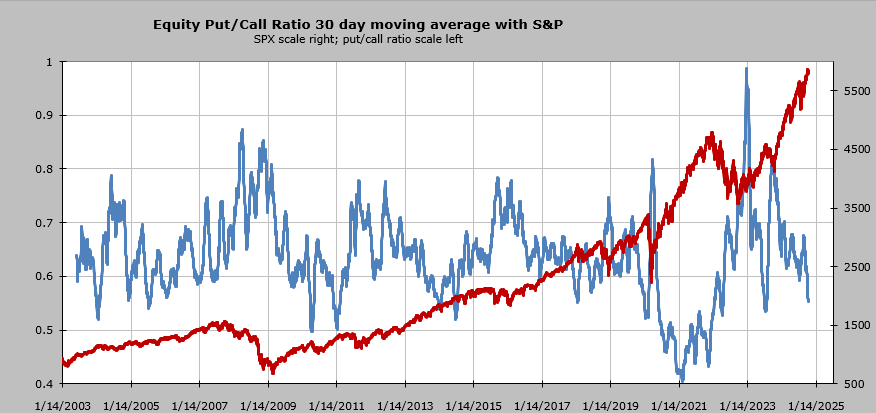
If I had one chart that screamed, ‘We’re late in this rally,’ it would be the 30-day moving average of the equity put/call ratio. Here it is dating back twenty years. The current reading is .55. It got to .54 in July 2023, and you can see that each time it has gotten into this general range, it has been a problem for the market. You can’t see the sell-off in 2004, but it was there. The reading at .50 in 2010 was just before the Flash Crash in May.
So it’s not fully extreme yet, but it is close. My guess is a good whack in the market would reset it with a move higher.
Q&A/Reader’s Feedback
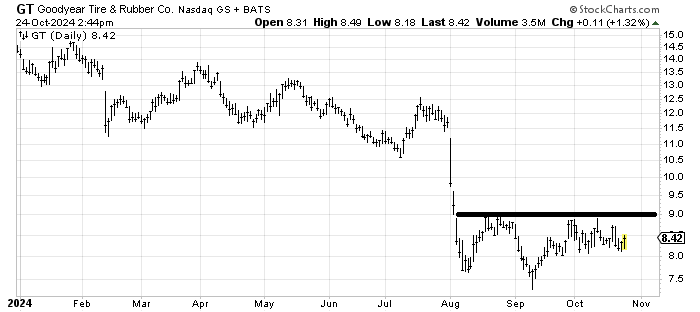
Down and out charts have not been working lately and there have been so many landmines in the market that it hasn’t helped to bottom fish. Yet I look at the chart of Goodyear Tire GT and I think if it can hold over 8 and then get over 9, that would be a nice trade to resistance. But mostly, that base is pretty small, so a stop under 8 is necessary.
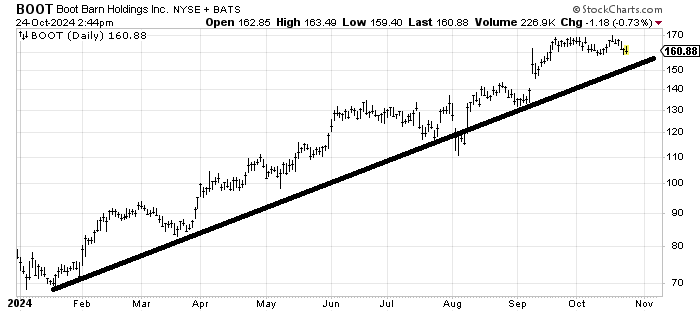
Boot Barn BOOT hasn’t done anything wrong yet, so as long as it holds 155-ish, I would call the stock a hold. I would get concerned if the market gets to an oversold condition and rallies, and this can’t get over 170.
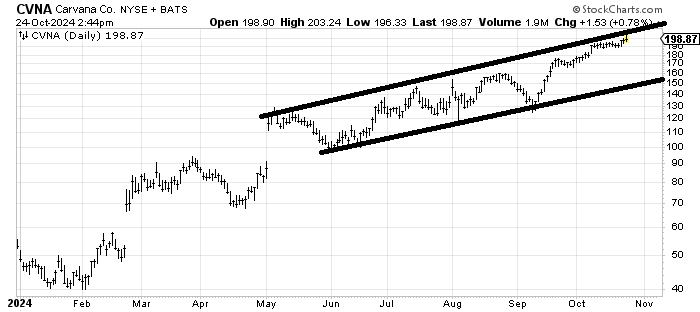
Carvana CVNA hasn’t done anything wrong except hit the top of the channel. I wouldn’t buy it here because I don’t chase stocks that are up like this but the worst I can say about it is it is stretched on the upside.