The Last Mile Before a Bottom Is Often a Rocky Road
Let's look at sentiment for clues to a market bottom.
You've reached your free article limit
You've read 0 of 1 free Pro articles.
 NYSE traders
The Market
Just a week ago, I discussed what I termed ‘the last mile’ when it comes to sentiment. To me, it is that it tends to be relatively easy for the DSI to go from 40 to 20, but that last ‘mile’ to go from 20 to single digits takes a lot more in terms of a decline.
I think there are reasons for that. Think how someone would think that a 7% decline is enough, so they are not going to give up and get negative at that point. It typically takes something scarier to change their view.
Last week, the S&P was down quite a bit (2%), but the Russell 2000 was up on the week. Did the diverging moves change sentiment? Yes and no. For example, the DSI for the S&P is now at 15 (it was 22 a week ago), and Nasdaq is at 14 (it was 25 a week ago). Many of the other sentiment indicators had a similar shift—toward more bearishness, but not extreme.
So the question is, must we get an extreme? We don’t have to. But let me list for you some of the indicators that are close to getting extreme but not quite finished with that last mile.
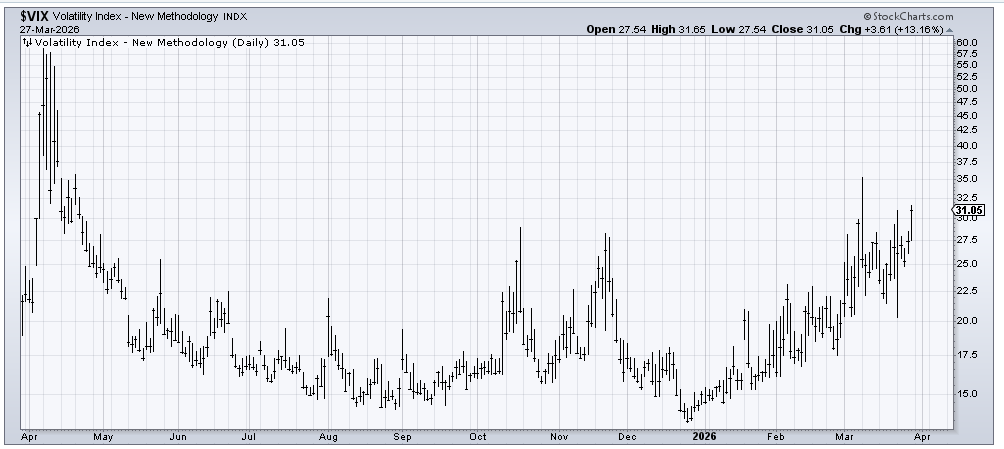
The aforementioned DSI. I like to see at least one of the indexes (Nasdaq or the S&P) get to single digits. In April last year, Nasdaq got to 9, and the S&P got to 10. Let me also note that the VIX’s DSI is currently 77, which is really high for that instrument (rarely does this get to 90).
Sticking with sentiment, it is possible that this coming Wednesday, we will see a marked change in the Investors’ Intelligence survey. I always prefer more bears than bulls (taking the bull/bear ratio under 1). The current ratio sits at 1.57, so while it has come off the boil (when it was 4.2 in early February) I would not call this extreme. I doubt we can get a ratio under 1.0 this week, but we can get close.
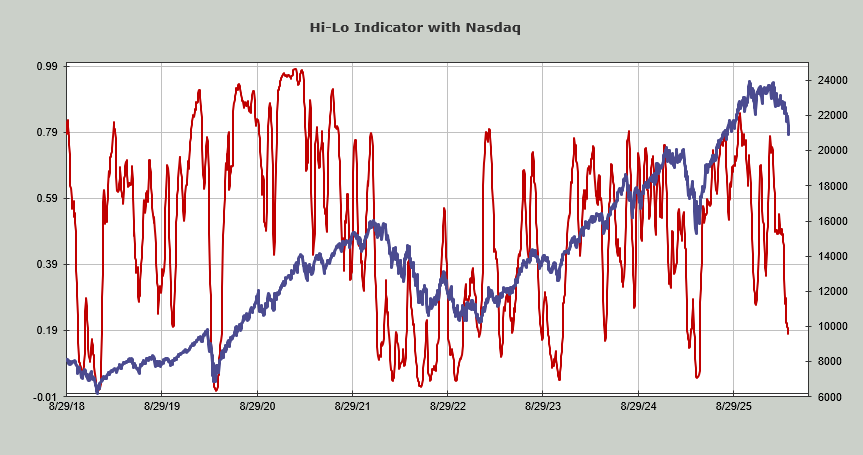
I like to see the VIX get jumpy. Look at the chart; it is just poised, sitting there, waiting to break out and get jumpy. It just needs to get pushed over the edge, so to speak.
For some of the indicators, we have the Nasdaq Hi-Lo at .18 so it is now oversold (shown below). The NYSE’s Hi-Lo Indicator is still at .35. So that needs a push down to get oversold (there is the divergence between the big cap and small cap indexes; see above where the S&P lost 2% last week but the Russell was up).
The Volume Indicator, since we have had down days with around 65% of the volume on the downside, thus, nothing extreme, sits at 48%. 47% is oversold in a bull market, the low 40s is where we tend to get in a bear market. So here too, it’s close but no cigar.
The 30-day moving average of the advance/decline line continues to point toward an oversold condition around mid-month (April).
Anecdotally, I have been waiting for the Wall Street firms to lower their price targets for the S&P, and we have seen none of that. In fact, last week one of them actually raised their target! But late last week, we did see Citigroup lower their allocation to stocks. Thus, we’re getting somewhere.
The first two days of the week will give us the end of the quarter, followed by Wednesday, which is the first day of a new quarter, often an up day in the market. The timing of the end of the quarter rebalancing could be a factor.
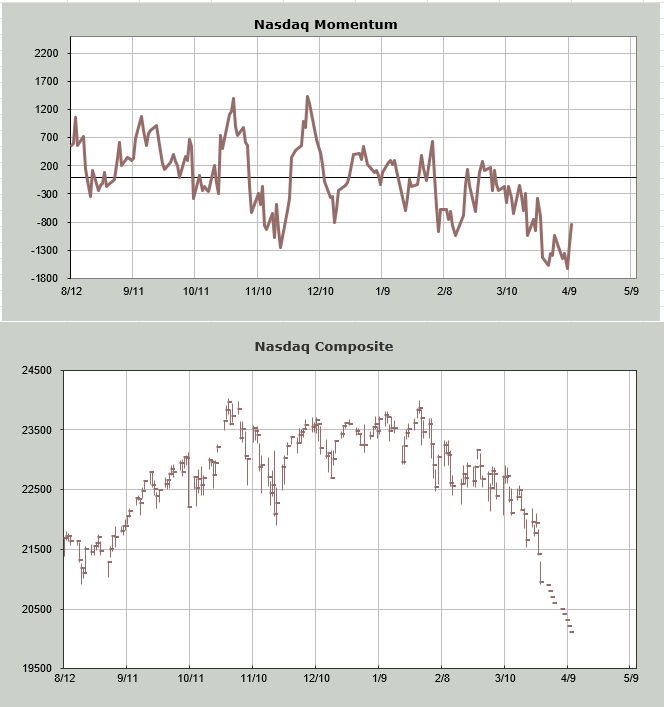
You may recall just over a week ago, I did a ‘what if’ exercise for the Russell Momentum Indicator, showing that the Russell would get oversold but not Nasdaq. Now I can finally show you that if I walk Nasdaq down about 1000 points over the next ten trading days, we finally see it oversold using this methodology. The indicator goes up even if the price goes down.
Keep in mind this is not exacting on the day/date, it is meant to show a general time frame, and that time frame is somewhere between midweek this week and midweek next week.
The bottom line is I’d like to see us go that ‘last mile’ but sometime in the next week or two, I would expect we’ll have enough of the indicators lined up to get a decent rally.
New Ideas
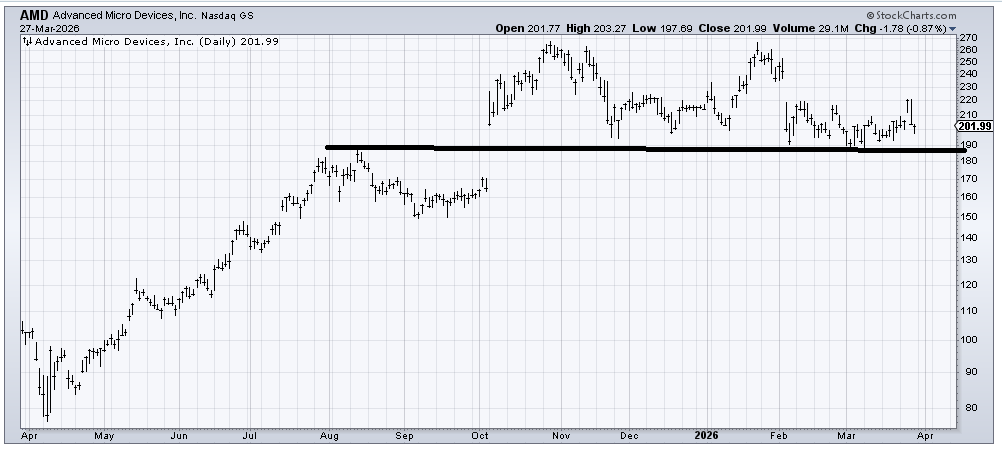
Once again, I want to revisit the three semi charts I have been monitoring. NVIDIA (NVDA) did break 170 on Friday, but recall I widened the support to 165. I thought we’d see some hysteria over the break of 170, but I did not sense we did.
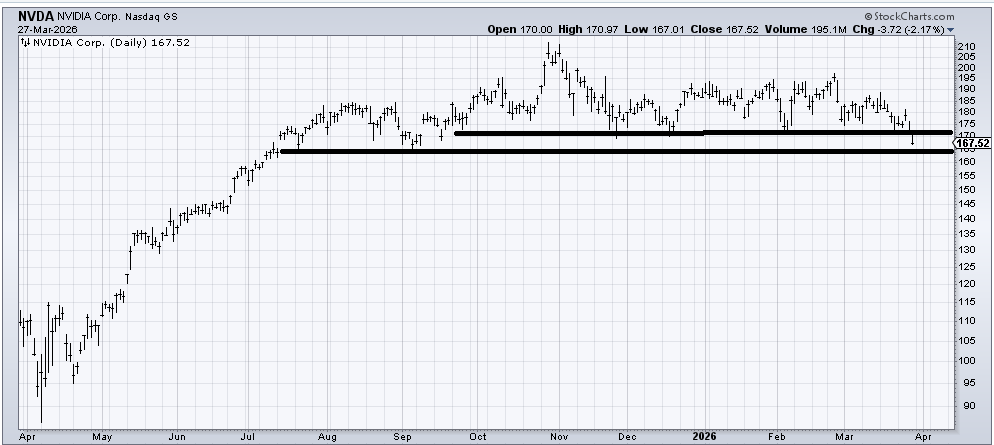
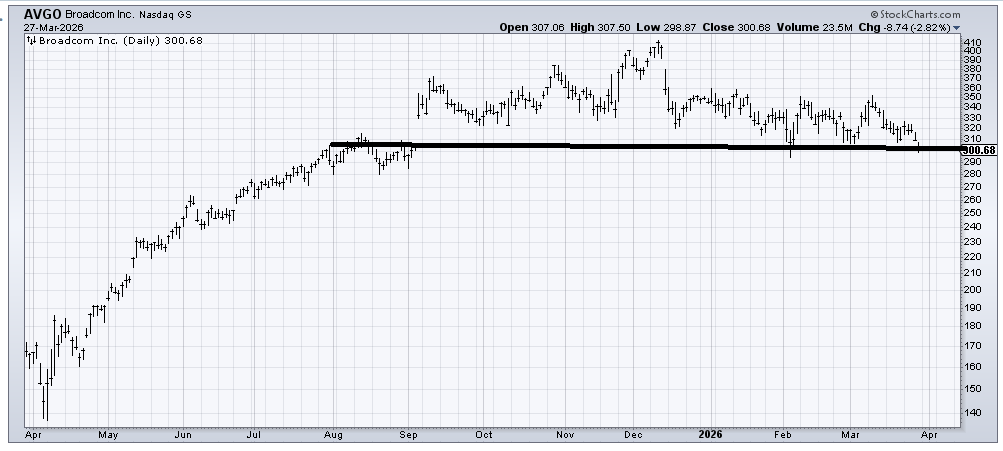
Broadcom (AVGO) continues to hang by the proverbial thread. I believe a break in these stocks would go that last mile. I should also note they are both tops, so while a panicky break would be bullish for a trade, it would not be bullish on an intermediate term basis unless they can recapture these levels in a hurry.
Advanced Micro Devices (AMD) is actually acting better than the other two, with its breakdown still 15 or 20 points lower.
Today’s Indicator
The Hi-Lo Indicator is discussed above.
Q&A/Reader’s Feedback
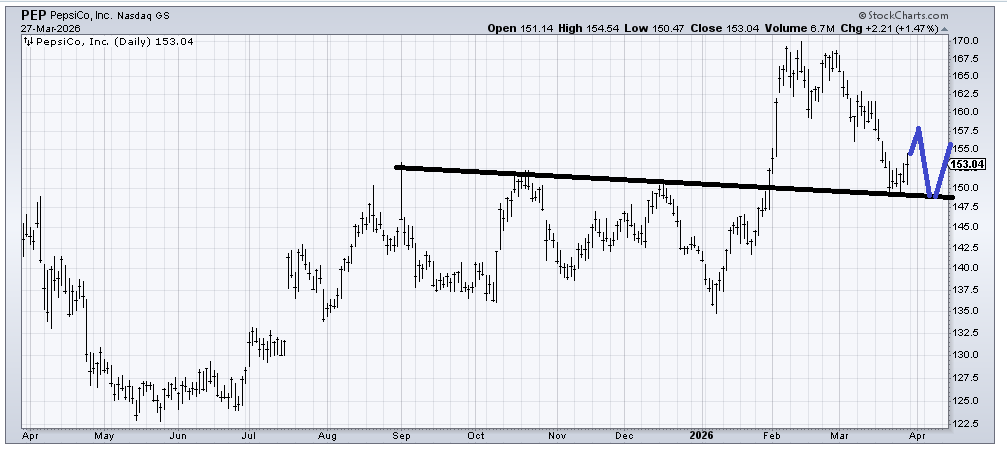
The question is if it is time to revisit Pepsi (PEP) . I’d say this 145-150 area is probably the right price, but my guess is it maps out something like I have drawn in blue.
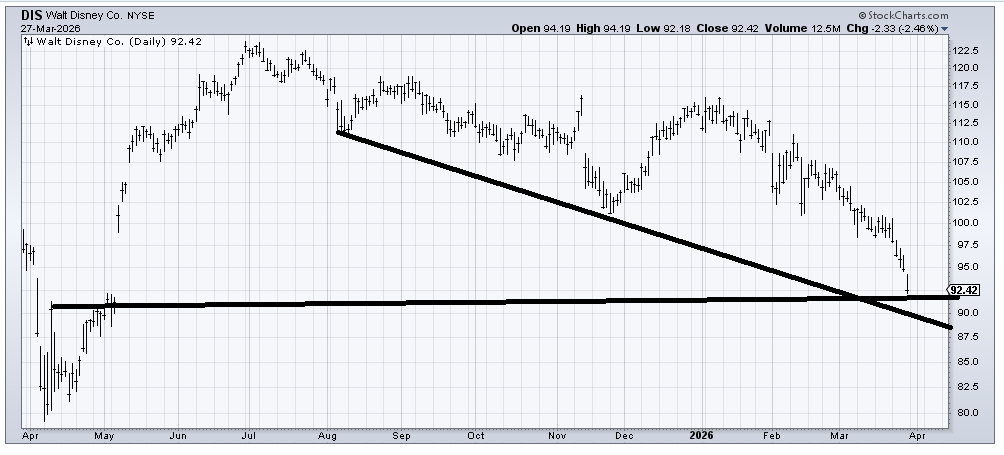
I don’t know what it will take to make Disney (DIS) a good chart again, but it is getting very oversold down here, it is filling that gap from last year, and there is support in this 88-92 area so it’s an oversold rally candidate.
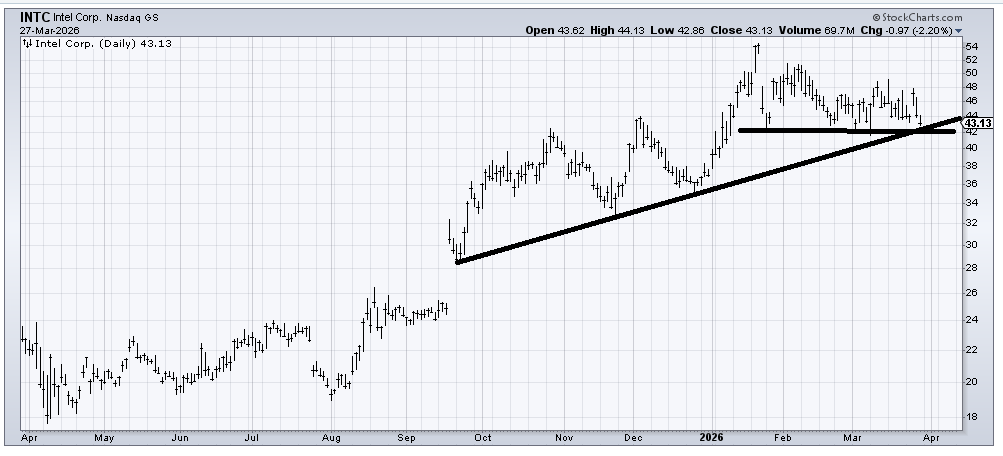
Intel (INTC) , like many of the semis, has held up relatively well. I think it could break 42 if we get that last mile.
Related: Tesla Among Top-3 Stocks to Short as Downtrend Continues
