Super Micro Shows Big Problems on the Charts
The stock drops after new short report from Hindenburg Research, so let's see if there's a bottom in sight.
You've reached your free article limit
You've read 0 of 1 free Pro articles.
Server maker Super Micro Computer SMCI fell sharply Tuesday morning after a new short report from Hindenburg Research. The company claims it found "glaring accounting red flags, evidence of undisclosed related party transactions, sanctions and export control failures, and customer issues."
I have no special knowledge of what is going on at the company, so let's stick to what we know -- the charts.
The stock was under pressure on Monday, too. Let's check the condition of the charts and indicators.
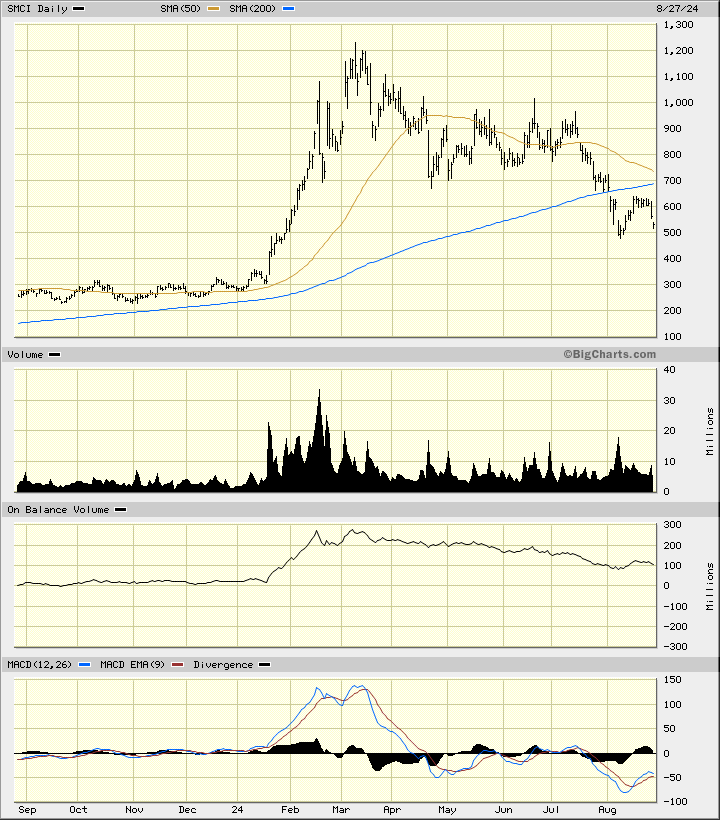
In this daily bar chart of SMCI, below, I can see that prices made a high back in March. Prices have been in a downward trend since that high. SMCI is trading below the declining 50-day moving average line and below the still rising 200-day moving average line. The On-Balance-Volume (OBV) line made a peak back in February-March and has made a lengthy decline telling me that sellers of SMCI have been more active than buyers. The trend-following Moving Average Convergence Divergence (MACD) oscillator is in a bearish alignment below the zero-line.
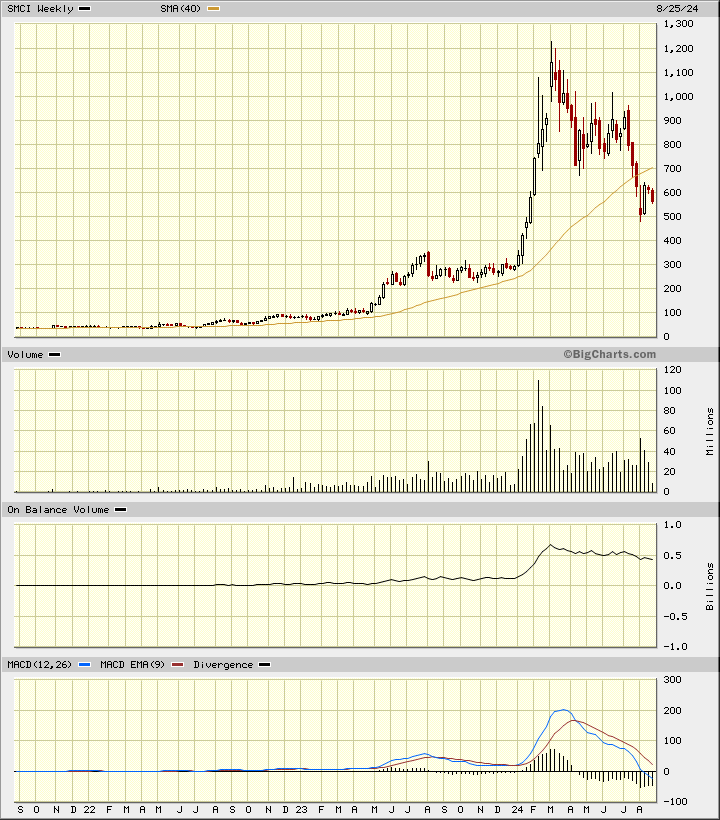
In this weekly Japanese candlestick chart of SMCI, below, I see a setup that suggests we are going to see weaker prices in the weeks ahead. Prices are trading below the cresting 40-week moving average line. The weekly OBV line has been weak since early March. The MACD oscillator has been trending lower and is crossing below the zero-line. The candles have yet to show us a bottom reversal pattern.
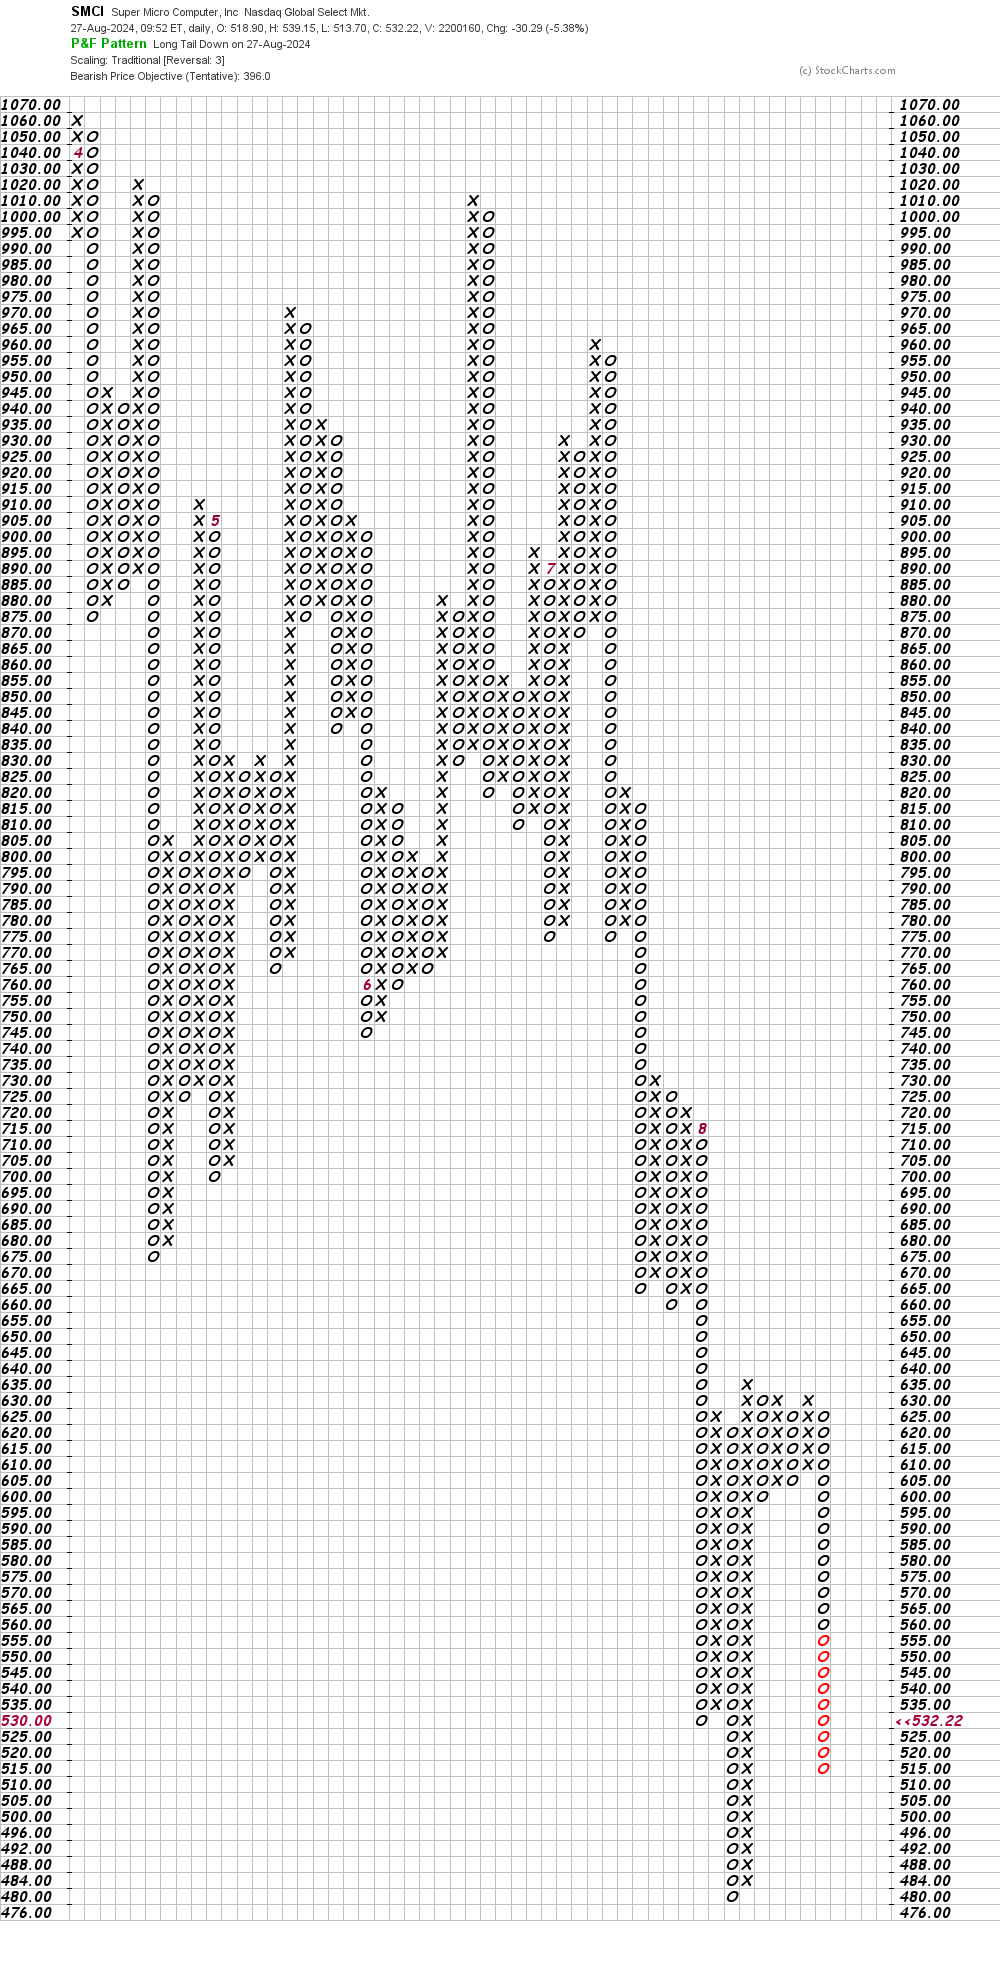
In this daily Point and Figure chart of SMCI, below, I can see that the software is projecting a downside price target in the $396 area.
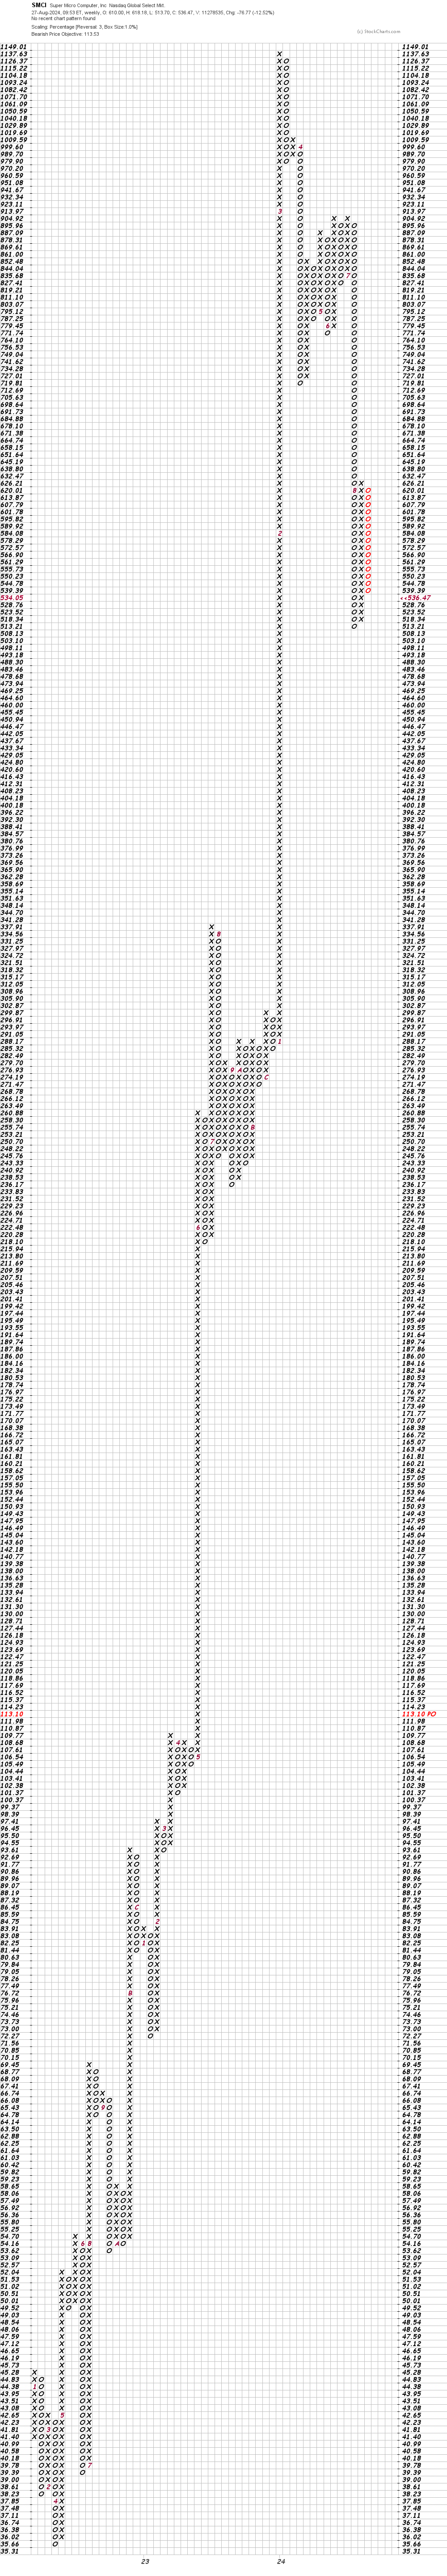
In this weekly Point and Figure chart of SMCI, below, I used close only price data. Here the software suggests a downside target in the $114 area.
Bottom line strategy: I have no special insights about the Hindenburg Research report on SMCI. The trend of price has been for several months now and I don't see the conditions for a bottom. Buyer beware.
Employees of TheStreet are prohibited from trading individual securities.