Our Strategy for Two Offshore Drillers Amid $1.5 Billion Acquisition News
We took a deep dive into the price charts for Noble and Diamond Offshore Drilling as the two negotiate a major acquisition.
You've reached your free article limit
You've read 0 of 1 free Pro articles.
On Monday, oilfield services firm Noble NE said it would buy Diamond Offshore Drilling DO in a cash-and-stock deal worth $1.59 billion. Shares of DO are trading more than 6% higher before markets open on Monday. Energy companies are plowing their profits into international and offshore drilling inventories boosting prospects for companies like Noble.
Let's check out the charts of DO and another offshore driller by the name of Transocean Ltd. RIG.
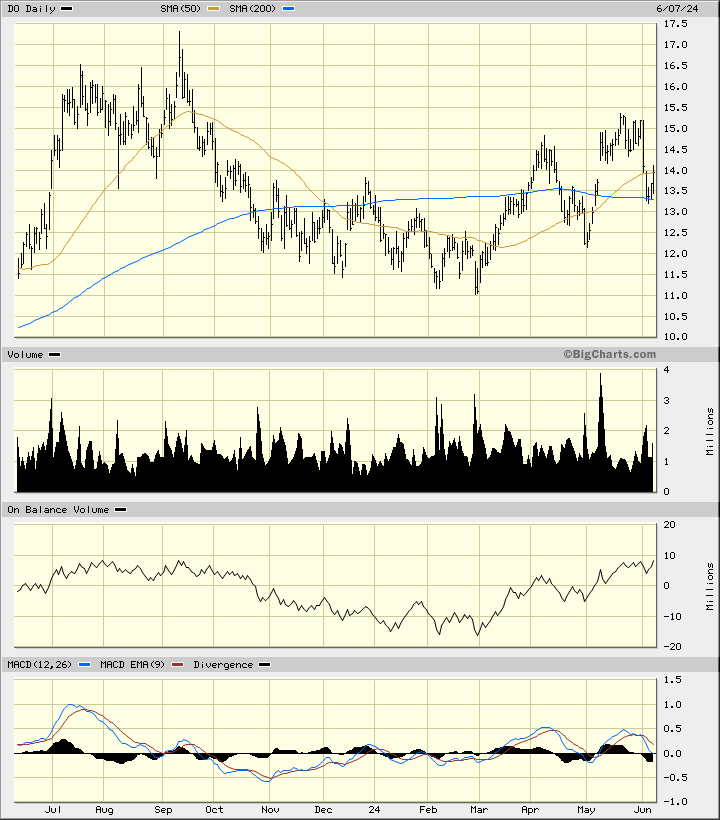
In this daily bar chart of DO below, I can see that the charts of DO became more bullish in the three months prior to this bid announcement. Prices began turning higher from late February. DO trades above the rising 50-day moving average line and above the bottoming 200-day line. The On-Balance-Volume (OBV) line turned higher at the end of February, telling me that traders became more aggressive buyers than sellers. The Moving Average Convergence Divergence (MACD) oscillator is just above the zero line.
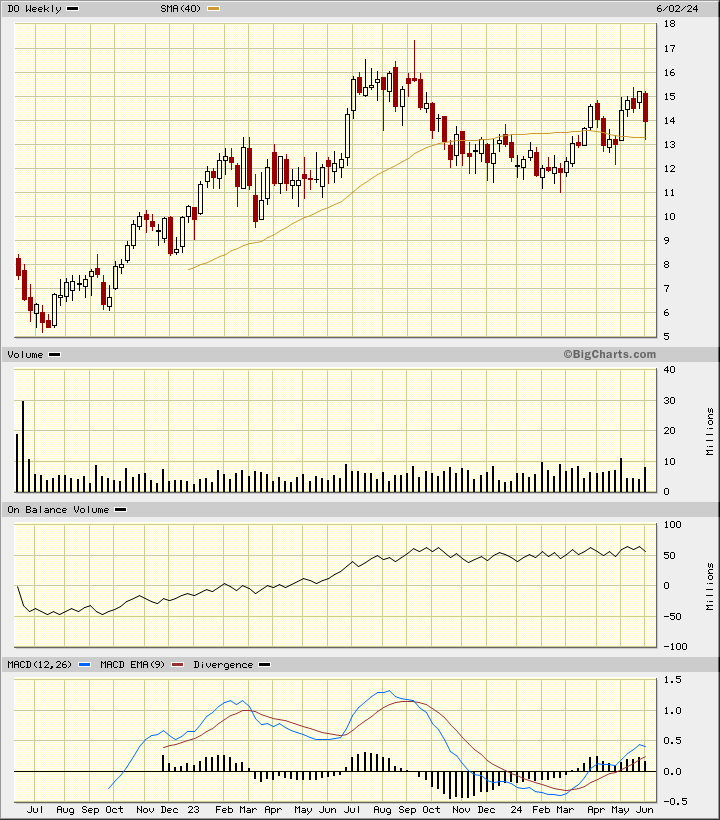
In this weekly Japanese candlestick chart of DO below, we can see the last two years of price action. Prices trade above the flat 40-week moving average line. The OBV line is positive and the MACD oscillator is above the zero line.
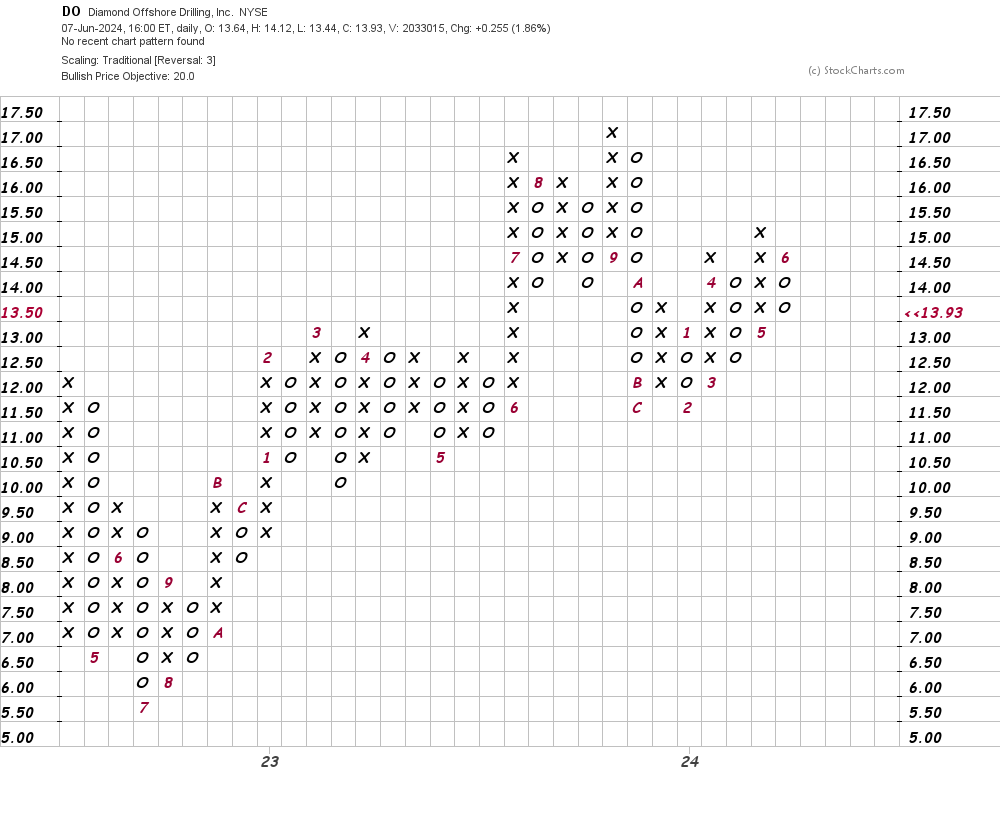
In this daily Point and Figure of DO below, I can see a price target in the $20 area.
Bottom line strategy: I have no special knowledge of what will go on in the boardrooms of NE or DO. Will the offer be accepted, rejected or sweetened? Ir is there another bidder out there somewhere? I am inclined to be a seller of DO on strength.
Let's check out the charts of RIG to see if it might be attractive to a buyer.
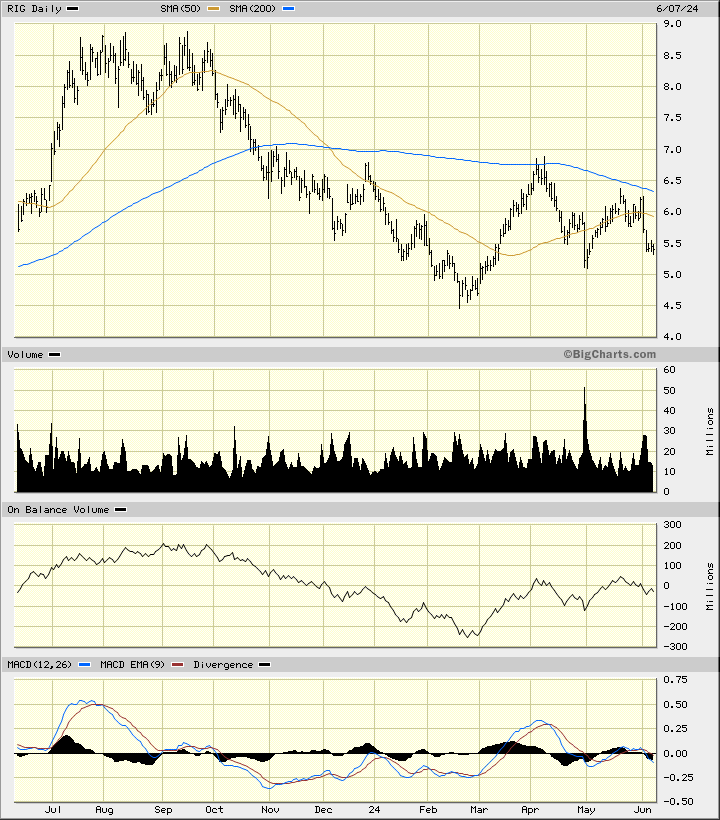
In this daily bar chart of RIG below, I can see a decline into a low in February followed by an uneven rally into early April. Prices are now trading below the 50-day moving average line and the 200-day moving average line. The daily OBV line has mirrored the price action. The MACD oscillator is hugging the zero line.
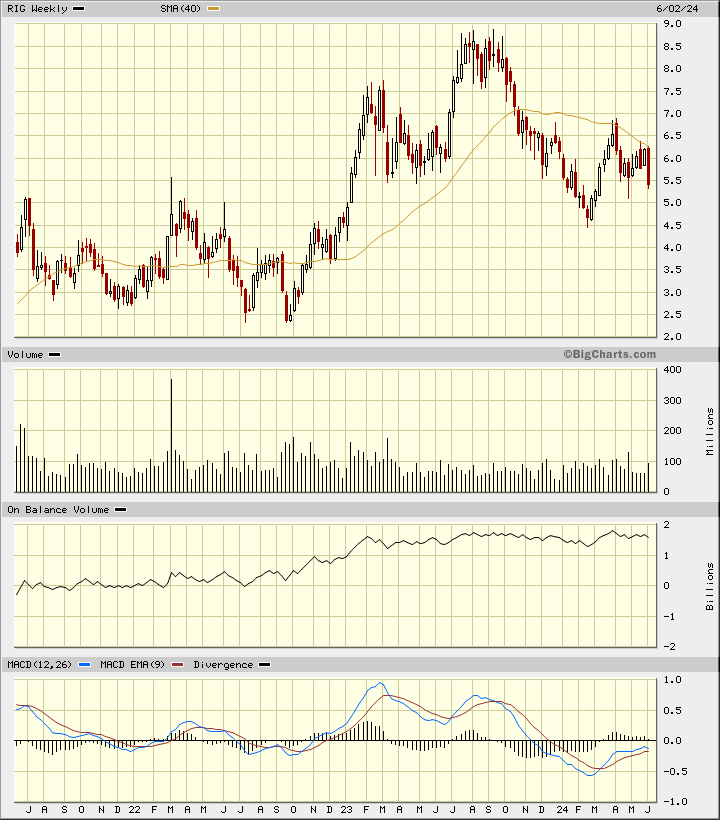
In this weekly Japanese candlestick chart of RIG below, I can see a generally positive picture. Prices are trading below the 40-week moving average line but the weekly OBV line is very steady and the MACD oscillator has been improving.
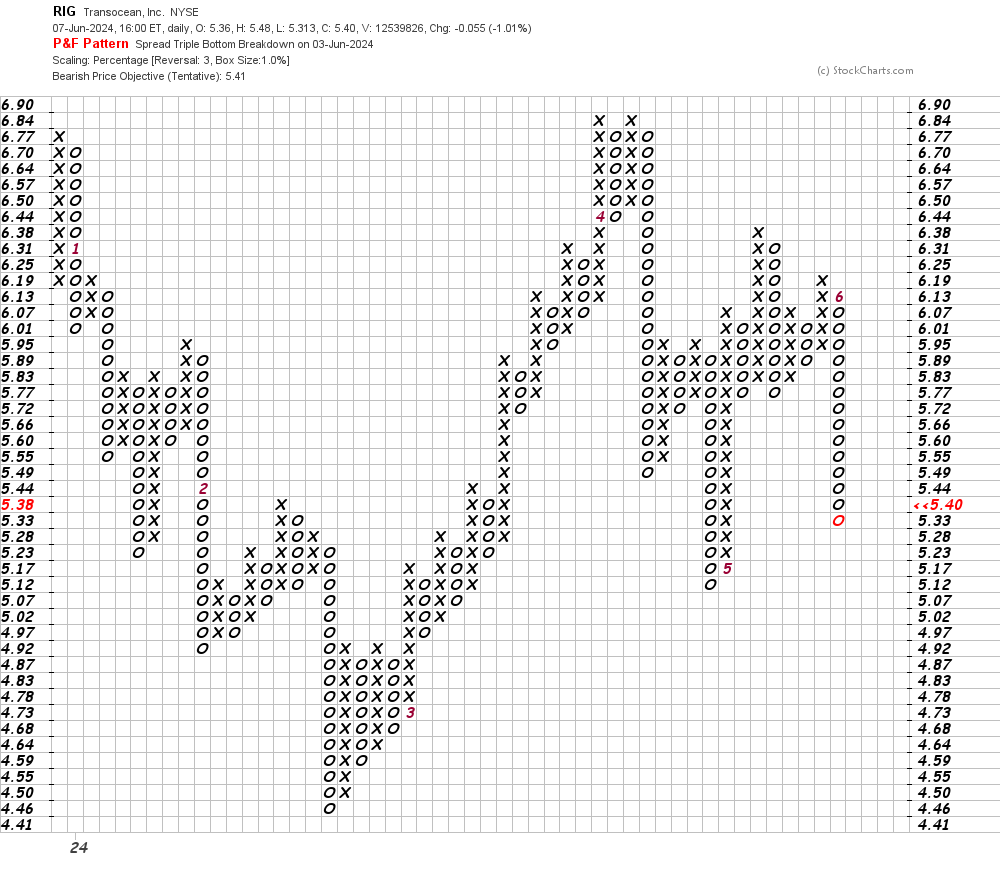
In this daily Point and Figure chart of RIG below, I can see that prices have reached a downside price target of $5.41. Reaching a downside price target does not mean we cannot decline further.
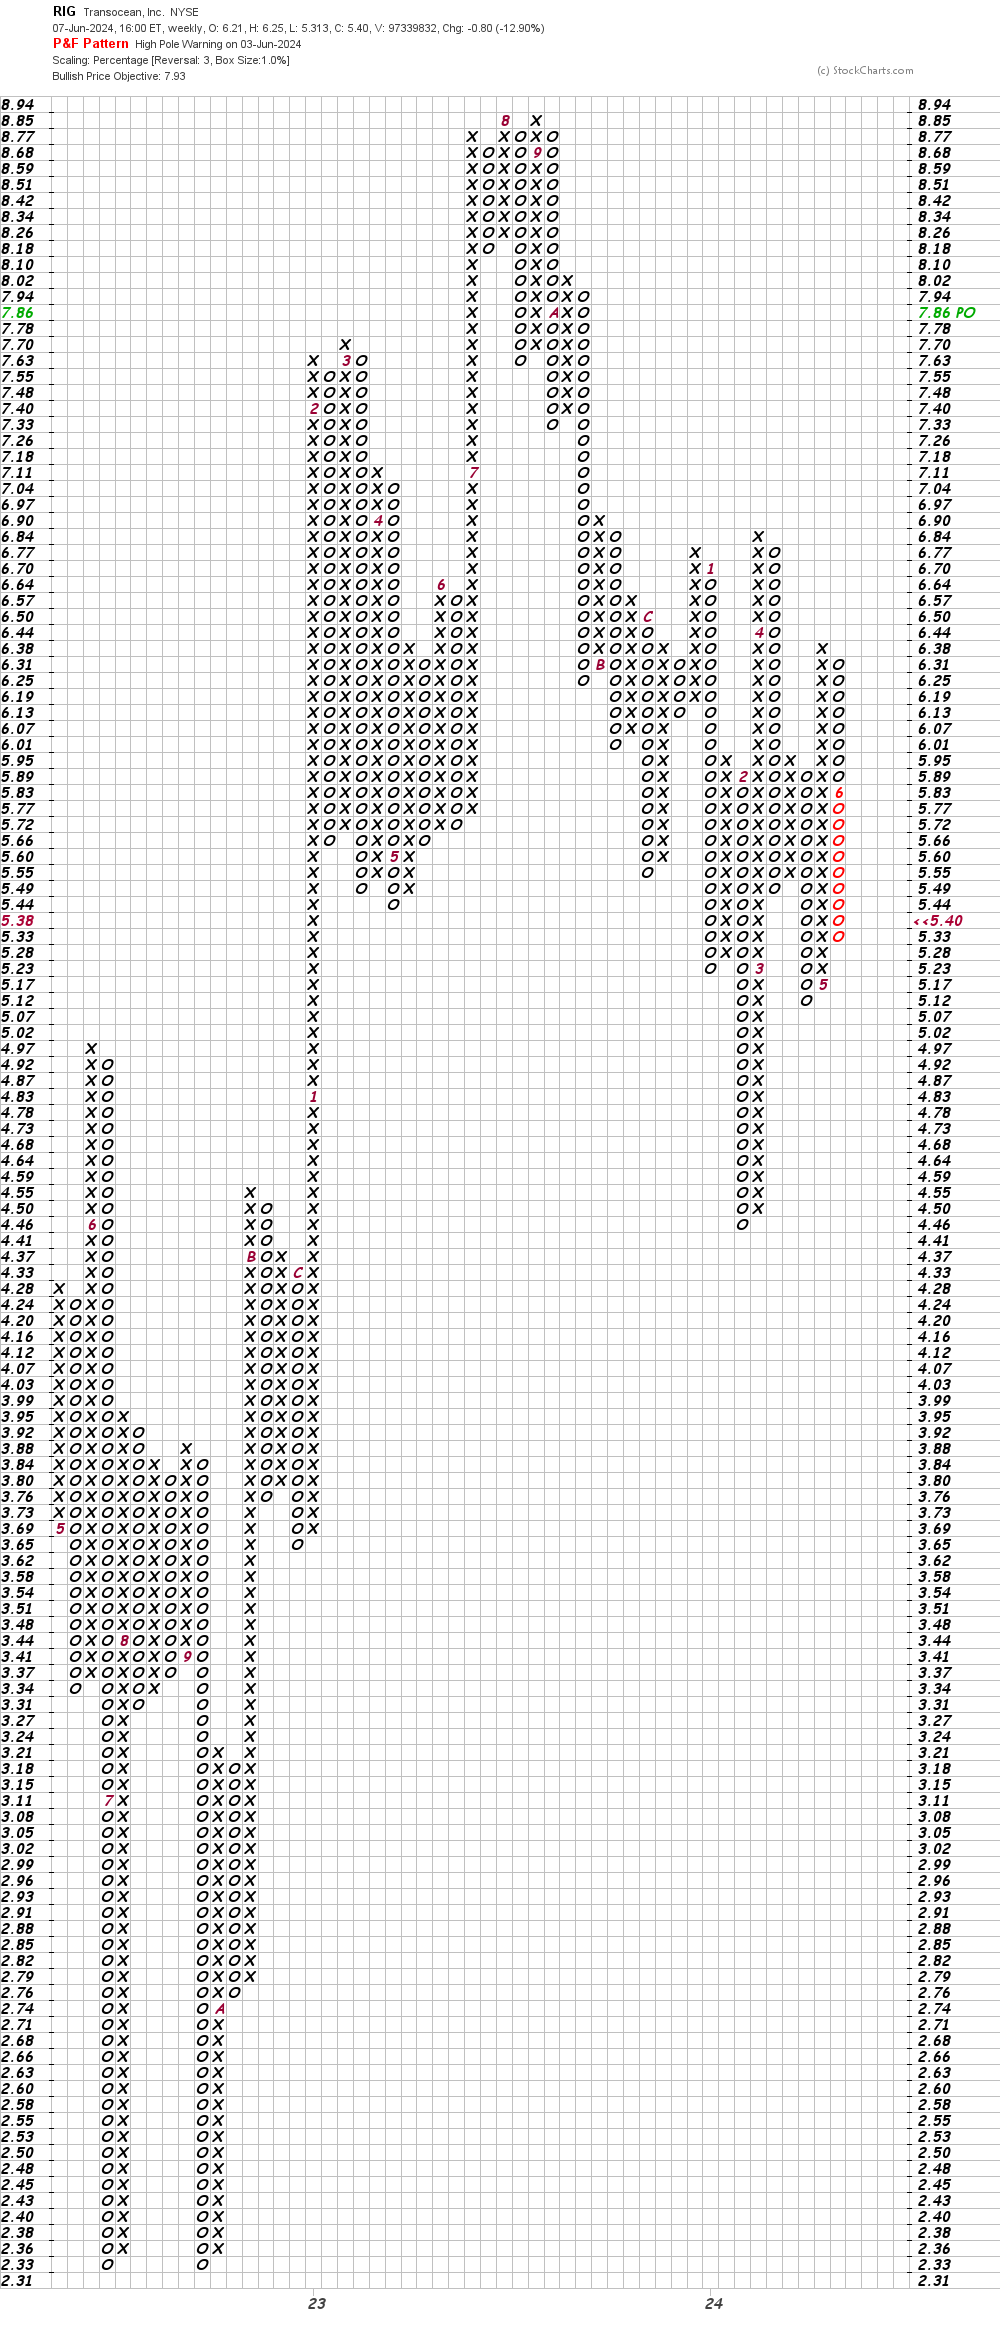
In this weekly Point and Figure chart of RIG below, I can see an upside price target in the $8 area.
Bottom line strategy: Could some company be looking to acquire RIG? Maybe, maybe not. The charts are just OK, so do your own research.
Employees of TheStreet are prohibited from trading individual securities.