I've Got a New Price Target for Crocs
Charts for the footwear company are positive and traders can consider going long.
You've reached your free article limit
You've read 0 of 1 free Pro articles.
Crocs, Inc. (CROX) is a footwear company that manufactures and markets the Crocs brand of foam footwear. Let's check out the charts and indicators of CROX.
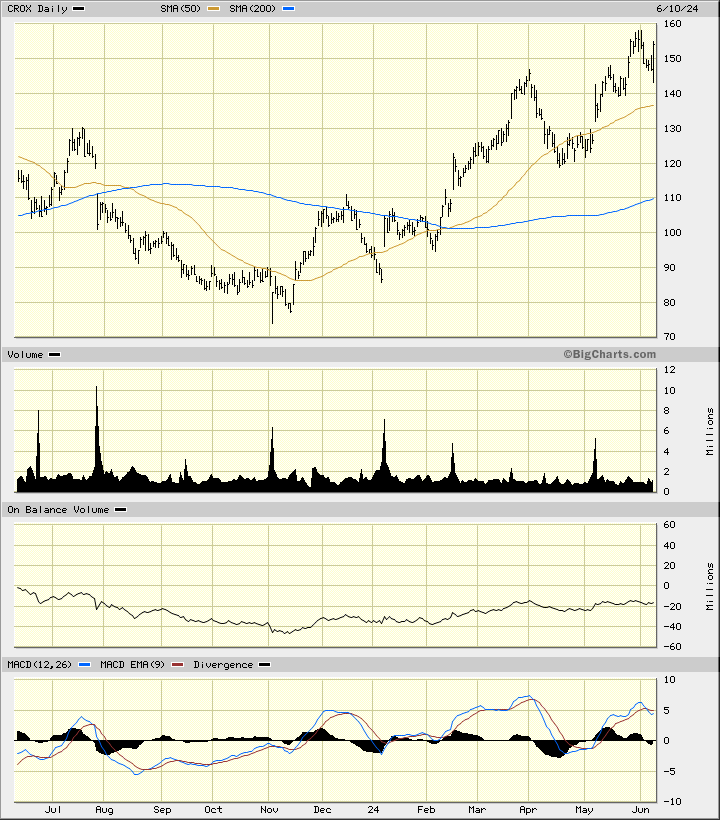
In this daily bar chart of CROX below, I can see that prices made a low in early November 2023. CROX has rallied nicely and now trades above the rising 50-day moving average line and above the rising 200-day moving average line. The On-Balance-Volume (OBV) line has been firm since November. The trend-following Moving Average Convergence Divergence (MACD) oscillator is above the zero line but correcting to the downside.
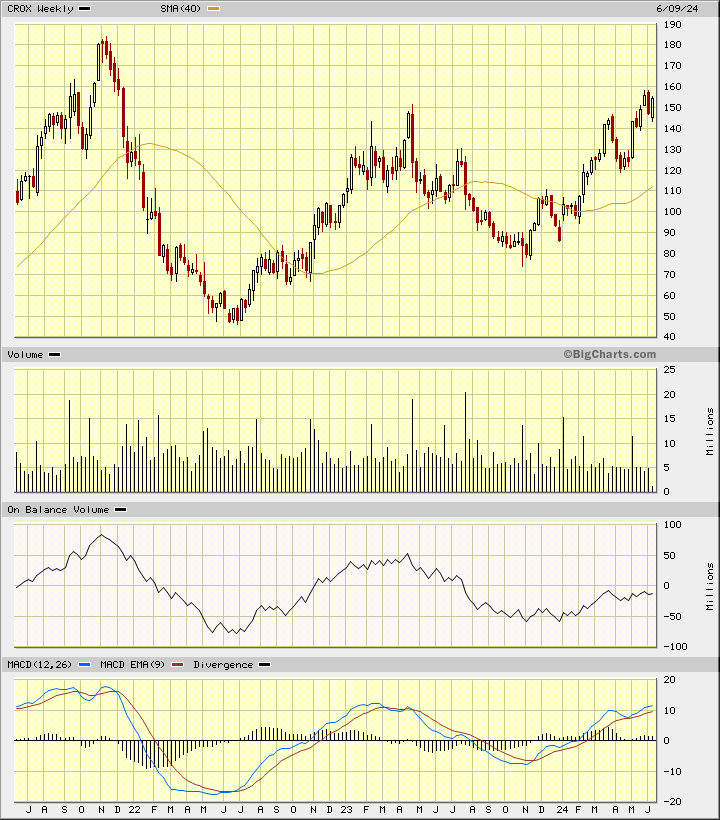
In this weekly Japanese candlestick chart of CROX below, I see a mixed setup. Prices are in a longer-term uptrend and trade above the rising 40-week moving average line. The weekly volume histogram has been shrinking over the past year and suggests that investor interest is waning. The weekly OBV line shows a rise this year but a longer-term decline since early 2023. The MACD oscillator is above the zero line and rising but it has narrowed in recent weeks.
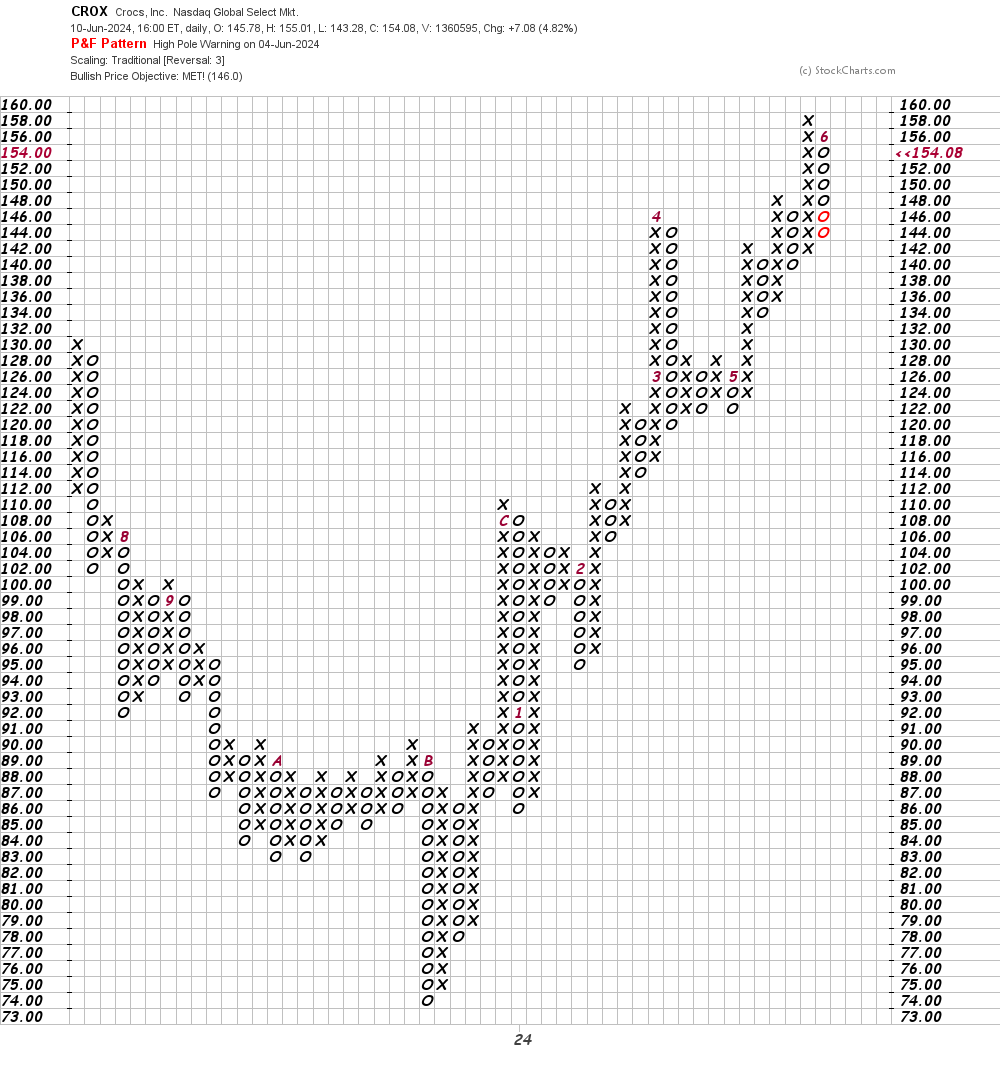
In this daily Point and Figure chart of CROX below, I can see that prices have reached and exceeded a price target in the $146 area.
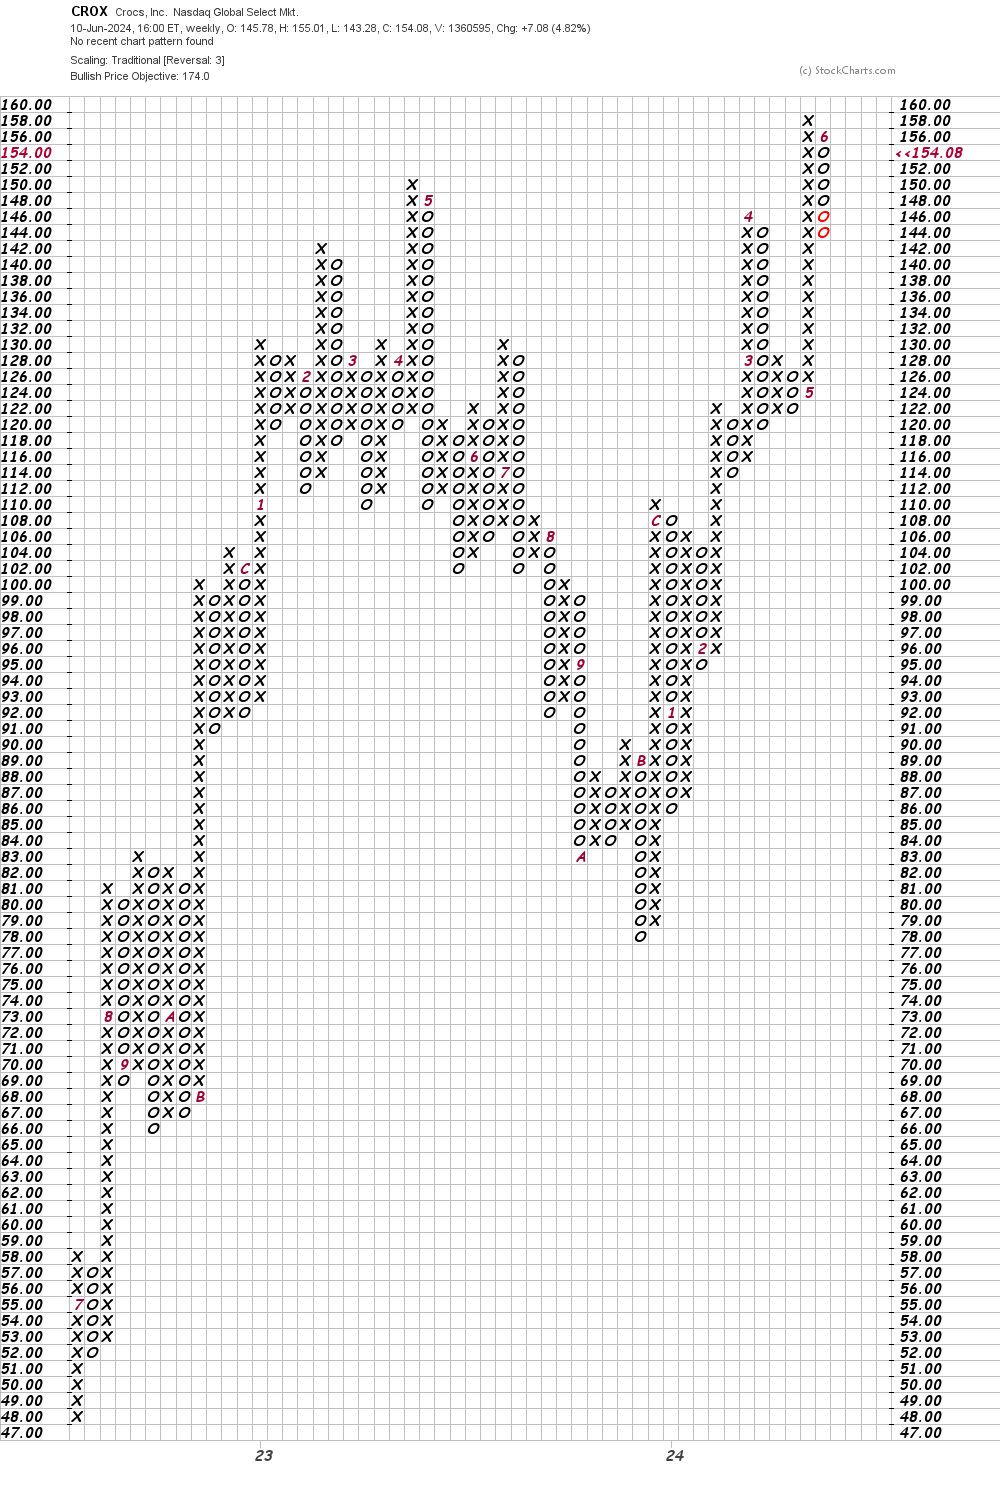
In this weekly Point and Figure chart of CROX below, I can see a potential price target in the $174 area.
Bottom line strategy: In the interest of full disclosure, I have a pair of CROX somewhere in the back of my closet. I have a son and a daughter-in-law who are chefs and sometimes wear CROX and another daughter-in-law who wears CROX at a medical practice. I don't know if more people are wearing more Crocs or not beyond that, but the charts are positive.
Traders could go long CROX at current levels risking to $130. The $174 area is my price target.
Employees of TheStreet are prohibited from trading individual securities.