Spotify Is Finally Feeling the Effects of Gravity: Our Updated Strategy
The shares are heading lower. Here's where they may land.
You've reached your free article limit
You've read 0 of 1 free Pro articles.
In my June 5 review of Spotify SPOT I wrote that "It is a little disheartening to see the prices of a stock continue to rise after recommending taking profits. You have to call them as you see them. I would not recommend jumping back into shares of SPOT. Take a trading break and let's see what happens."
SPOT is not expected to report earnings until next week but let's check on the charts again.
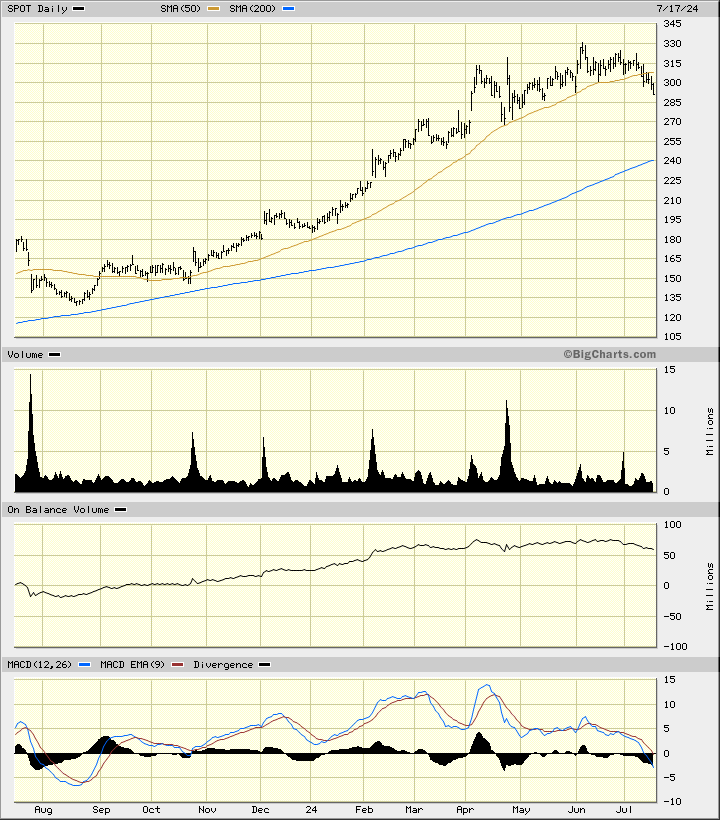
In this updated daily bar chart of SPOT, below, I can see that share prices have been rolling over since our last review. Prices are now trading below the cresting 50-day moving average line.
The On-Balance-Volume (OBV) line has been weakening since early June. The Moving Average Convergence Divergence (MACD) oscillator has declined below the zero line for an outright sell signal.
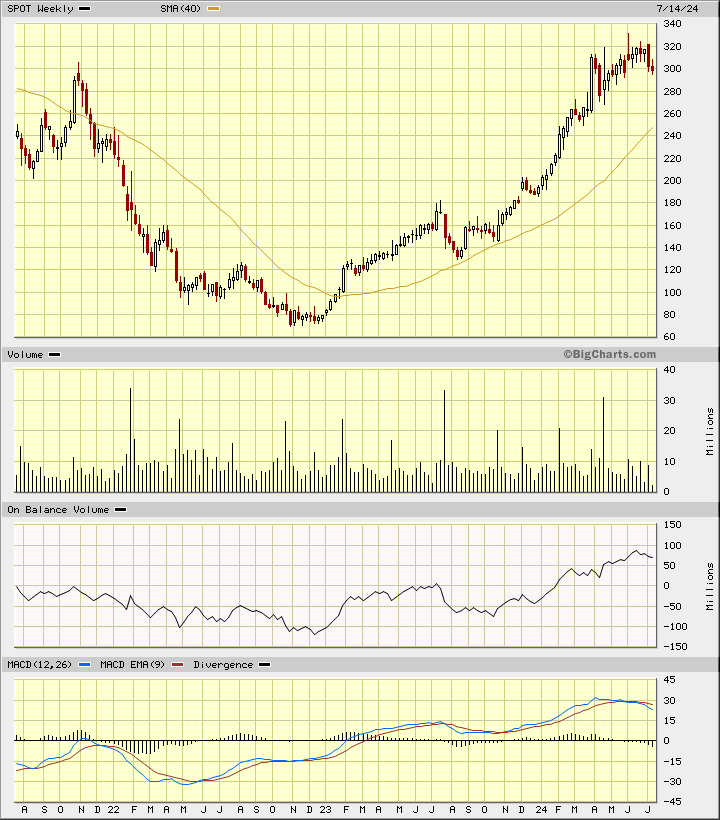
In the weekly Japanese candlestick chart of SPOT, below, I see a bearish setup. Prices made a top reversal pattern and prices have turned lower.
The weekly OBV line is turning lower as sellers are now more aggressive than buyers. The MACD oscillator has crossed to the downside for a take profits sell signal.
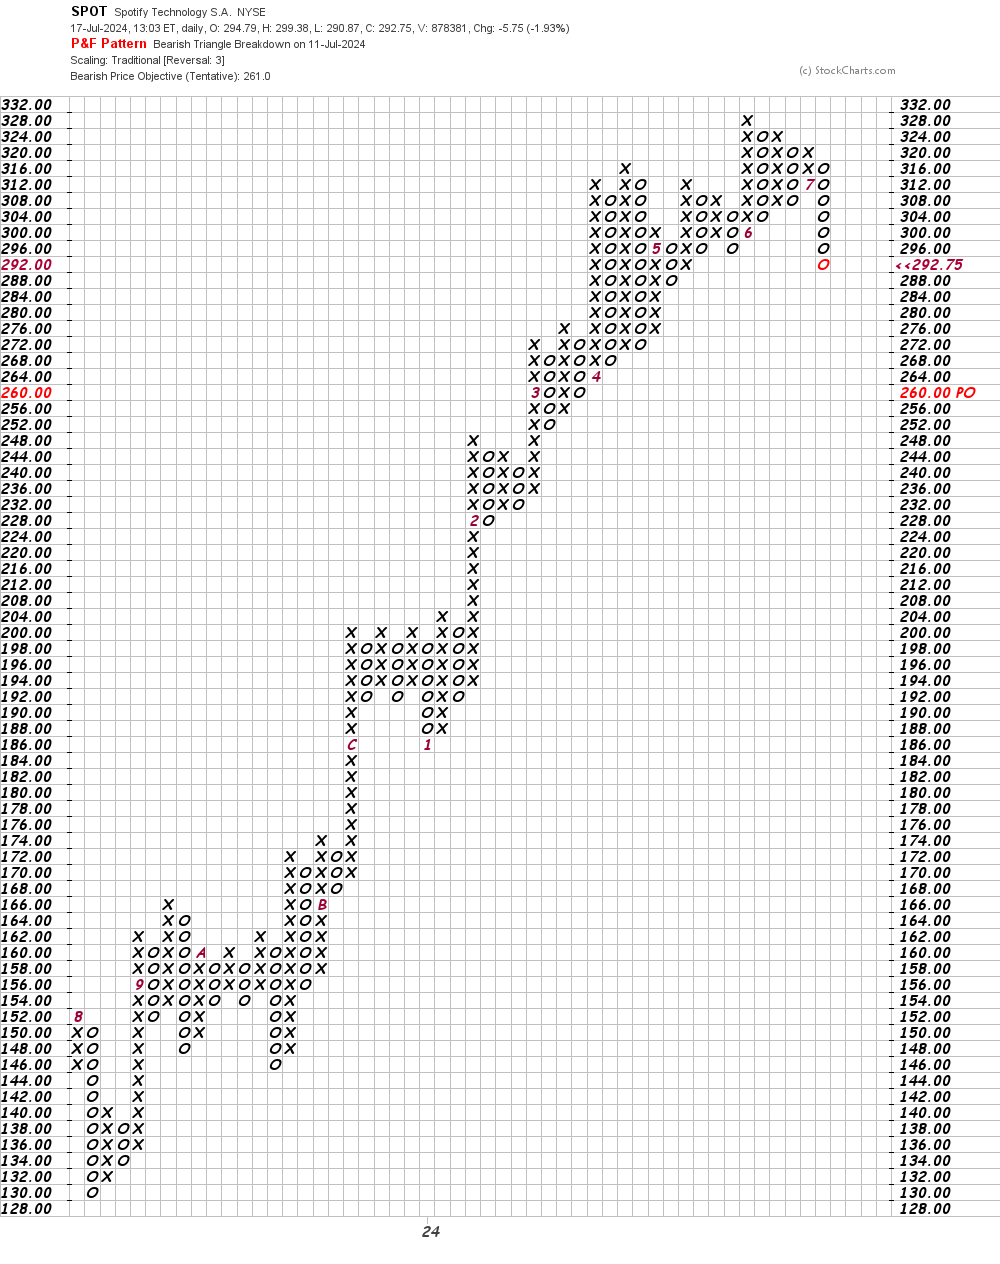
In this daily Point and Figure chart of SPOT, below, I can see a potential downside price target in the $261 area.
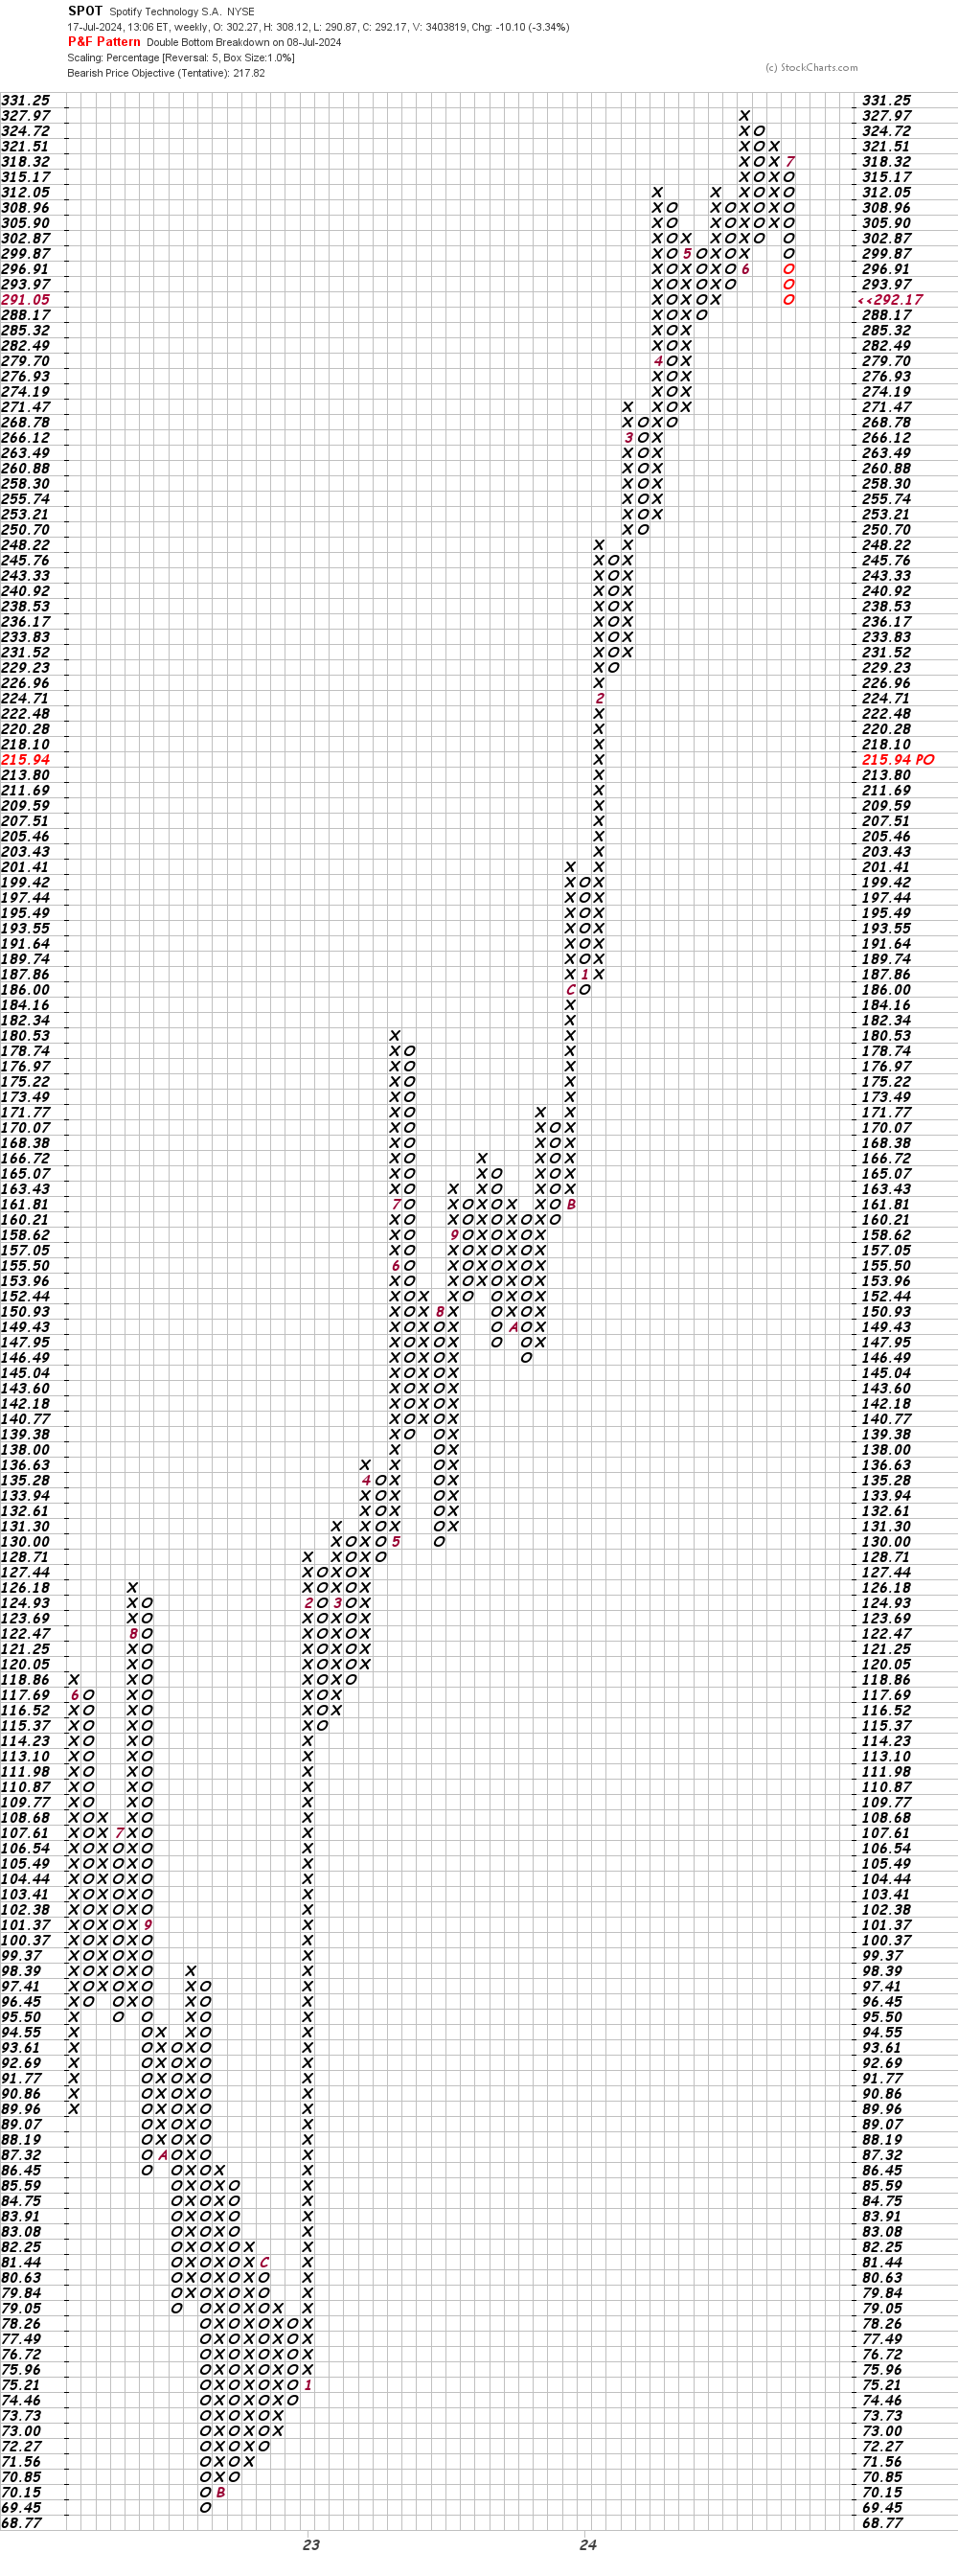
In this second Point and Figure chart of SPOT, below, I used weekly price data with a five-box reversal filter. This projects a potential price target in the $218 area.
Bottom-line strategy: I have no special knowledge of what SPOT will be telling shareholders next week but the charts suggest that the share price could head lower. Continue to stand aside.
Employees of TheStreet are prohibited from trading individual securities.