Something's Rattling Inside of Ferrari's Charts
Here's why you might want to RACE away from this luxury sports car company.
You've reached your free article limit
You've read 0 of 1 free Pro articles.
Ferrari N.V. RACE is "the" Italian luxury sports car manufacturer founded in 1939 by Enzo Ferrari. It is the dream car of millions of people around the world, even if they cannot afford a fractional ownership of it. ... And even if they live in a crowded city and really can't drive it. (The Porsche 356 is my dream car now, if you want to know.)
Let's click our seat belts and check out the charts and indicators of RACE.
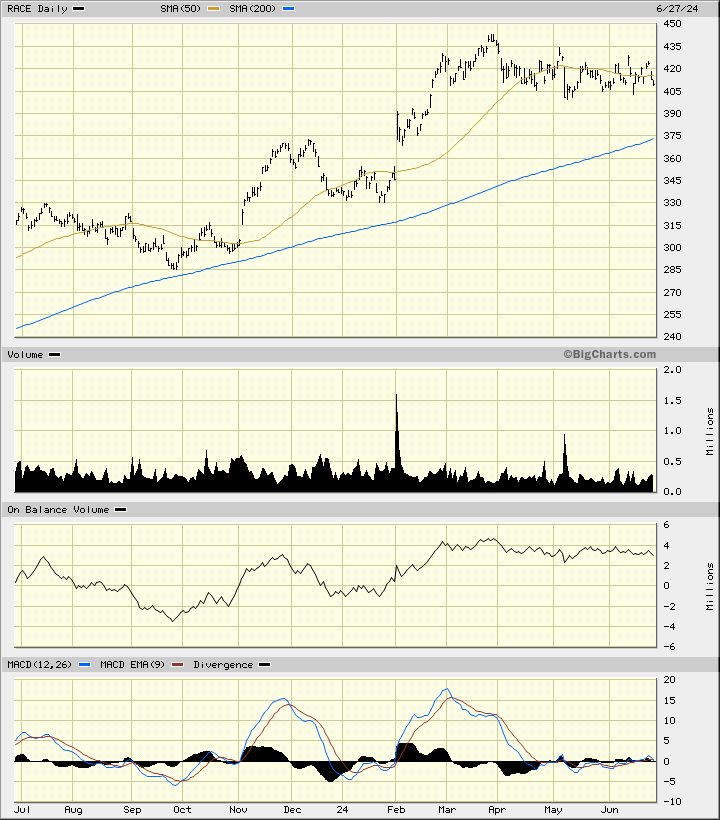
In this daily bar chart of RACE, below, I can see that prices have been drifting sideways since April. Does RACE have a mechanical problem? Trading volume looks like it has declined since April.
The daily On-Balance-Volume (OBV) line has drifted lower since early April. The Moving Average Convergence Divergence (MACD) oscillator has been hugging the zero-line and tells me that the trend is lacking ... horsepower.
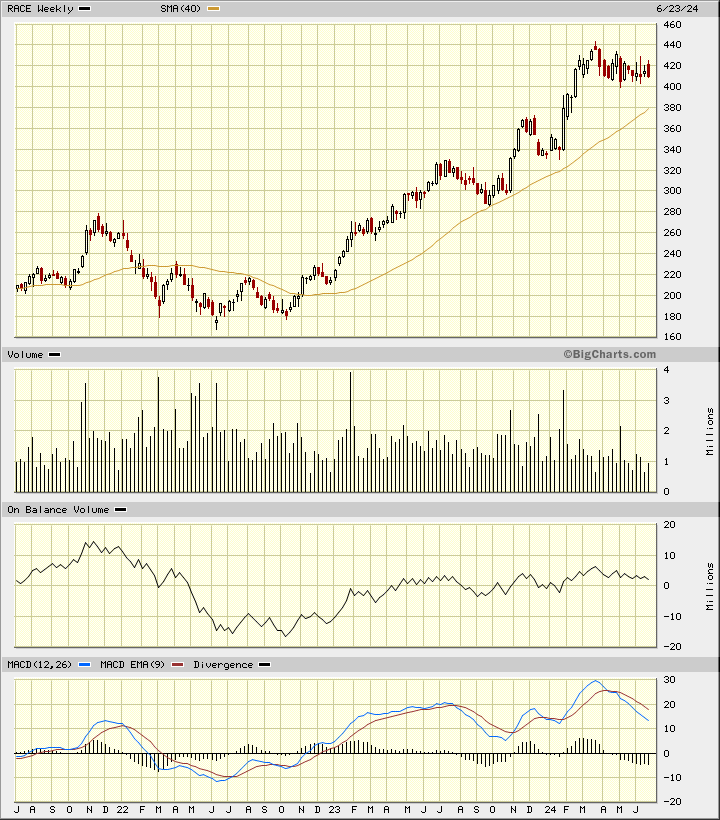
In this weekly Japanese candlestick chart of RACE, below, I see a picture that is more likely to weaken than strengthen. Prices have been stalled the past three to four months. Prices are still trading above the rising 40-week moving average line but we know this is a lagging indicator. There have been a number of bearish (red) candles and some upper shadows since March. The weekly OBV line and the MACD oscillator have been drifting lower.
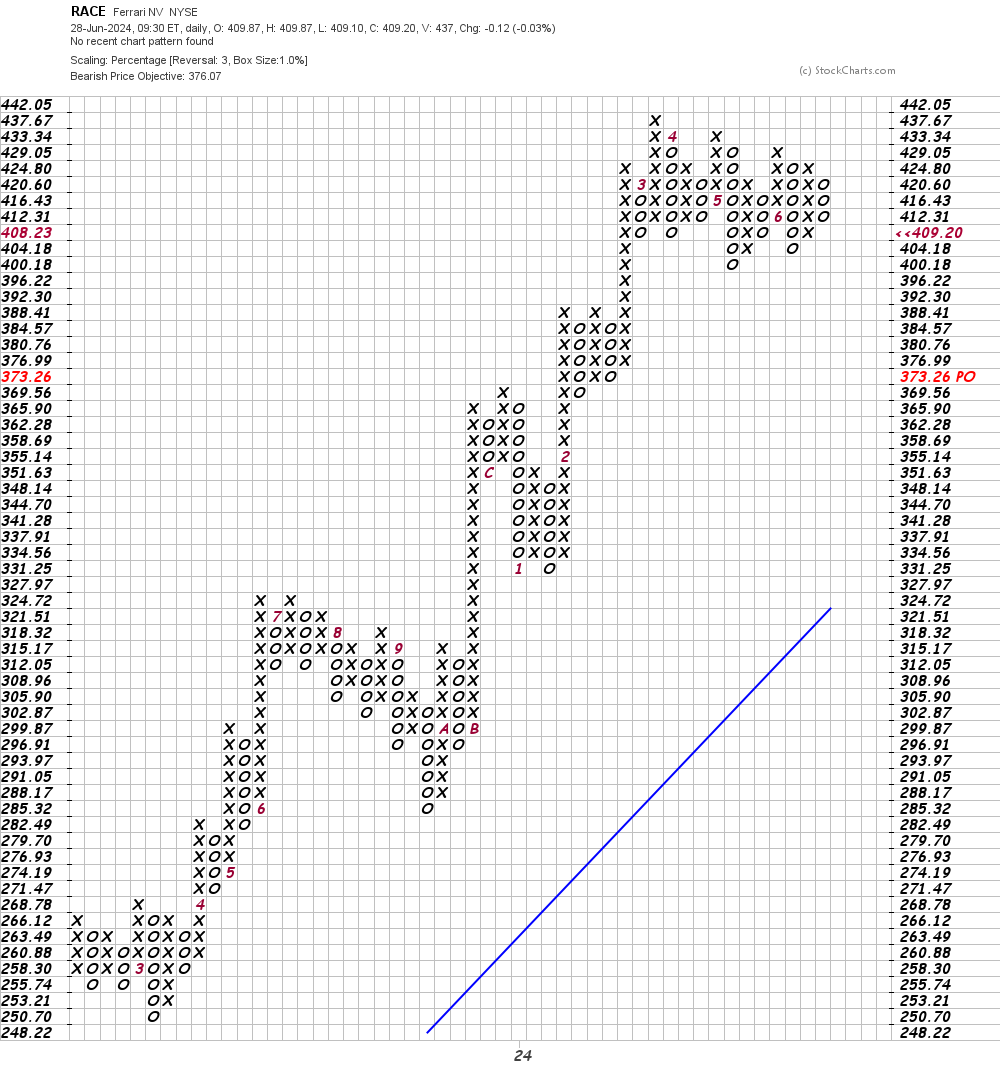
In this daily Point and Figure chart of RACE, below, I can see a potential downside price target in the $376 area.
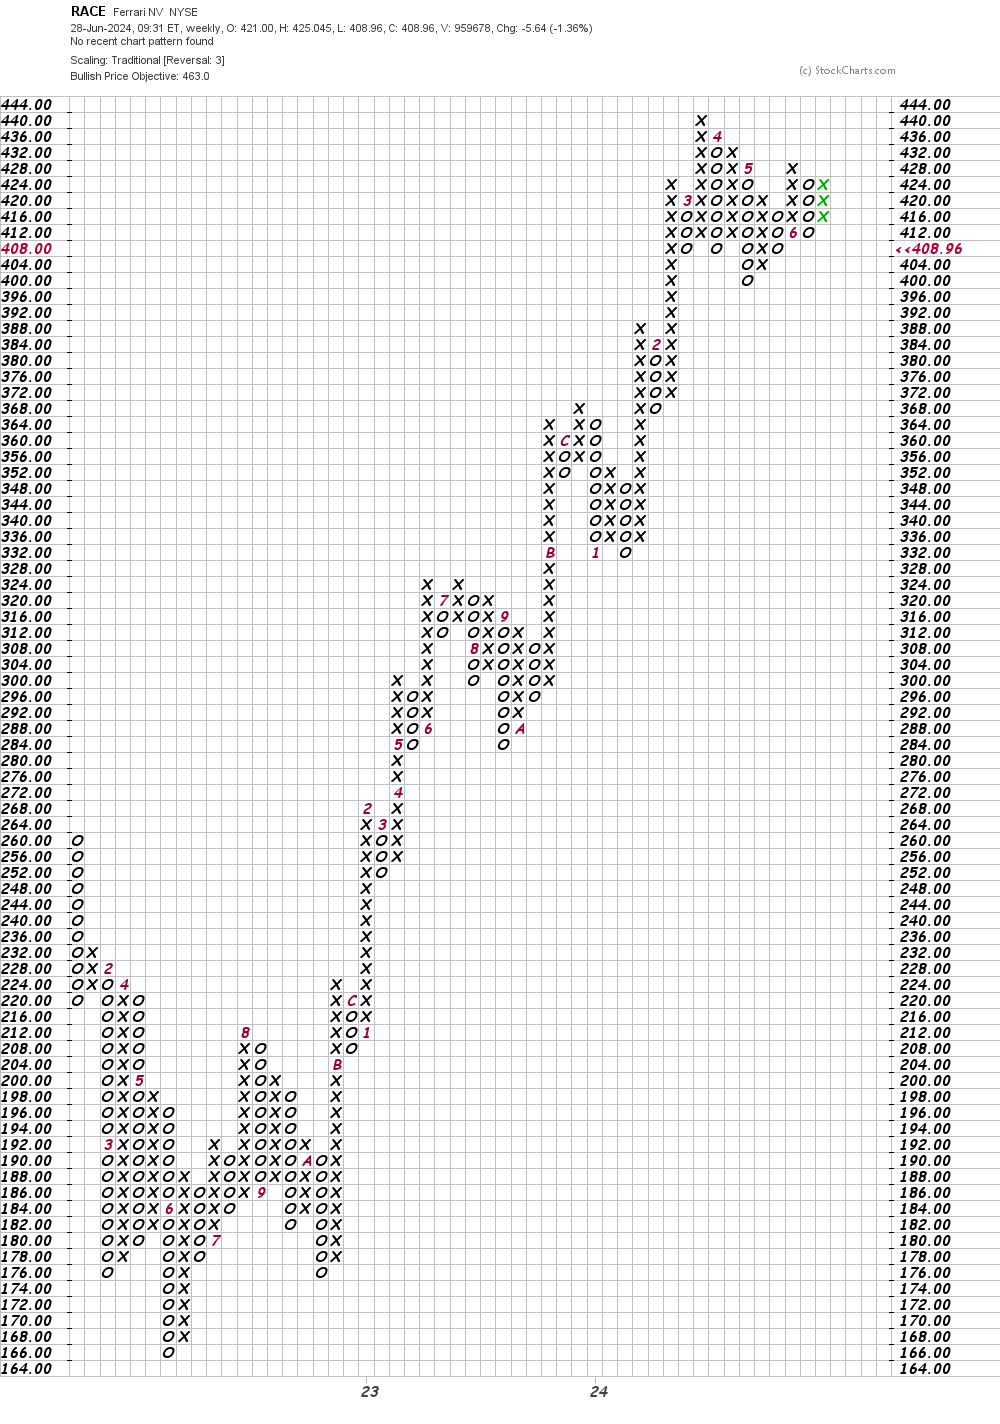
In this weekly Point and Figure chart of RACE, below, I can see a potential upside price target in the $463 area but a trade at $396 could turn this chart bearish.
Bottom line strategy: In my March 19 review of RACE, I basically put out the caution flag.
Today I want to recommend that traders avoid the long side of RACE.
Employees of TheStreet are prohibited from trading individual securities.