Time to Downshift on Ferrari Shares?
Sometimes stock prices can move as fast as a Ferrari.
You've reached your free article limit
You've read 0 of 1 free Pro articles.
Ferrari N.V. RACE is being sued for failing to fix a ‘life-threatening’ brake defect, according to news reports. Will this news hurt the stock price?
The stock has benefited from thriving demand for luxury cars as well as the brand’s iconic worldwide recognition. With a wait time over a year for a new Ferrari it is hard to be negative on the stock but sometimes stock prices can move as fast as a Ferrari.
Let's check the charts and indicators.
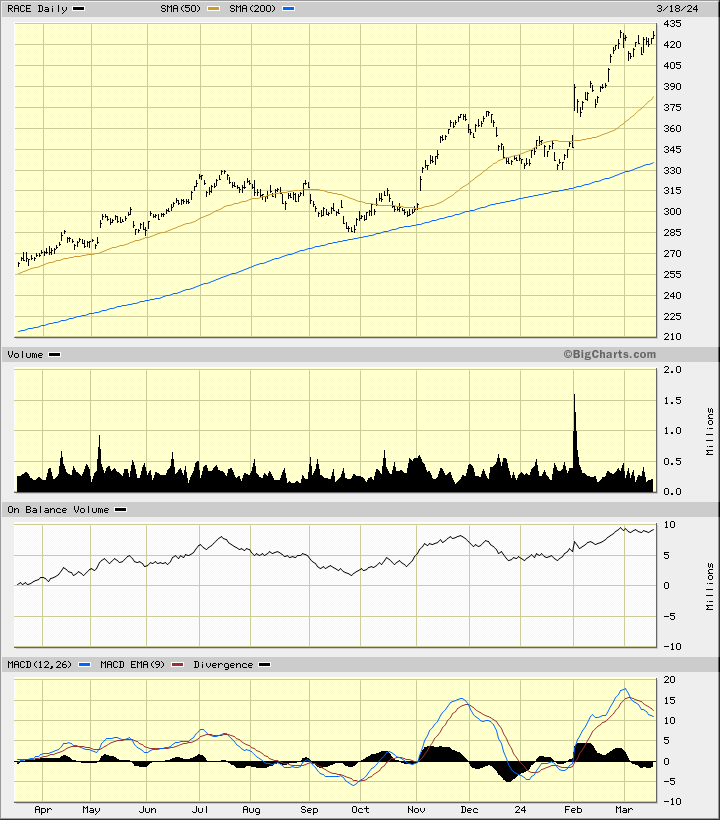
In the daily bar chart of RACE, below, I can see a mixed setup. Share prices are in an uptrend and RACE trades above the rising 50-day moving average line and above the rising 200-day line. The shares got close to the 200-day line in September and October and that now looks (with hindsight) a buying opportunity.
The trading volume has been more active since early November. The On-Balance-Volume (OBV) line has mirrored the price action but has stalled in March suggesting a balance between bulls and bears. The Moving Average Convergence Divergence (MACD) oscillator has crossed to the downside for a take profit sell signal.
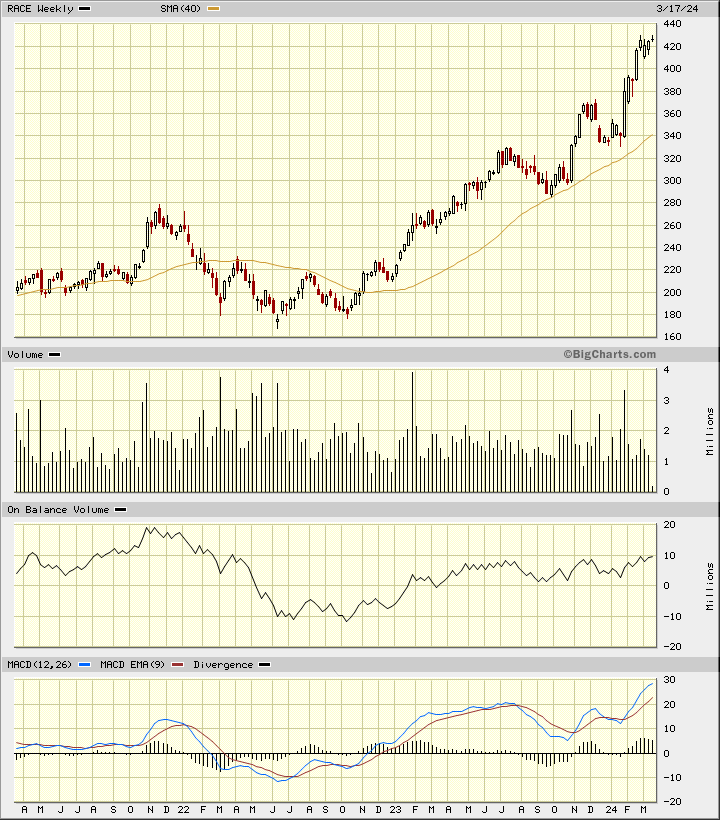
In the weekly Japanese candlestick chart of RACE, below, I see a mixed picture. The shares are in a longer-term advance and trade above the rising 40-week moving average line. The first rally in early 2023 is "long and strong" with no meaningful corrections. The second stage of the advance is still ongoing but notice the corrections along the way.
Trading volume does not show an increase over the past two years and the weekly OBV line, while generally positive, has not kept pace with the price action. This is a subtle bearish divergence.
The MACD oscillator is above the zero line but narrowing which tells me that the strength of the advance is fading a bit. The most recent candle pattern is a doji and that could become part of a top reversal pattern.
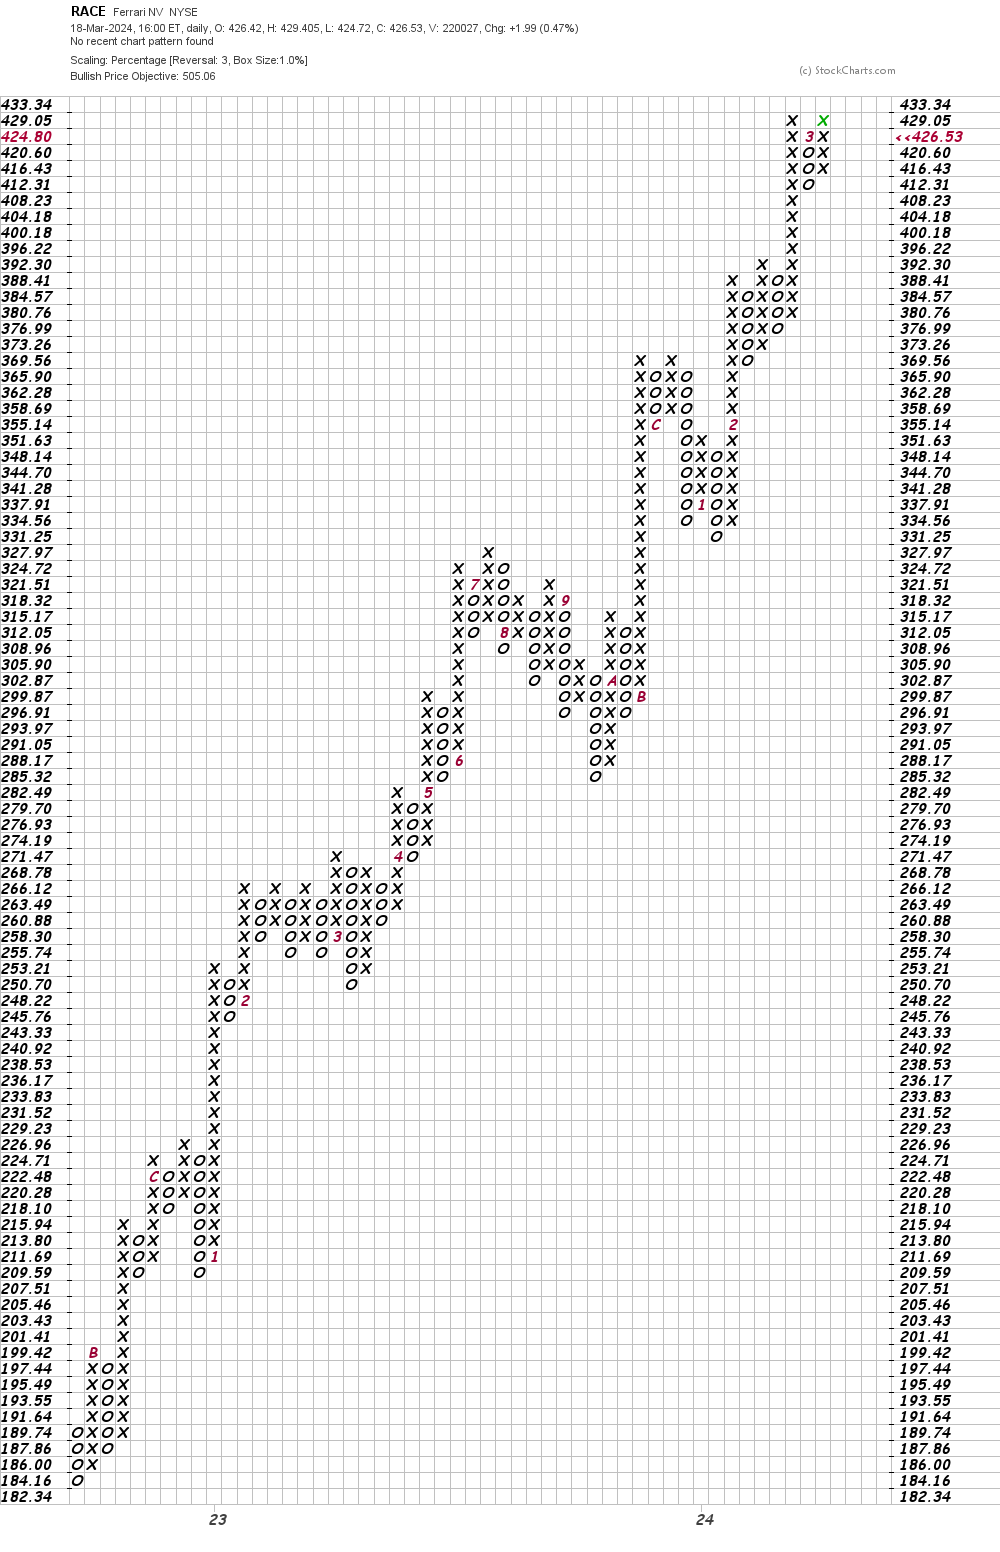
In this daily Point and Figure chart of RACE, below, I can see a potential price target in the $505 area. A trade at $408.23 could start to weaken this picture.
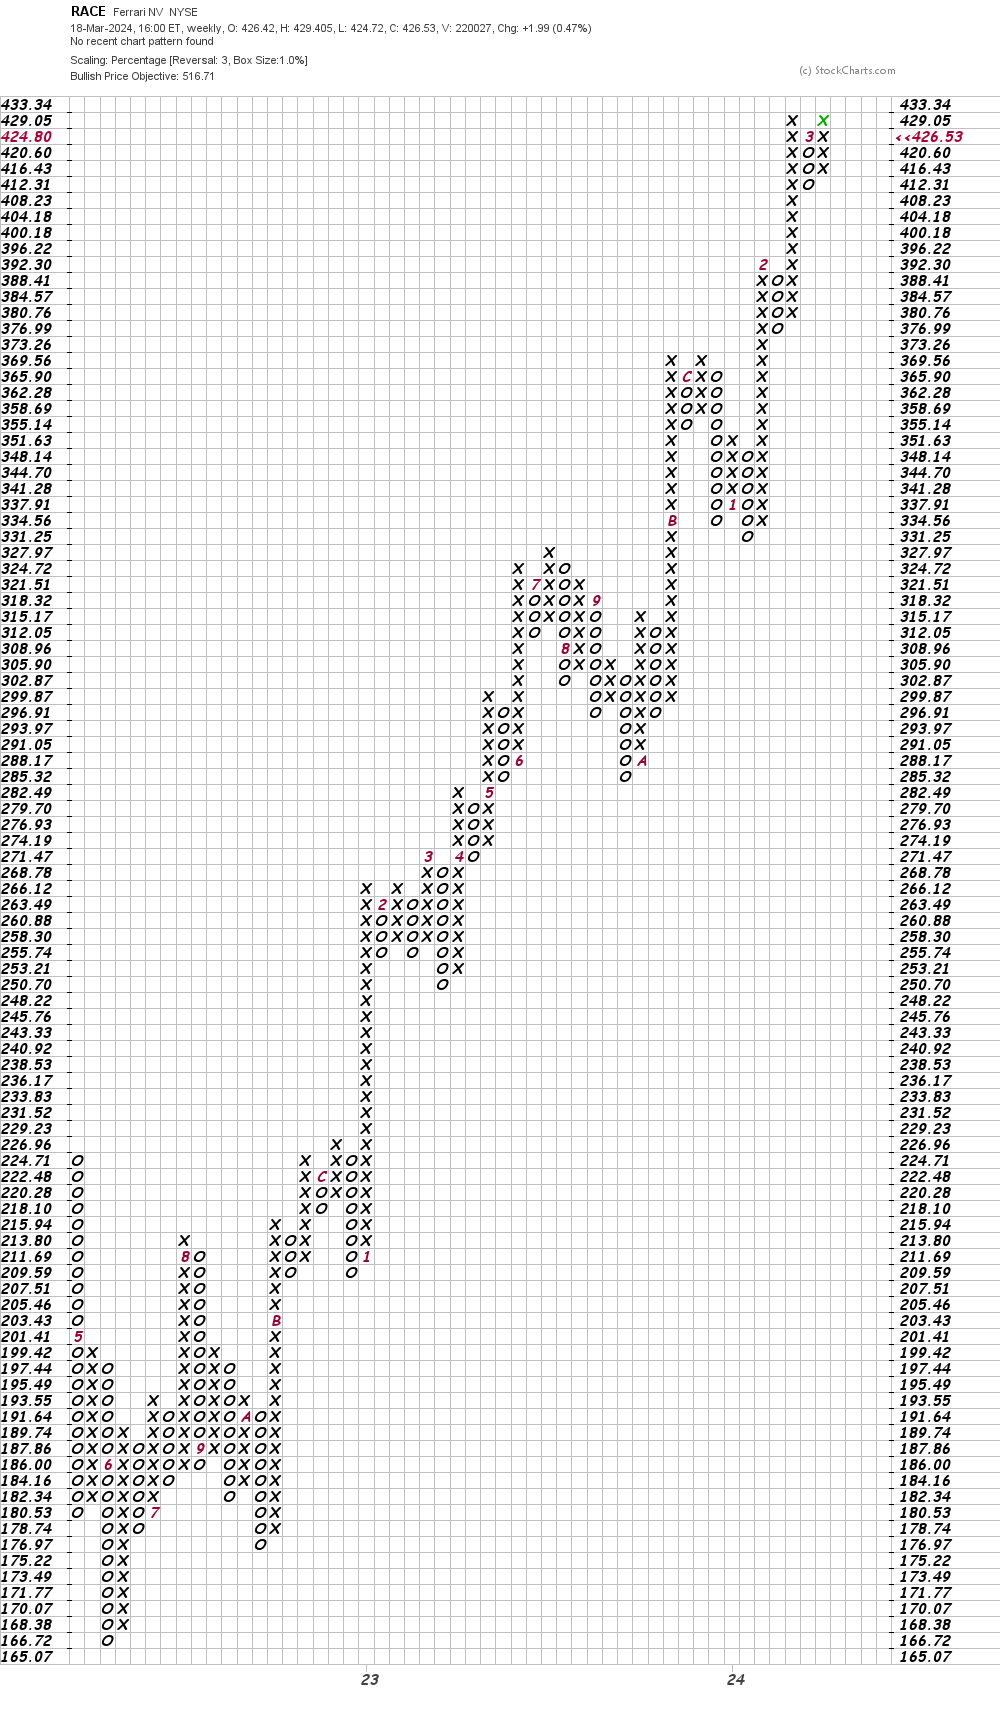
In this weekly Point and Figure chart of RACE, below, I can see a price target in the $517 area.
Bottom-line strategy: I already bought my mid-life crisis car in my late 50's so I have no desire to purchase a Ferrari. If I was long the stock I would down shift and enter a sell stop at $410 to lock in gains.
Employees of TheStreet are prohibited from trading individual securities.