SoFi Technologies Is Struggling to Gain Traction
A close look at the market data for the personal finance platform shows failed rallies and prices on the defensive.
You've reached your free article limit
You've read 0 of 1 free Pro articles.
SoFi Technologies SOFI is an online personal finance company and online bank. The space seems to be a bit crowded lately and the charts are struggling to gain traction.
Let's check it out.
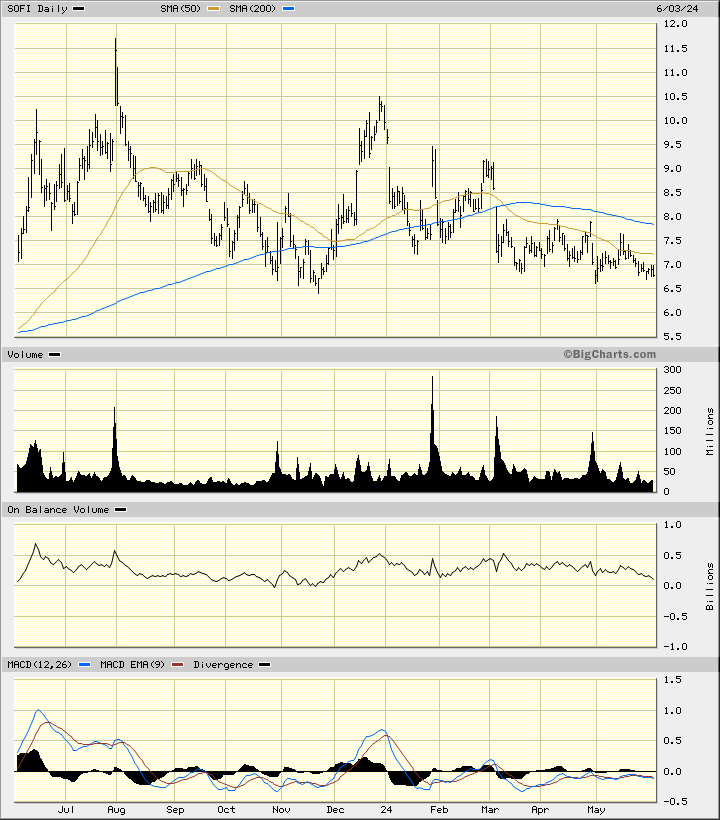
In this daily bar chart of SOFI below, I can see a number of failed rallies. Prices trade below the declining 50-day moving average line and below the declining 200-day moving average line. Trading volume looks like it has been more active since late January as traders vote with their feet. The math-driven On-Balance-Volume (OBV) line has drifted lower since January and tells me that sellers of SOFI have been more aggressive than buyers. The trend-following Moving Average Convergence Divergence (MACD) oscillator is below the zero line and has been weak since the middle of January.
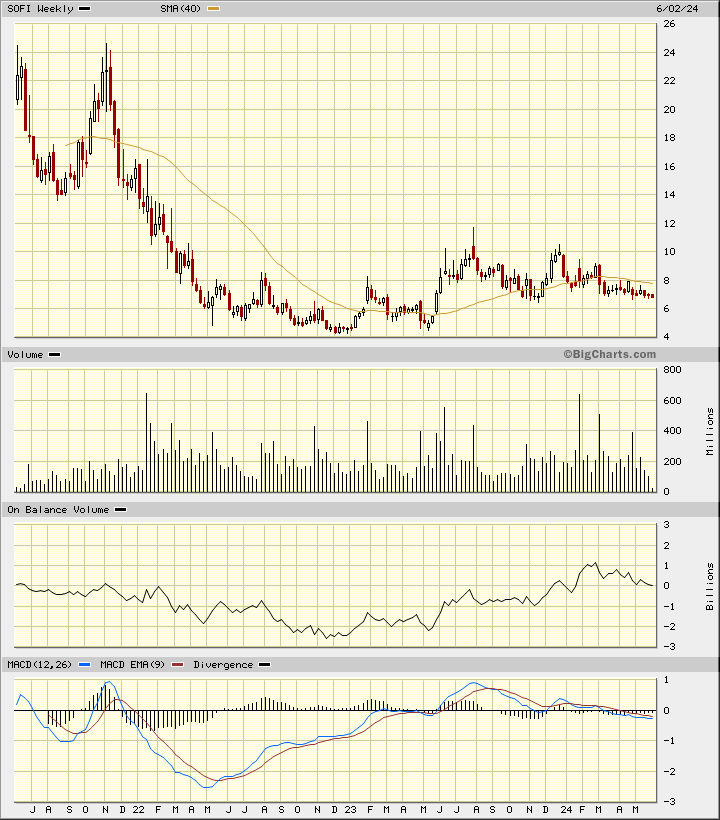
In this weekly Japanese candlestick chart of SOFI below, I can see that prices have been on the defensive since last July — notice the large upper shadow close to $12? The weekly OBV line shows weakness since February. The MACD oscillator is in a bearish alignment below the zero line. Prices trade below the declining 40-week moving average line.
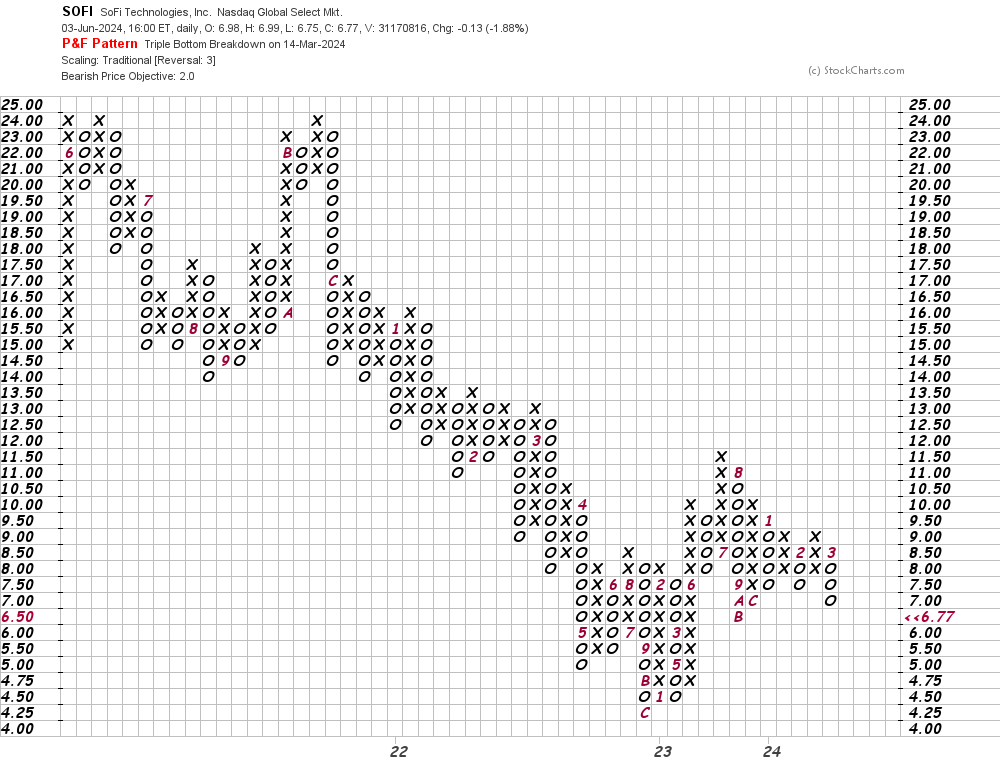
In this daily Point and Figure chart of SOFI below, I can see a downtrend and a potential downside price target in the $2 area.
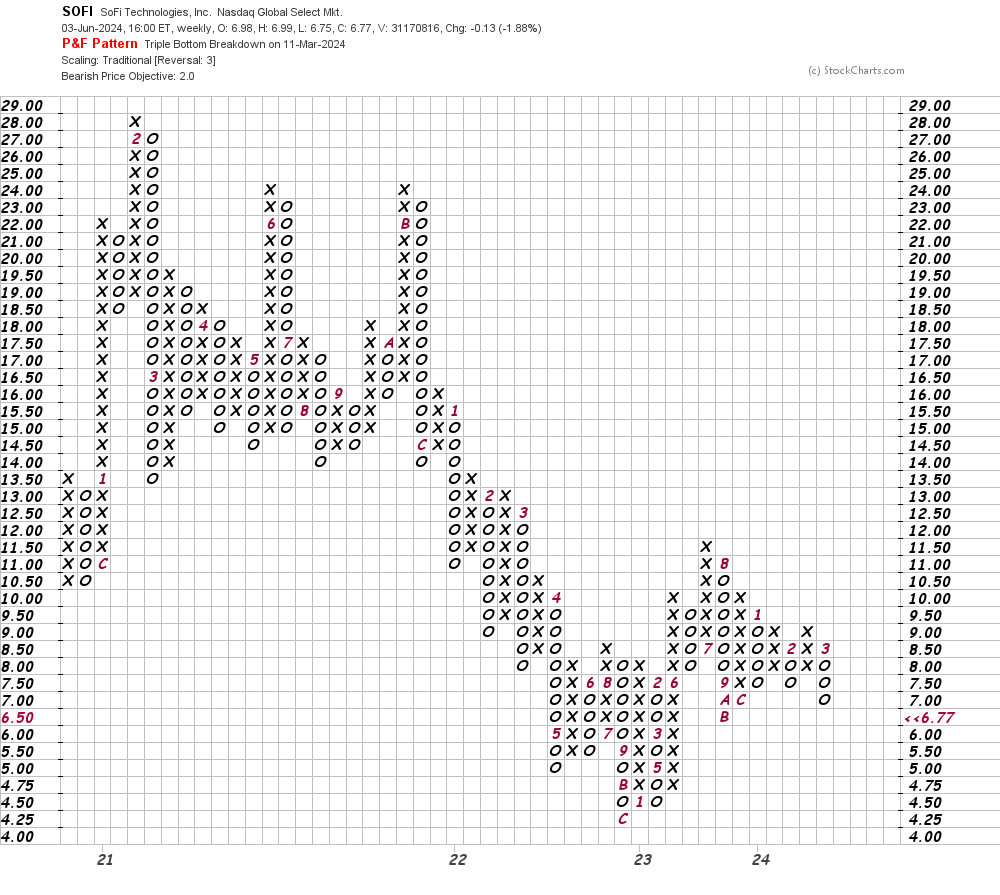
In this second Point and Figure chart of SOFI, below, I used weekly price data and can see the same $2 price target as shown on the daily chart above.
Bottom line strategy: Traders and investors should avoid the long side of SOFI as further weakness is anticipated.
Employees of TheStreet are prohibited from trading individual securities.