Smucker Is Jamming After Earnings, But There's Something Holding Me Back
Here's what the charts and indicators are telling me.
You've reached your free article limit
You've read 0 of 1 free Pro articles.
The J.M. Smucker Company SJM reported non-GAAP EPS of $2.66 Thursday morning, which beat estimates by $0.33, and revenue of $2.21B, which missed by $30M.
The stock price has rallied some 5% Thursday so let's get a butter knife and a jar of something tasty before looking at the charts and indicators.
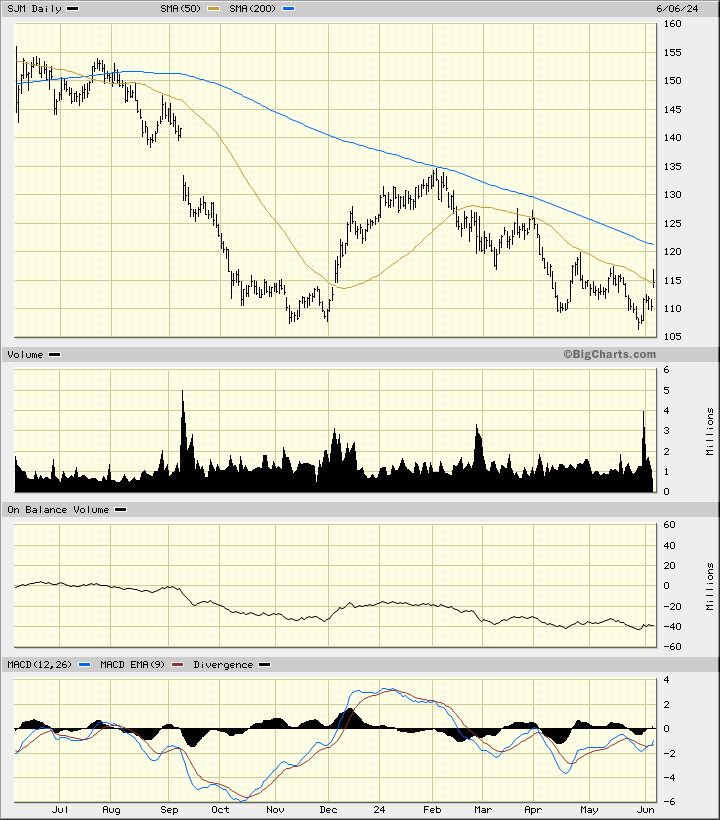
In the daily bar chart of SJM, below, I can see that share prices have been struggling for the past year. SJM has rallied Thursday to test/break the 50-day moving average line but remains below the declining 200-day moving average line.
The On-Balance-Volume (OBV) line shows us a declining pattern the past 12 months. A weak OBV line happens when there is more volume traded on down days than days when prices rally. The Moving Average Convergence Divergence (MACD) oscillator has spent most of the year below the zero line where it is now.
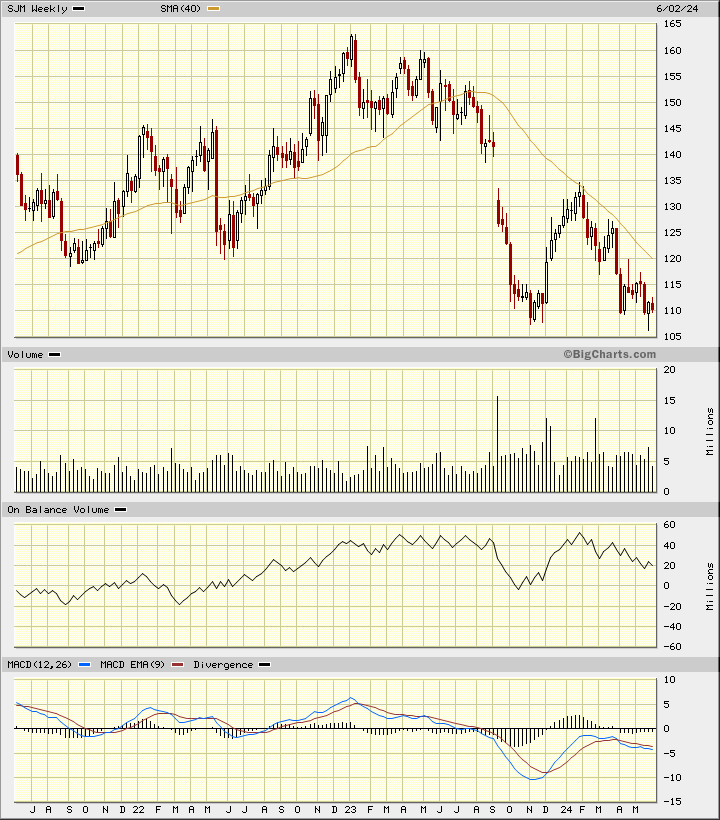
In the weekly Japanese candlestick chart of SJM, below, I can see that the shares have been weak since early 2023. Prices are trading below the declining 40-week moving average line. This line might get tested in the weeks ahead.
The OBV line has struggled the past two years and suggests that SJM may need more base building before the rally can get underway. The MACD oscillator is still in a bearish alignment below the zero line.
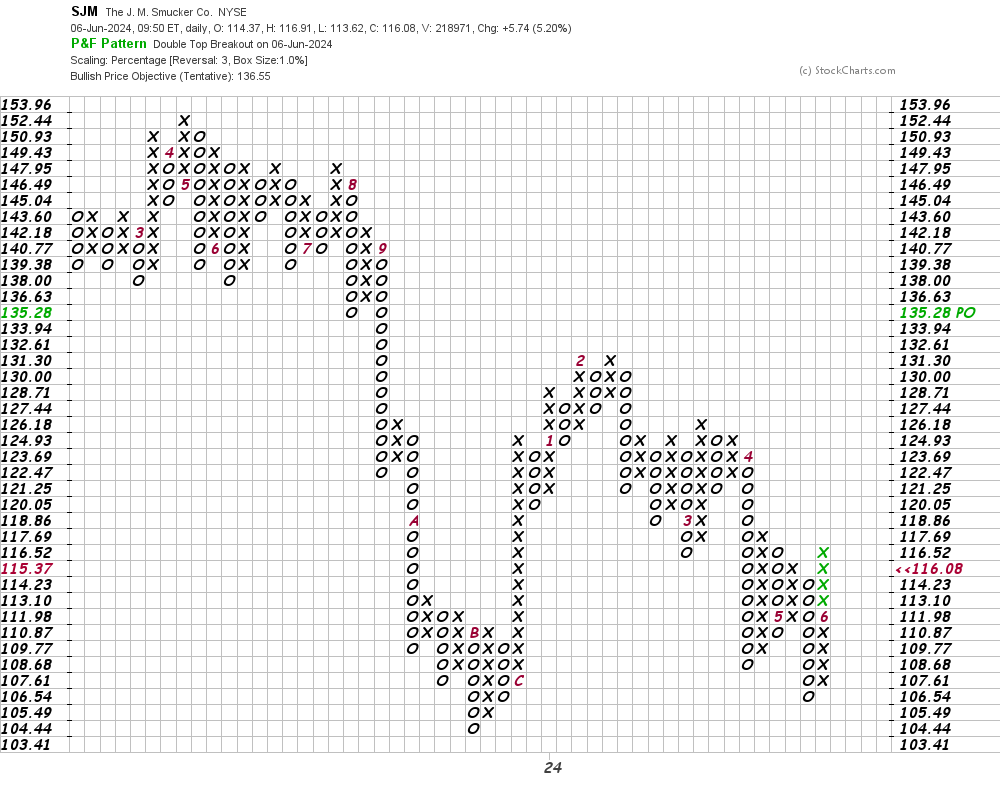
In this daily Point and Figure chart of SJM, below, I can see an upside price target in the $137 area.
In this weekly Point and Figure chart of SJM, below, I can see the same upside price target of $137 as shown on the daily chart above.
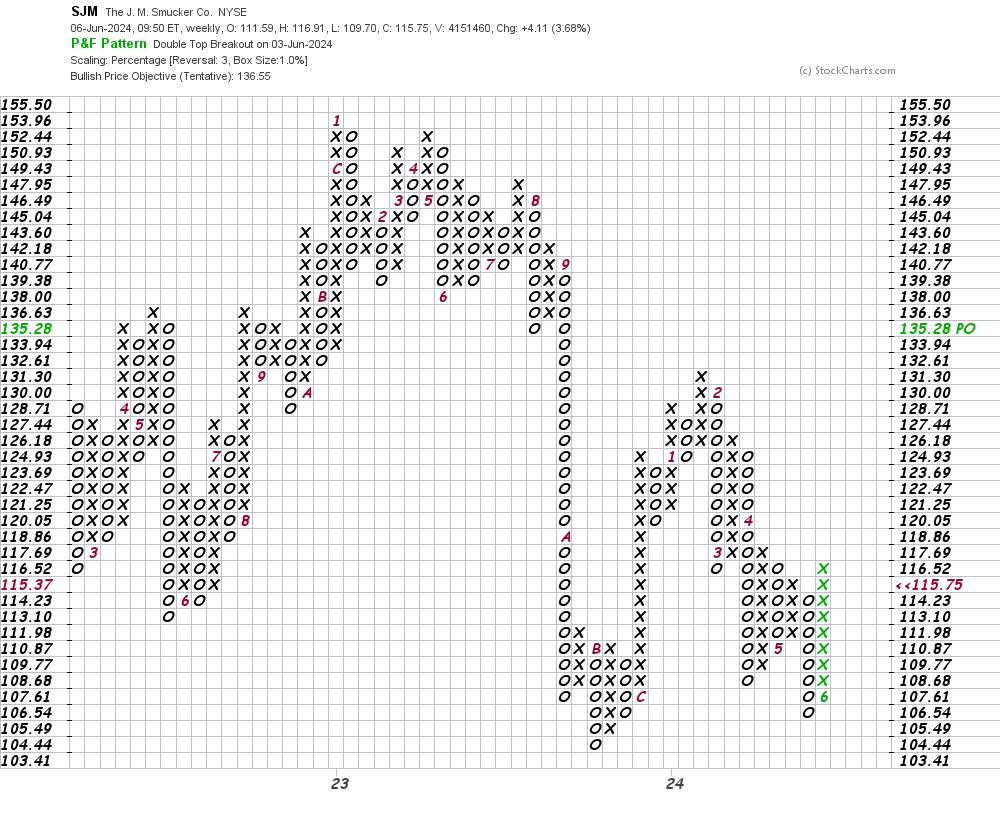
Bottom-line strategy: I can see an upside price target on the Point and Figure charts of SJM (above) but I tend to feel that the stock needs more base building on the charts before we break out the peanut butter and jelly sandwiches.
Employees of TheStreet are prohibited from trading individual securities.