Seven Up Days in a Row and Traders are Positioned for More
The S&P 500 has been up for seven days straight, leading into Fed day. Why are traders buying call options? Let's also look at KMB, FIVE, NET, F, RKLB, APP, and VRT.
You've reached your free article limit
You've read 0 of 1 free Pro articles.
The Market
With the S&P now green for seven straight days, it begs the question, are too many now thinking ‘sell the news’? I have no idea if Wednesday is the day, but I can tell you a few things.
First, the Russell is now green for five straight days, which is quite rare. The last time it went six was in June of 2023.
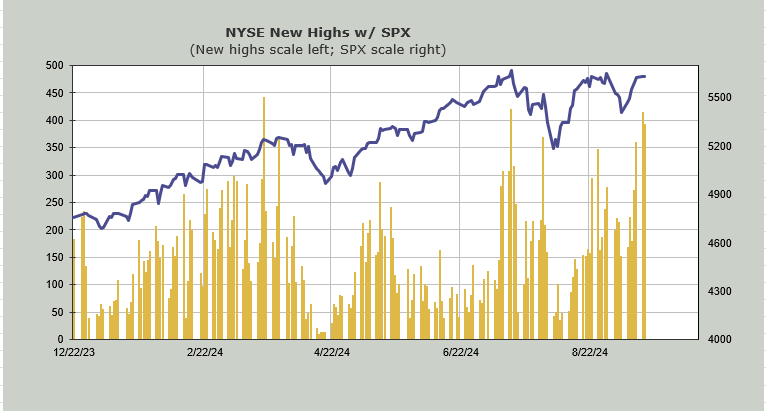
I can also tell you that despite making new intraday highs today, we had a minor drop-off in stocks making new highs. For example, the NYSE had 415 new highs yesterday, and today there were 392. It’s minor, but it is the first sign of contraction in this metric.
I can also report that most stocks have been chopping about since Friday. Look at the major indexes and with the exception of the IWM, you can see it clearly. I can also report that the put/call ratio fell to .79 today, so there are many banking on a Fed rally. Or at least that’s the premise.
And I can tell you that on a short-term basis, we are heading into an overbought condition. Whether we rally or pullback tomorrow, I still think we’re set up for a bout of volatility as we head into the end of September. Note despite the morning rally, the VIX was up again today.
I am hopeful that after a bout of volatility, we’ll get an oversold condition again.
New Ideas
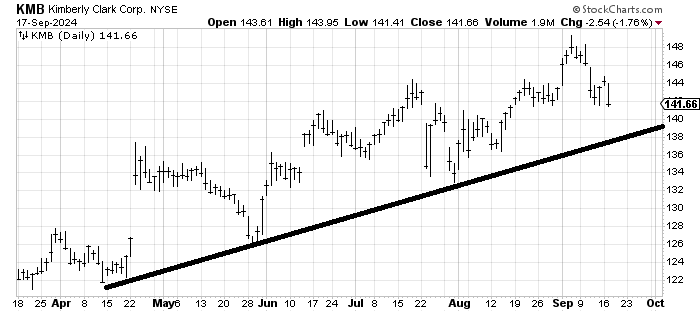
A week or two ago I highlighted the charts of Coca Cola KO and Philip Morris PM as stocks I would take profits in. KO has just milled around thus far but now I would like to show you the chart of Kimberly Clark KMB. Some of these recession stocks are rolling over.
I would say it is likely that KMB comes down to tag that uptrend line. Sure it’s only a few bucks away but it would essentially give up the entire ‘recession’ rally. Be careful with these names.
Today’s Indicator
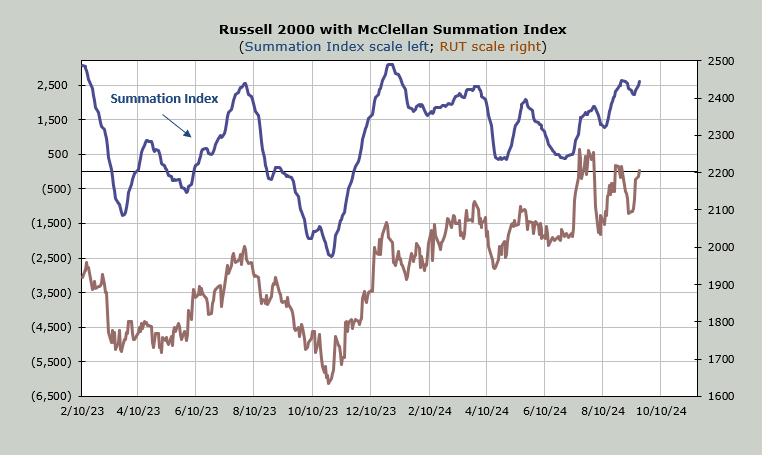
The McClellan Summation Index is still heading up. It requires a net differential of -2100 advancers minus decliners on the NYSE to halt the rise.
Q&A/Reader’s Feedback
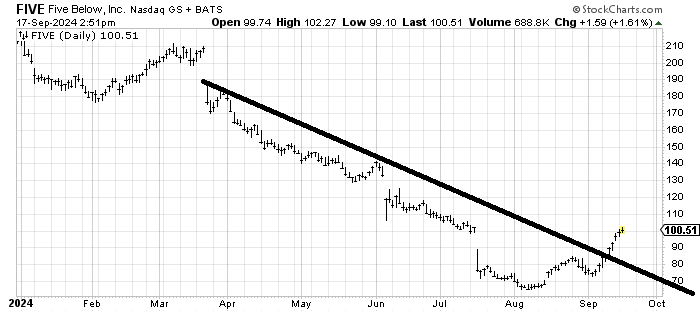
I love that Five Below FIVE crossed that down-trend line. In the near term, I do not love that it has filled that gap. If it pulls all the way back to the downtrend line, it will look bad, so it’s hard to say where you’d want to step to the plate now. I’d love to see it back near 90.
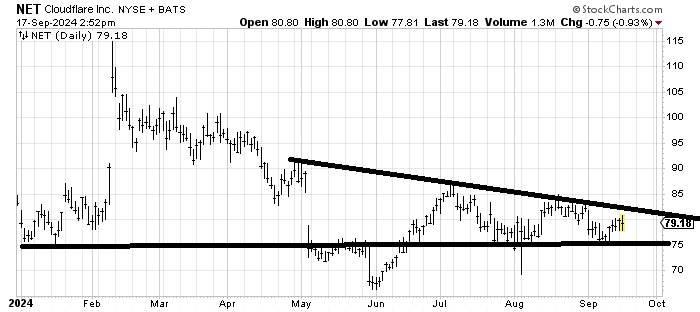
You might need some patience with Cloudflare NET, but that looks like a stock trying to bottom. The risk/reward is not terrible in that if it breaks 75, you know you are wrong. Over 85 and folks will take notice. I like it.
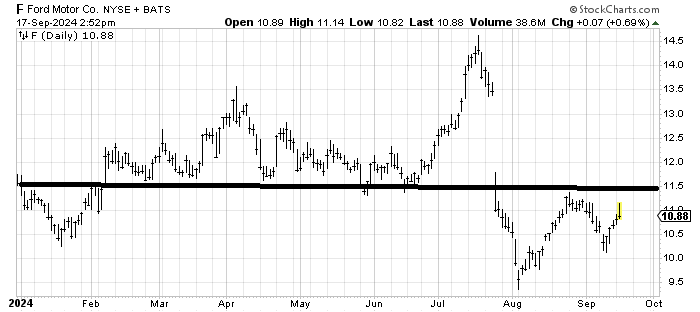
I cannot get excited over Ford F because of all that resistance that resides overhead right now. It’s also probably a candidate for tax loss selling. However, give it a few months of sideways and I can see myself warming up to it again.
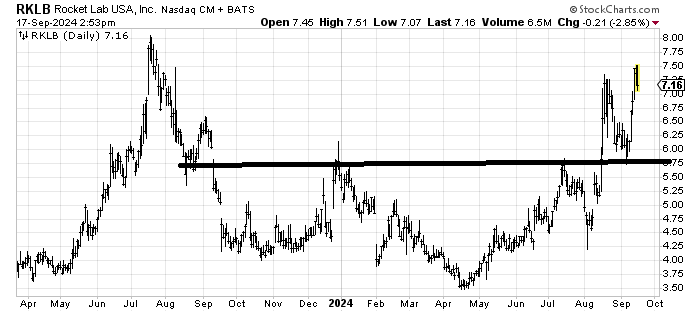
Rocket Lab RKLB has had a terrific run and it has a measured target around 7.75-8 so I’d be a profit taker up there in the near term.
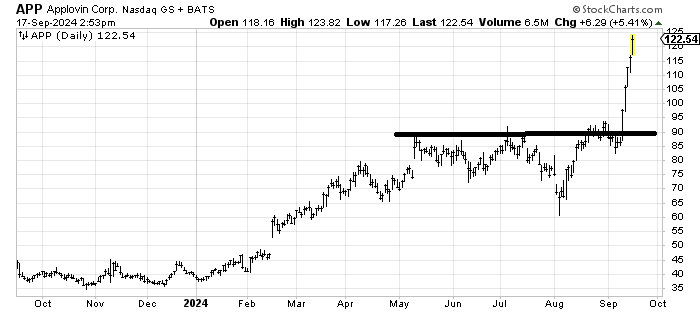
Applovin APP has met the measured target at 120, and a stock that has rocketed up as this has in the last week is vulnerable to a pullback.
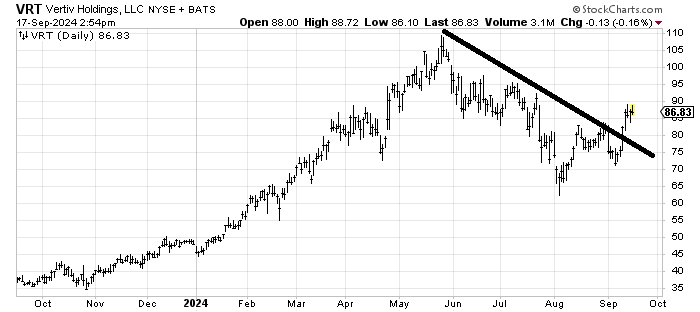
Vertiv VRT is an okay chart, but it hasn’t done enough work on the downside/sideways action for me to think it can soar through the resistance. The chart is not bearish, but I just don’t see it running away in the near term.