SentinelOne's Charts Look Like a Safe Bet
We could see higher prices for this cybersecurity company amid global tech woes.
You've reached your free article limit
You've read 0 of 1 free Pro articles.
SentinelOne S is a cybersecurity firm - so, has its "value" gone up after the overnight technical outage?
Let's check out the charts and indicators.
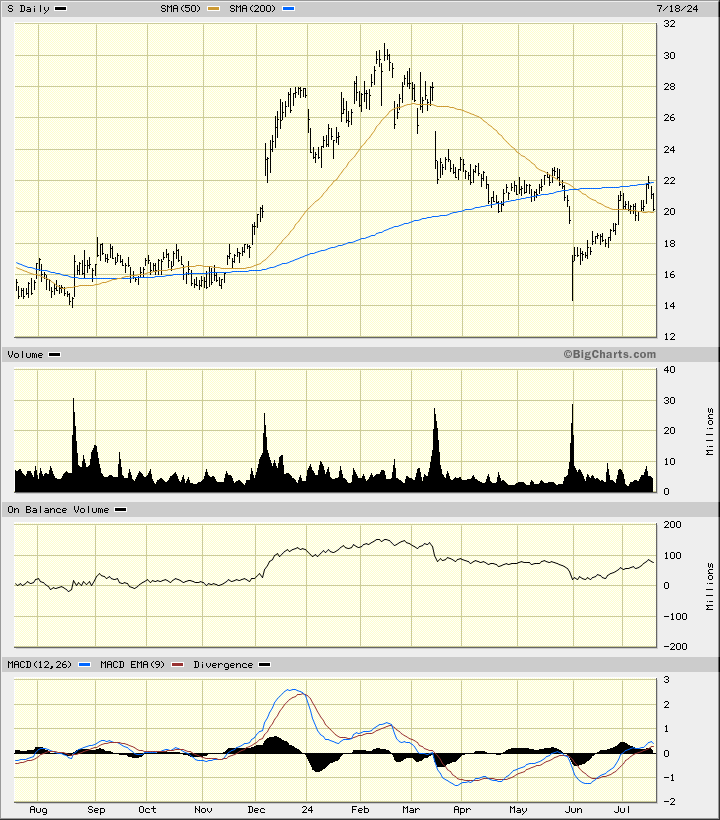
In this daily bar chart of S, below, I can see that prices surged higher from November to March and then quickly retreated, giving back all the price gains. Prices are trading now between the 50-day line and the 200-day line. A sharp decline into early June marks a low. The On-Balance-Volume (OBV) line has moved up and down with the price action the past year. The Moving Average Convergence Divergence (MACD) oscillator is now slightly above the zero-line.
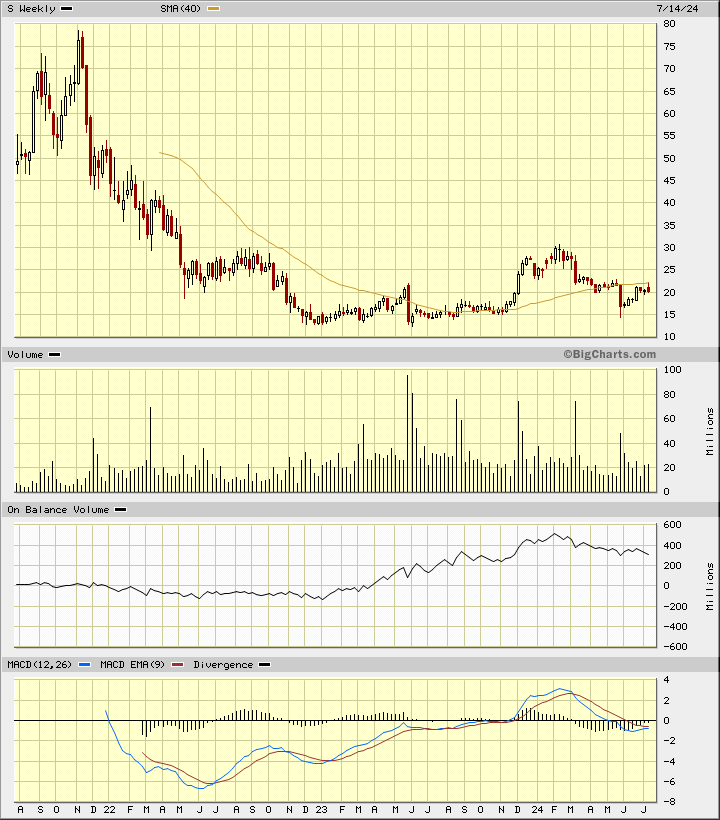
In this weekly Japanese candlestick chart of S, below, I see a bottoming pattern. Prices made a long decline and then found buying interest (support) in the $15 area. The slope of the 40-week moving average line is positive and prices could rally and close above it today. The weekly OBV line has weakened since February but could start to reverse and turn higher. The MACD oscillator is poised for a crossover and cover-shorts buy signal.
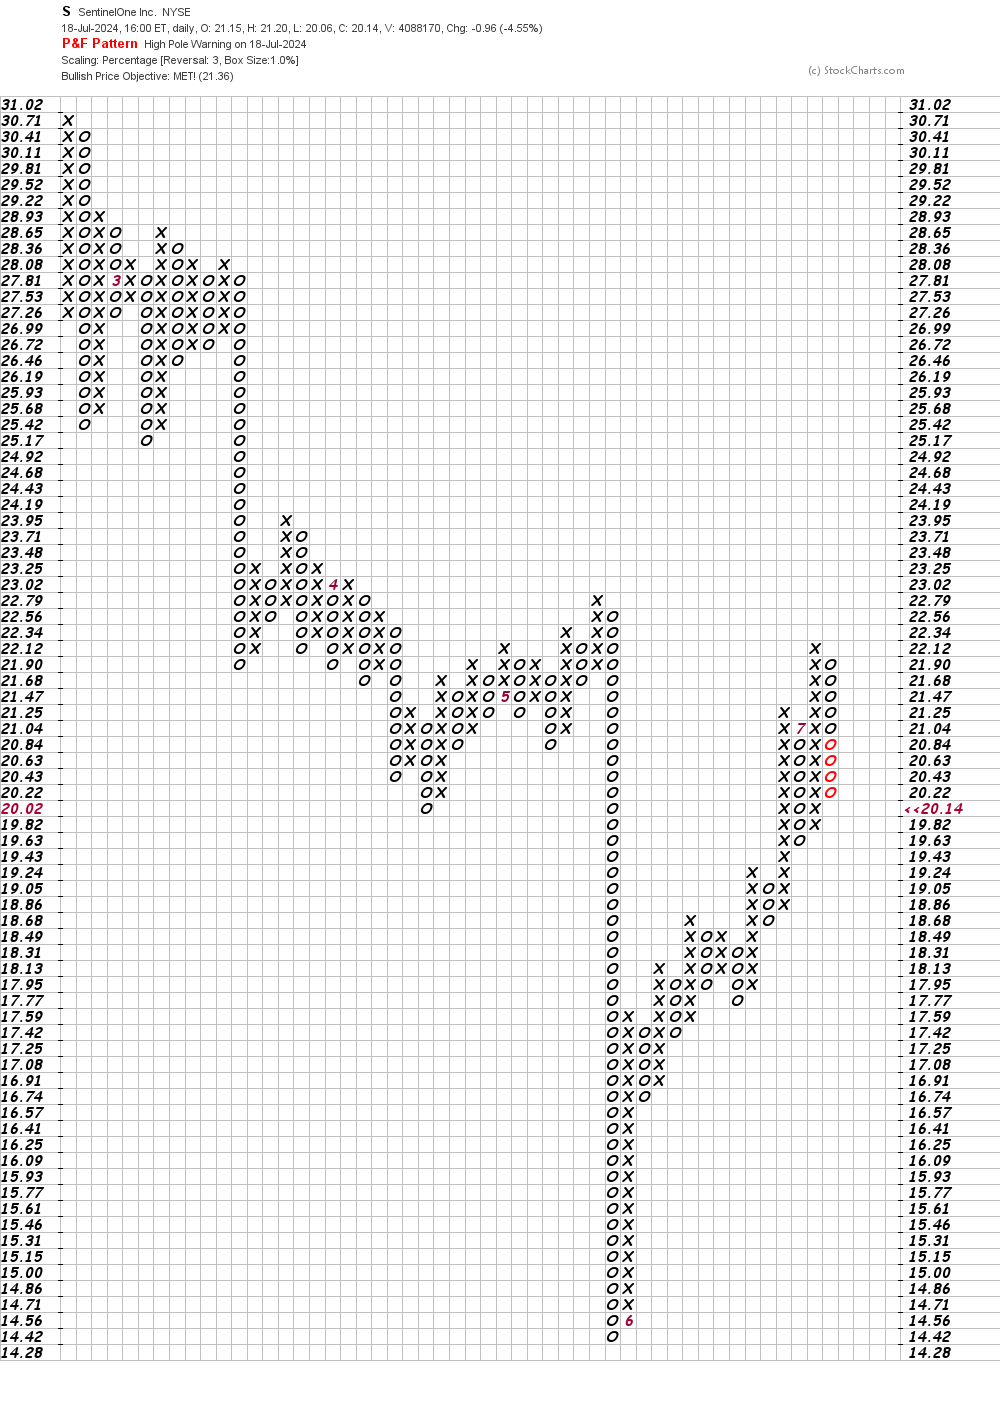
In this daily Point and Figure chart of S, below, I can see that prices reached a downside price target in the $21 area.
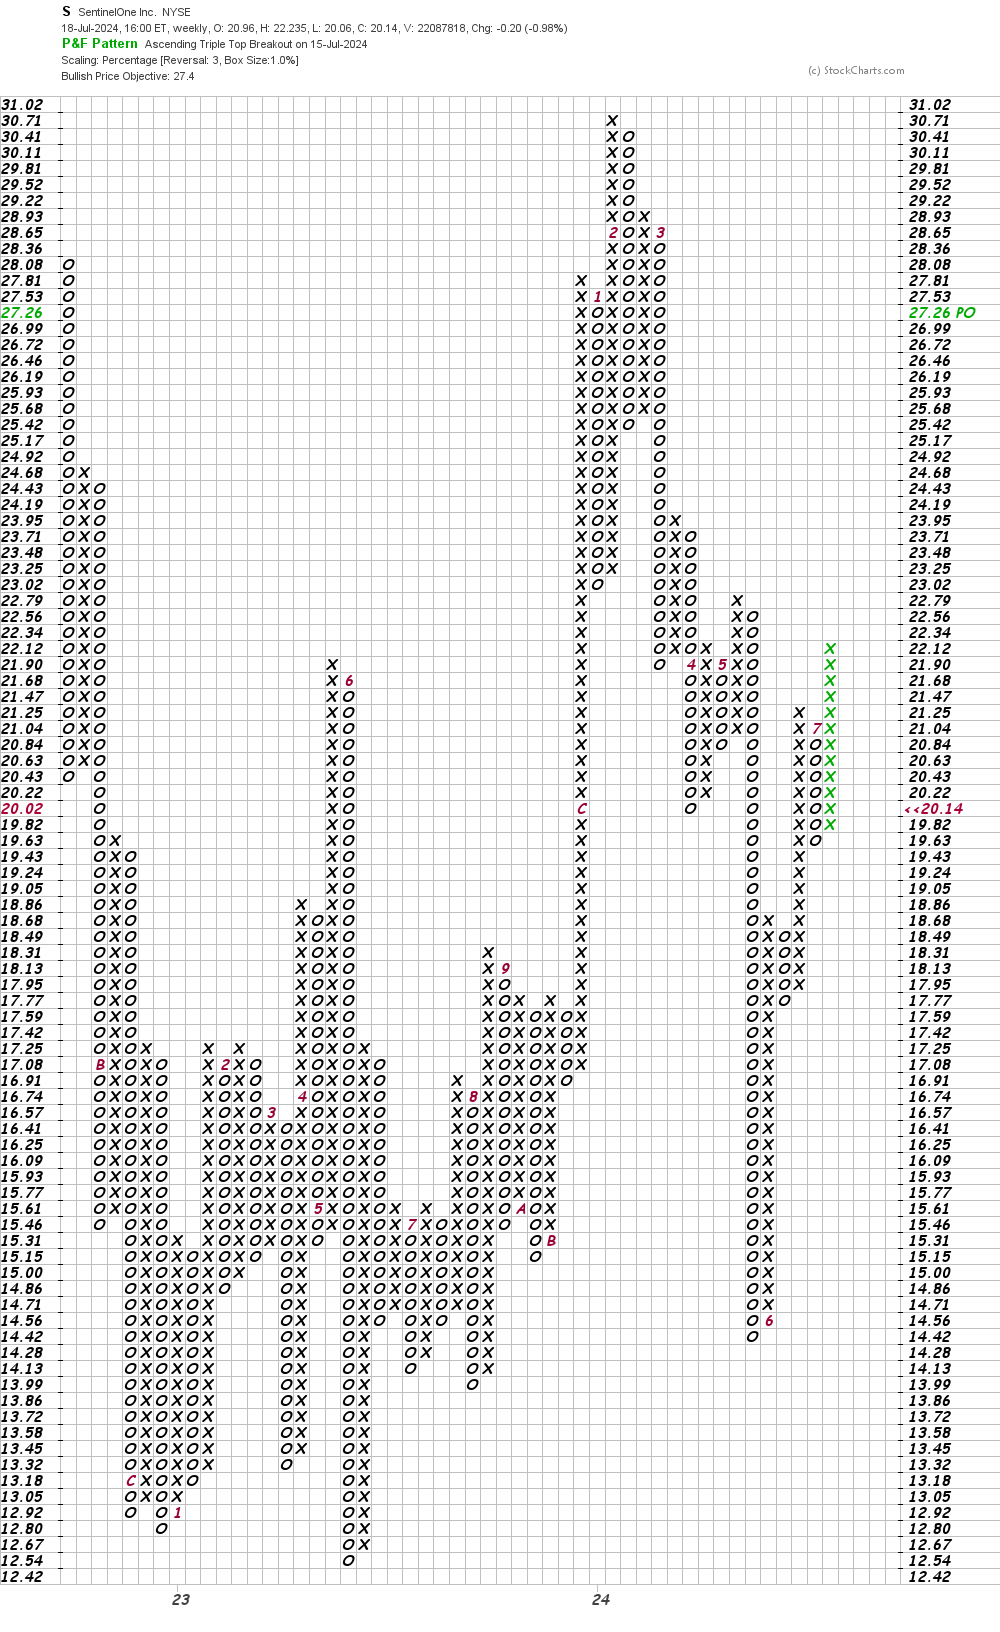
In this weekly Point and Figure chart of S, below, I can see a potential upside price target in the $27 area.
Bottom line strategy: Last year some people suggested that S could be "in play" and sold. Will those ideas circulate again? I have no idea but the charts and indicators now support further price gains.
Employees of TheStreet are prohibited from trading individual securities.