SanDisk Hits Magic Number; Semis Surge; Marvell, Micron Jump
How should we approach SanDisk now that it hit our price target? Also, let’s chart the market to see if it’s our ‘cup’ of tea….
You've reached your free article limit
You've read 0 of 1 free Pro articles.

Walking on the Moon
Giant steps are what you take
Walking on the moon
I hope my leg don’t break
Walking on the moon
We could walk forever
Walking on the moon
We could live together
Walking on, walking on the moon
-Gordon Summer, aka Sting (The Police), 1979
The Man in The Darkened Window
Always there. Every single business day, I get to my desk by 4 a.m. ET at the latest, often earlier. He’s always there to bounce my ideas off of. The man in the darkened window. Quiet. Handsome. Moved down from New York to Florida exactly when I did. Mirrors my every move.
Disappears every day with the rising sun only to reappear at night when I return to my desk to prepare for the next day. Return to your desk? Yes, after dinner. Everyone envies Wall Street until they find out how much work Wall Street is. Don’t remember ever working less than 70 hours a week. When I was young 120-plus hours was not rare. Algorithms have robbed younger generations of that learning experience. AI will take whatever those algos had left for the remaining humans to fight over.
That’s why when I was young everyone on Wall Street either came from the military or at least played team sports at a decent level. You did not really have to be book smart, but you did have to have a quick mind, and you did need discipline. The man in the window has been there throughout a now long career. Looking at charts. Going over news stories. Strategizing.
Hey, Man in the Darkened window, should we be in SpaceX (SPCX)? Seems pretty obvious now that we should have put in for a retail allocation. Well, no crying over spilled milk. IPOs can be hit or miss. Over the course of 40-plus years, I am relatively certain that unless acting as the book runner and therefore not using my own dough, skipping the first few days of IPOs in general has worked out for the better. Market sure is getting exciting, ain’t it, dude? Just a nod. Never get more than that. Such a smart guy.
Monday Funday
Equity markets appear to be playing out almost precisely as we had worked things out here at TheStreet PRO’s Market Recon. Thank goodness. Our day-to-day charting has (knock wood) been a literal guide to surviving and thriving in these markets over the past six months or so.
On Monday, the S&P 500 ripped 1.65% higher, while the Nasdaq Composite screamed ahead for a gain of 3.07%. The Dow Transports tripped up for a loss of 1.09% for obvious reasons as the planet rejoiced at the greatly improved prospects for peace in the Middle East and the reopening of commercial maritime passage throughout that area.
Small-to-midcap equity indexes underperformed and dragged on the broader marketplace. Those indexes all gained between 0.03% and 0.72%. The banks did not do so well either as the prospect for higher interest rates faded along with the probabilities for higher inflation. Technology, in specific, the semiconductors were the stars on Monday.
The Philadelphia Semiconductor Index gained an impressive 5.45% on Monday as the Dow Jones U.S. Semiconductor Index tacked on 4.54%. The group was led by Micron Technology (MU) and Marvell Technology (MRVL). Those two names added 10.8% and 10.4% respectively. Rah!
Breadth
Breadth cooled on Monday as the day wore on, but was in actuality, especially where it counted, better than many in the financial media made it out to be. Seven of the 11 S&P sector SPDR ETFs closed out the day in the green, led obviously by tech (XLK) and followed by the discretionaries (XLY) and the industrials (XLI). energy (XLE) just as obviously, led the losers followed by the REITs (XLE).
What was clear was this:. Growth led the cyclicals and defensives trailed badly. That’s about as optimistic a market and economic setup as we ever get on Wall Street. A couple more days like Monday and we’ll all be going on expensive vacations this summer.
Winners only beat losers by a five-to-four margin at the NYSE, but the NYSE was not where the action was on Monday so don’t let that spread fool you. Winners beat losers by a rough five-to-three at the Nasdaq. Advancing volume took only a 52% share of composite NYSE-listed activity, but a much more impressive 71.9% of composite Nasdaq-listed volume. Rah.
Most importantly, the professionals participated. Aggregate trading volume was indeed higher on a day over day basis across NYSE-listings, across Nasdaq-listings and across the membership of the S&P 500. You kids know that that means…
The Chart
Yes, kids… Monday ended as a “confirmation day” of the bullish trend. Trading volume returned after the required one-day professional pause. Relative strength continues to improve and is now in “robust” territory without being technically overbought. In addition, a still “not so hot” daily moving average convergence divergence has improved its look across every single metric.
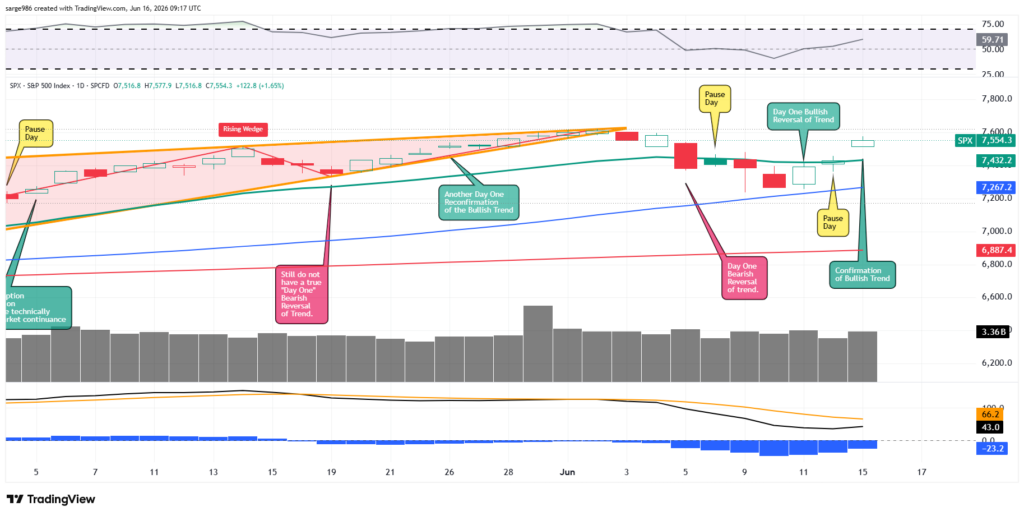
We see the histogram of the 9-day exponential moving average cross into positive territory and / or the 12-day exponential moving average cross above the 26-day EMA with both above zero? We’re going to see an algorithmic feeding frenzy. Any warnings on the chart? Yes, actually. The past week has developed what looks like a “mini-cup” pattern. A handle could be added, which while negative, would be an opportunity for investors / traders.
You Kids Catch Reider?
Rick Reider, who is BlackRock’s (BLK) global fixed income chief investment officer, appeared on Bloomberg TV on Monday. Reider was a contender to the position of Fed Chair earlier this year before that position went to former Fed Gov. Kevin Warsh. He is someone I have always considered to be extraordinarily bright and someone I have appeared on television with many times. I have always valued his opinions.
On Monday, Reider said, “There is so much cash that’s sitting on the sidelines” in reference to the $8 trillion to $9 trillion recently held in money market funds and went on to discuss the deployment of that capital. Reider added, “Once that (deployment) has happened, all of the sudden it unlocks this cash, particularly when you get a good piece of news (the peace deal, reduced chances for inflation & higher rates) and people say ‘gosh, I can get into the pool’ and it’s pretty explosive when you see it happen.”
On the Fed, Reider, who I wholeheartedly agree with on this matter, argued that the central bank should avoid raising short-term interest rates. He also implied that in his opinion, new Chair Kevin Warsh should probably focus on balance sheet management and nuanced control over the money supply rather than on the overnight Fed Funds Rate as a means toward influencing longer-term rates and economic activity. This dude, my friends, actually gets it.
Go, SanDisk, Go!!!
You kids remember when I gave you the memory / storage basket? Did you act? You kids remember when I put a $2,100 target price on SanDisk (SNDK)? Did you act? On Monday, SanDisk closed with a $2,107 handle. If you’ve been with me for more than a few minutes, you know the rules. We act at target prices and panic points, and we move on with the balance of the position. Psst… This beast is up a rough 792% in 2026 and up about 7,385% from the stock’s 2025 low of $27.89. Rock on. No, I wasn’t in it from those lows, but I do know how to ride a trend.
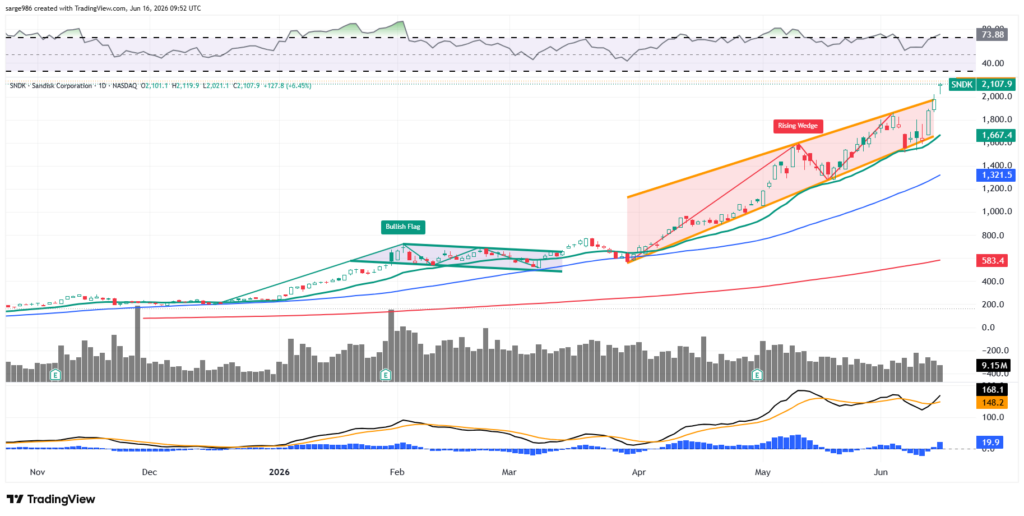
Readers will see that back in early 2026, SNDK rallied out of a bullish flag pattern, which is a pattern of trend continuance. From April through June, the stock developed what looks to me to be a rising wedge pattern of bearish reversal. On Friday and Monday, SNDK has tried to break out of this pattern to the upside. Remember, when a stock successfully executes a bullish breakout from a bearish pattern, the move is often quite explosive.
SNDK has used its 21-day EMA as support for three solid months and has not even come close to testing its other key moving averages throughout this stretch. Looking at the indicators, relative strength is currently quite robust and is flirting with entering into technically overbought territory. Below the chart, the daily MACD is postured quite bullishly. The histogram of the 9-day EMA has moved above the neutral line. Additionally, the 12-day EMA has crossed above the 26-day EMA with both of those lines already well into positive territory. This continues, in my opinion, to be a bullish set-up.
Target Price: $2,425 (Up from $2,100)
Pivot: $1861 (June 3rd high)
Add: On breakout from bearish pattern
Panic: Loss of 21-day EMA (currently $1,667)
Economics (All Times Eastern)
08:15 – ADP Employment Change (Weekly): Last 29K.
08:30 – Housing Starts (May): Expecting 1.43M, Last 1.465M SAAR.
08:30 – Building Permits (May): Expecting 1.415M, Last 1.423M SAAR.
08:30 – Export Prices (May): Expecting 2.1% m/m, Last 3.3% m/m.
08:30 – Import Prices (May): Expecting 1.1% m/m, Last 1.9% m/m.
08:55 – Redbook (Weekly): Last 9.1% y/y.
1:00 p.m. – Twenty-Year Bond Auction: $13B.
4:30 – API Oil Inventories (Weekly): Last -9.119M.
The Fed (All Times Eastern)
Fed Blackout Period.
Today’s Earnings Highlights (Consensus EPS Expectations)
Before the Open: WLY (1.65)
After the Close: LZB (.82)
At the time of publication, long MU, SNDK equity.
