The Window Is Still Open for the Others, But It's Hard to Trust This Market
Let's examine what's been happening (and not) while I've been away, including with volume, sentiment, and a telling anecdotal sign. Plus, a look at Tesla and I catch up on your requests.
You've reached your free article limit
You've read 0 of 1 free Pro articles.
The Market
The window was open for "the others" to rally and you know what happened? A handful of the others rallied but the index movers rallied a lot more. The window is still open but markets that don’t rally when they should and have been weak and have sentiment too bullish are ones we should not place much trust in.
The intermediate-term indicators are still oversold. The short-term indicators are more mixed: not quite overbought but not oversold anymore.
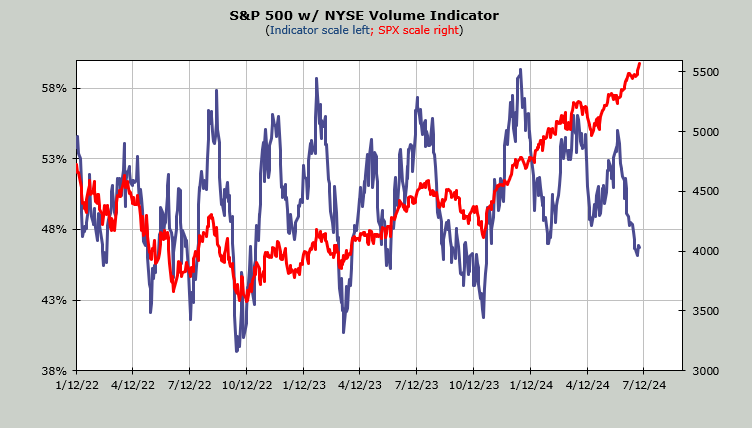
For example, the Volume Indicator got to 46%, which is the lowest since October (when it got to 42%). That does not speak of strength. And I am not talking about small-caps here, I am talking about all stocks on the NYSE. This indicator means that when you add up all the upside volume (as a percentage of total volume) on the NYSE over the last 30 days it is at 46%. With the S&P 500 at new highs.
Then there is sentiment. The DSI for the VIX got back to 10. The S&P is back at 83 while the Nasdaq is at 85. Once over 85 it’s a yellow flashing sign. Over 90 is red. Ten for the VIX is already flashing yellow while single digits will turn it into a red flasher.
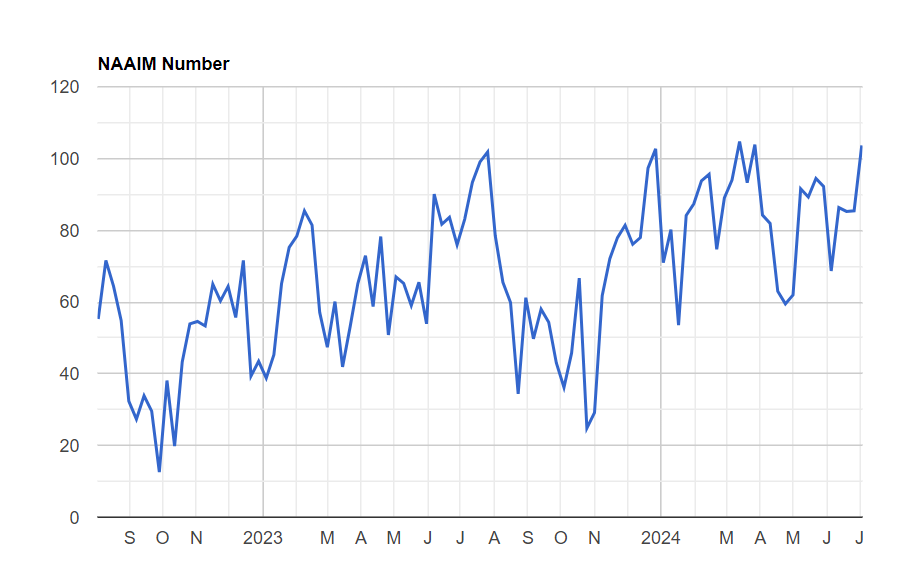
If that’s not enough, the National Association of Active Investment Managers (NAAIM) exposure is back over 100. And we all know their exposure is not in those down-and-out names, it’s in the index movers. If they had been buying the others that Volume Indicator would not be sitting at 46%.
And while I know it’s anecdotal, in the two weeks I was gone the S&P rallied 100 points and I had not one chart go off the top of the page. Not one. But I did have two go off the bottom with a third one threatening to do so.
Finally, please notice that the SOX has not made a new high. Nor have the Banks. Both groups have been leaders this year.
New Ideas
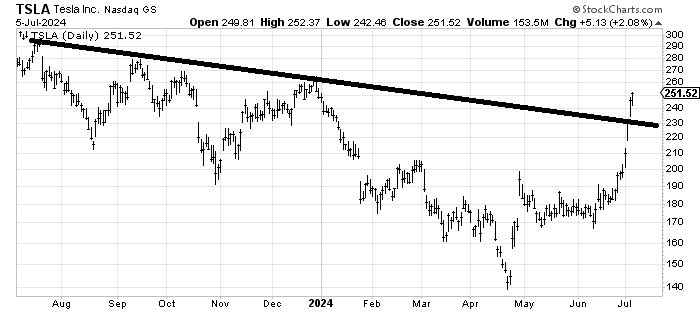
We got quite lucky recently with the recommendation on Tesla TSLA. I have a first target in the $260-ish area. I suspect the first pullback (to the line, so call it $230-ish) gets bought.
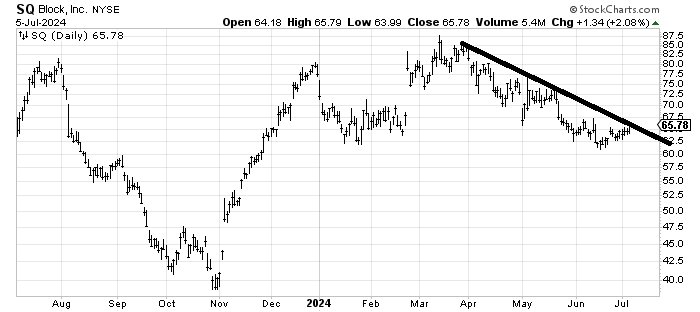
Here’s a good test for one of "the others." Square, err, Block SQ is starting to curl under. It desperately needs to cross that downtrend line to show us it wants to rally but that’s the type of stock I have my eye on.
Today’s Indicator
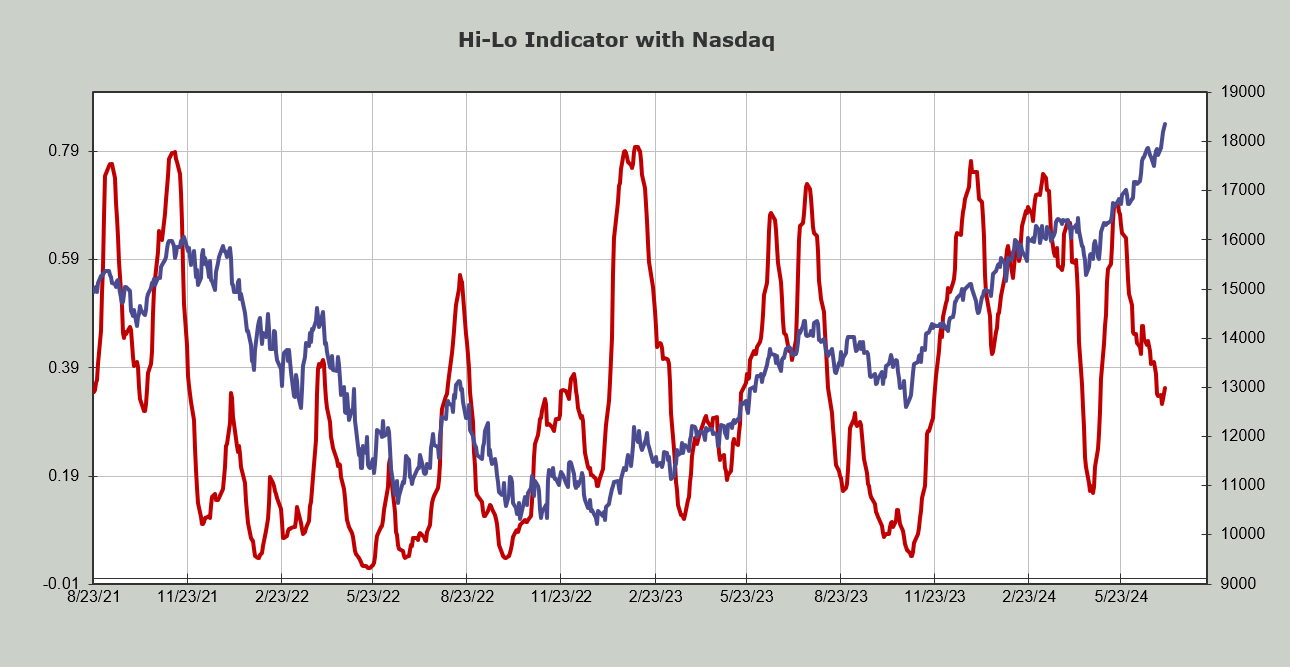
The Hi-Lo Indicator turned up. Can it stay up? We’ll see since Friday the Nasdaq saw more new lows than highs.
Q&A/Reader’s Feedback
Helene welcomes your questions about Top Stocks and her charting strategy and techniques. Please send an email directly to Helene with your questions. However, please remember that TheStreet.com Top Stocks is not intended to provide personalized investment advice. Email Helene here.
It’s a long list (yay!) but I have been gone and the requests build up. I welcome your requests.
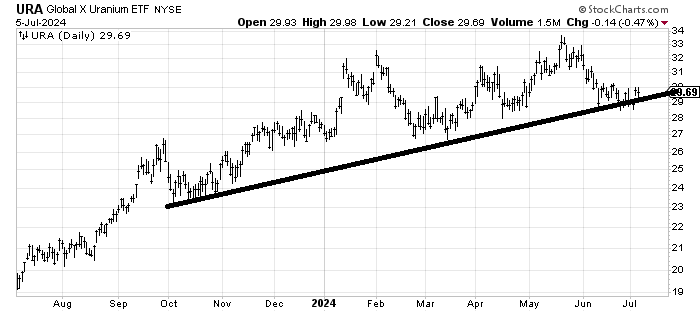
The Global X Uranium ETF URA is hanging by a thread but this is the type of chart that really should rally. I would give it a bit of leeway to stay over $28 but if it can get over $30 maybe it has some legs.
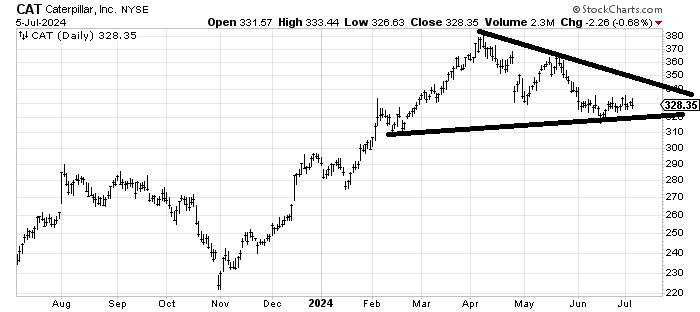
I don’t love Caterpillar CAT because it is so far away from the downtrend line. If you want to bottom fish it then under $320 and you are very wrong.
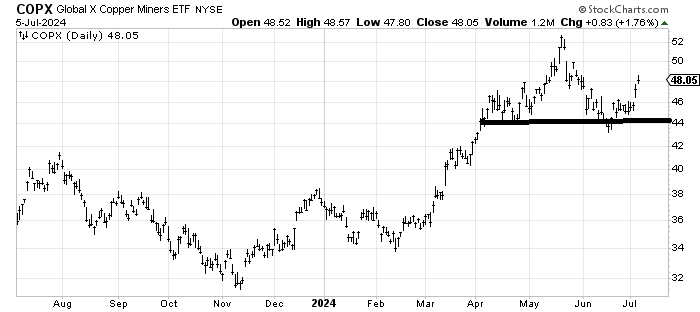
We revisited Global X Copper Miners COPX, an ETF to be long the copper miners, recently with a more positive eye. It has rallied. But now I would say if it trades back under $46 I want out; otherwise the target is that gap around $52.
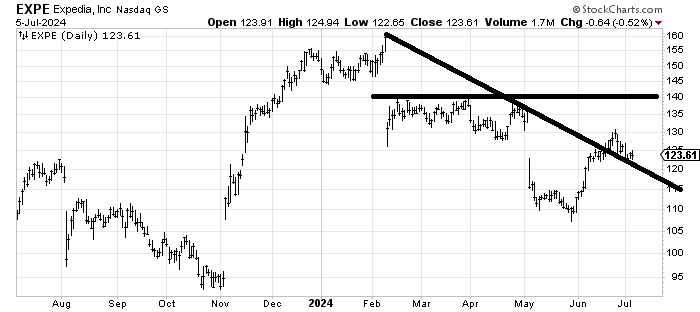
Expedia EXPE should rally from here. I am inclined to be a seller if it can get to $130-135.
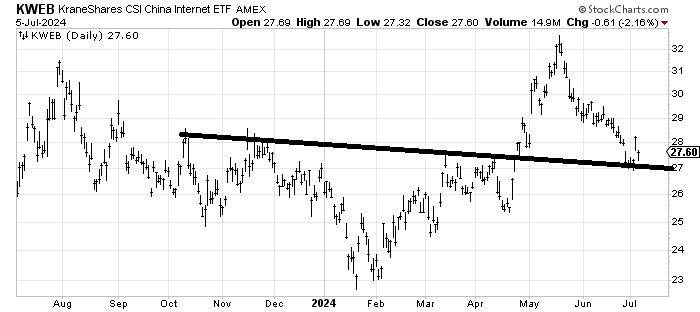
For months I have said I would be a buyer of KraneShares CSI China Internet ETF KWEB back in the $27-28 area and I will stick by that view for the time being. If it trades much under $26 I will declare myself wrong.
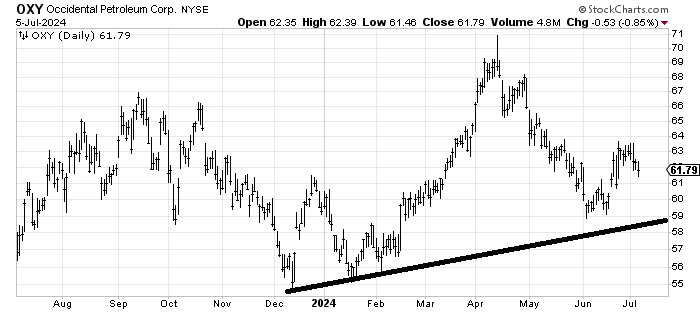
If Occidental Petroleum OXY comes down to that line ($58-59) I would be a buyer. The stock almost always seems to rally from the $55-58 area.
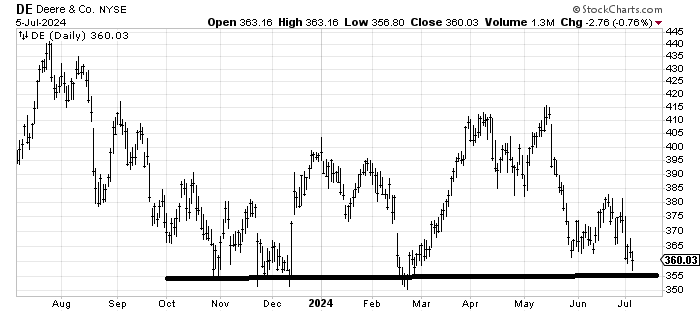
Deere DE has a lot of support down here but aside from being oversold the chart doesn’t show me much that it is dying to rally well. I’d call it oversold enough to rally with a good stop under $350-ish.
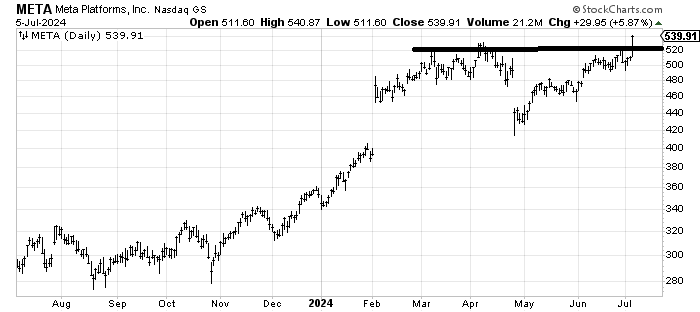
That does look like a breakout in Meta META but I am terrible at chasing. So I will simply note that it measures to the $625 area.