Projecting Price Movement for Crude Oil as War, Economic Recession Loom
As macro factors promise to impact the price of crude oil, what's next for the closely-watched commodity?
You've reached your free article limit
You've read 0 of 1 free Pro articles.
Millions of people track the price of West Texas Intermediate WTI and many also track the price of brent crude. It may well be the most closely-followed commodity. Events in the Middle East seem to be getting closer to a full-blown regional conflict — aka, war — as the various sides seem to have hardened their positions (no, I am not a military expert).
Let's check out the charts and indicators to project what's next for the commodity.
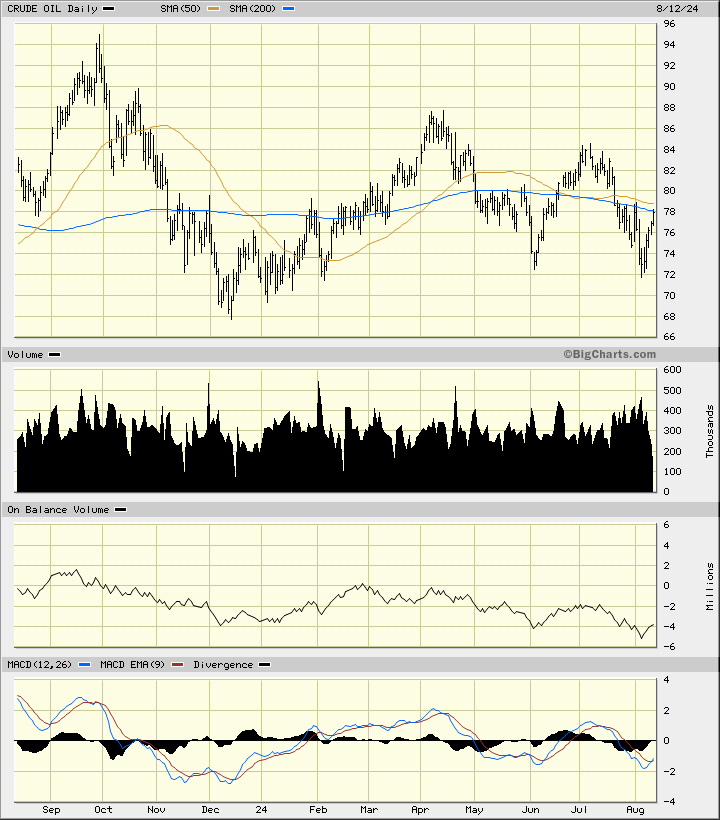
In this daily bar chart of WTI below, I can see a choppy sideways trading range for prices. WTI has crossed above and below the 50-day and 200-day moving average lines several times. Trading volume has remained active the past year but the On-Balance-Volume (OBV) line shows us weakness from September to August.
A declining OBV line happens when there is more volume traded on days when prices close lower on the day than when prices close higher on the day. The trend-following Moving Average Convergence Divergence (MACD) oscillator is crossing to upside from below the zero line for a cover shorts buy signal. Crossing above the zero line would give us an outright buy signal.
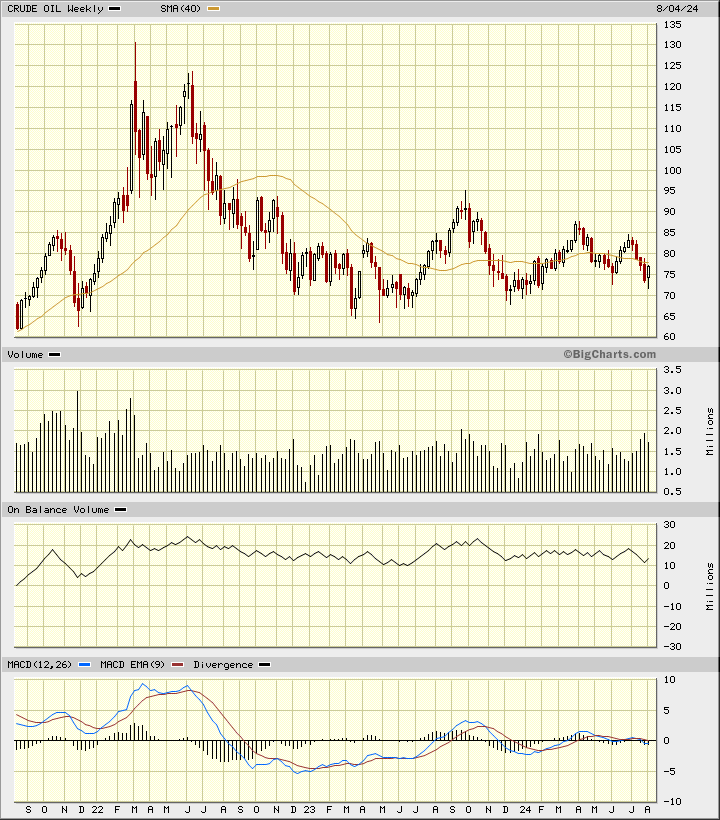
In this weekly Japanese candlestick chart WTI below, I can see a decline followed by a long sideways pattern. The chart pattern may well be an equilateral triangle. This kind of triangle can result in an upside breakout or downside breakout. An upside move could happen with Mideast oil production getting disrupted or from shipping lanes becoming targets in a wider conflict. A downside move could happen if energy needs slowed globally. The most recent weekly candlestick pattern has a lower shadow suggesting that traders have rejected the lows. We'll have to see if strength continues this week.
This triangle formation (noted above) is due for a breakout, maybe overdue for a breakout.
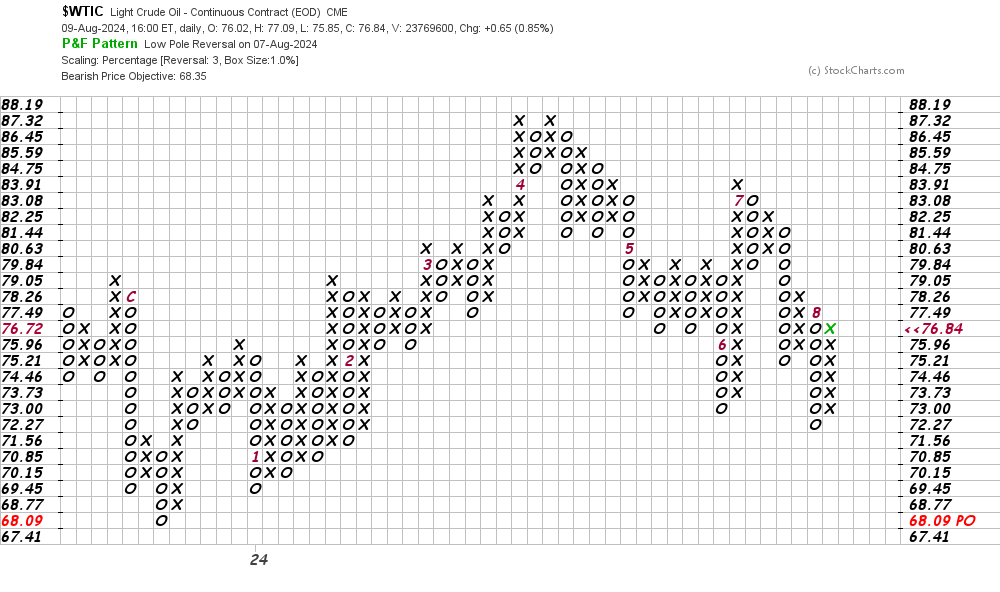
In this daily Point and Figure chart of the continuous light crude futures contract below, I can see a potential downside price target in the $68 area.
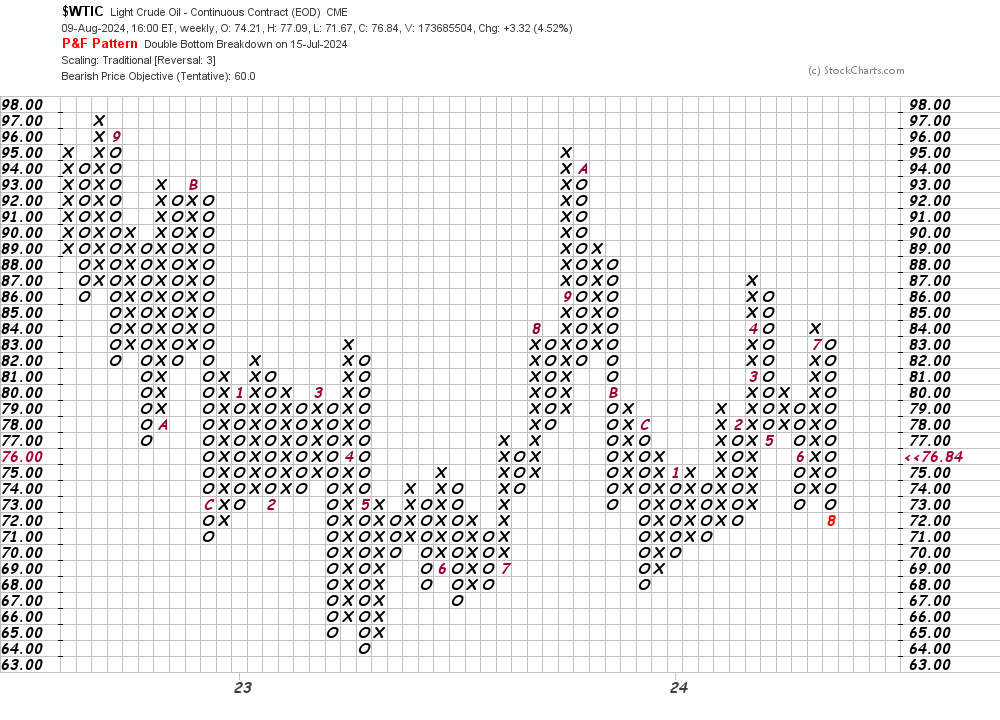
In this weekly Point and Figure chart of the continuous light crude futures contract below, I can see a potential downside price target in the $60 area. This would mean lower prices for gasoline at the pump, but does that mean that the U.S. is going into a recession?
Bottom line strategy: Again, I am not expert on oil or the Middle East. Maybe we should check in with Daniel Yergin. In the meantime, there is upside and downside risk on the charts.
Employees of TheStreet are prohibited from trading individual securities.