Pfizer Is No Longer a Bitter Pill to Swallow
Let's check the charts and indicators for any side effects.
You've reached your free article limit
You've read 0 of 1 free Pro articles.
When I reviewed pharmaceutical giant Pfizer PFE on June 4, I wrote that "Aggressive traders could go long PFE on strength above $29.81. Risk a close below the 50-day moving average line. The $38 area is my price target for now."
The stock rose on news the drugmaker is looking to be a factor in the growing market for obesity drugs with a once-daily weight loss pill.
Pfizer shares touched $29.23 earlier this Thursday and are trading above the bottoming 200-day moving average line. Let's check the charts and indicators one more time for any side effects.
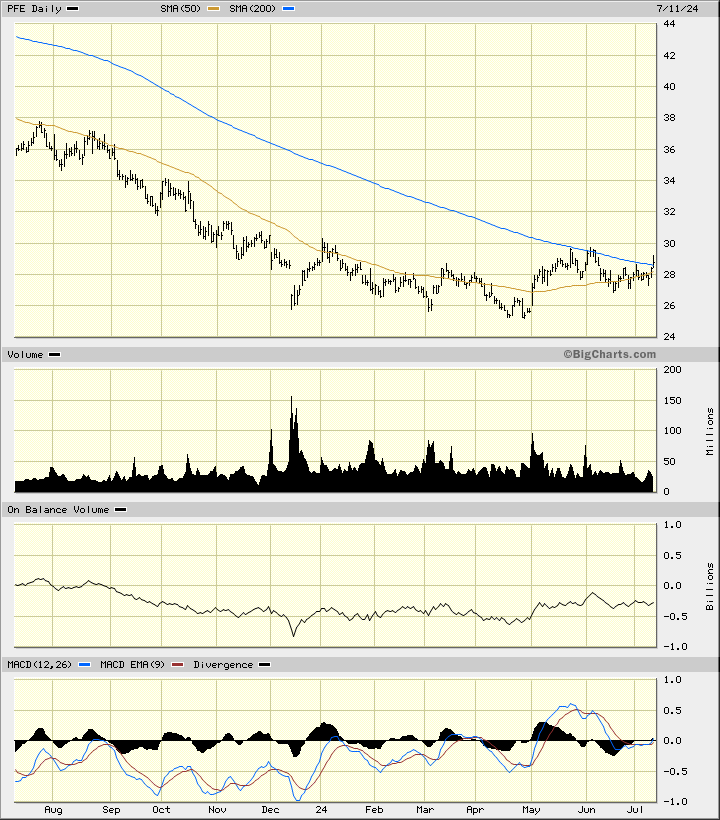
In the daily bar chart of PFE, below, I can see that the slope of the 50-day moving average line is now positive.
The On-Balance-Volume (OBV) line has continued its steady trend since December. The Moving Average Convergence Divergence (MACD) oscillator has been working higher since December and is close to a fresh outright buy signal.
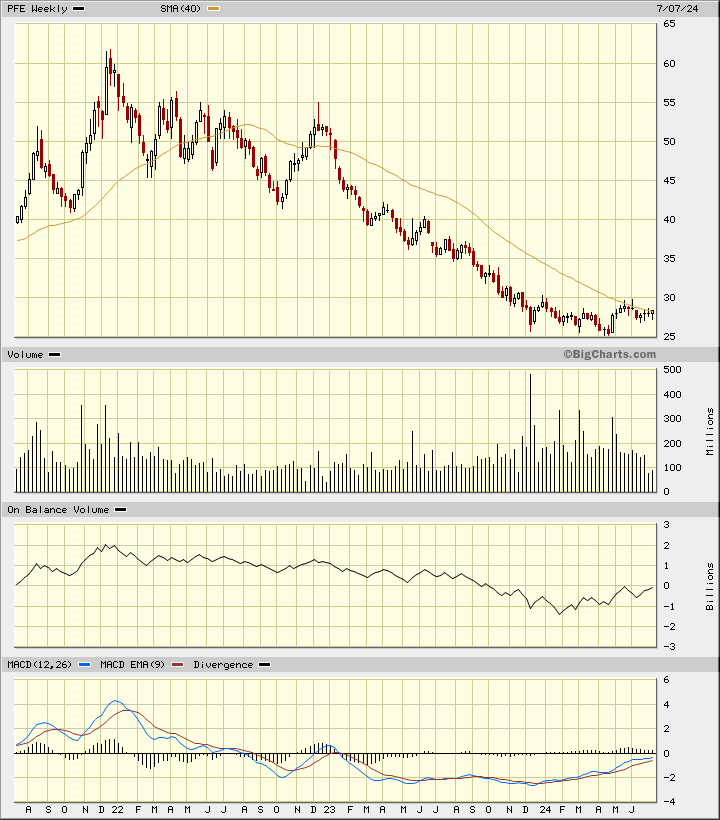
In the weekly Japanese candlestick chart of PFE, below, I can see further improvement since early June. Prices are breaking the 40-week moving average line by moving sideways.
The weekly OBV line continues to move upwards from February. The MACD oscillator continues to improve and is gaining ground below the zero line.
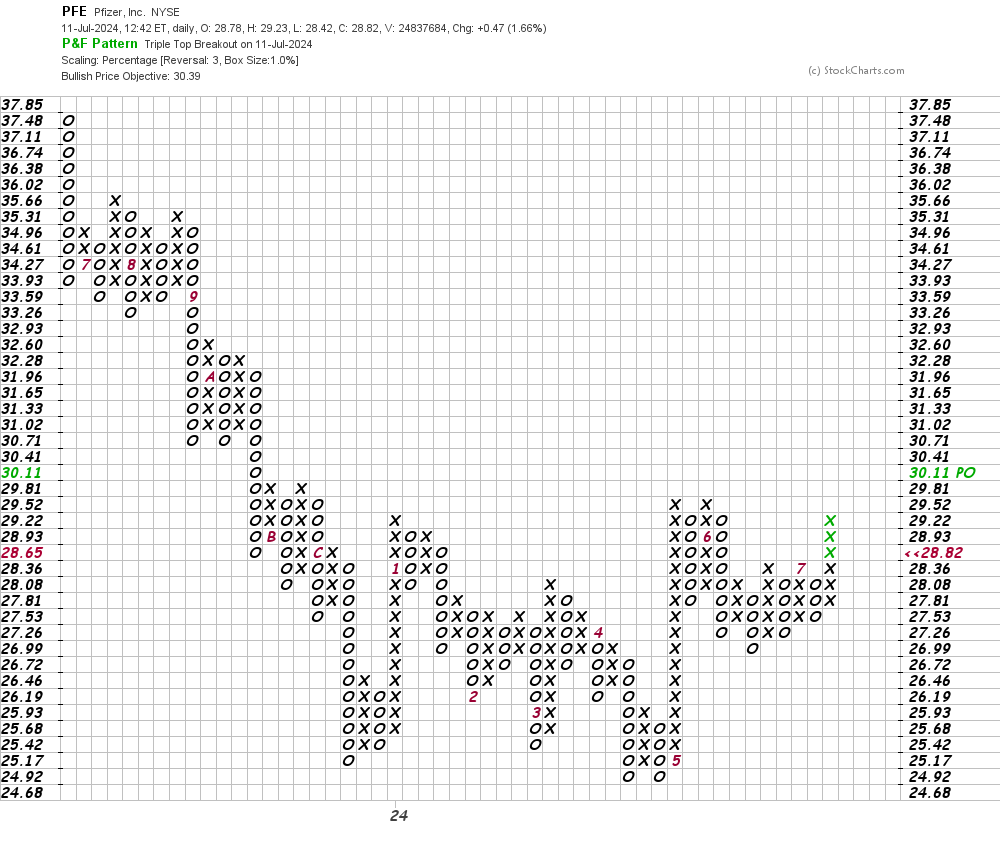
In this daily Point and Figure chart of PFE, below, I can see a nearby price target of $30.
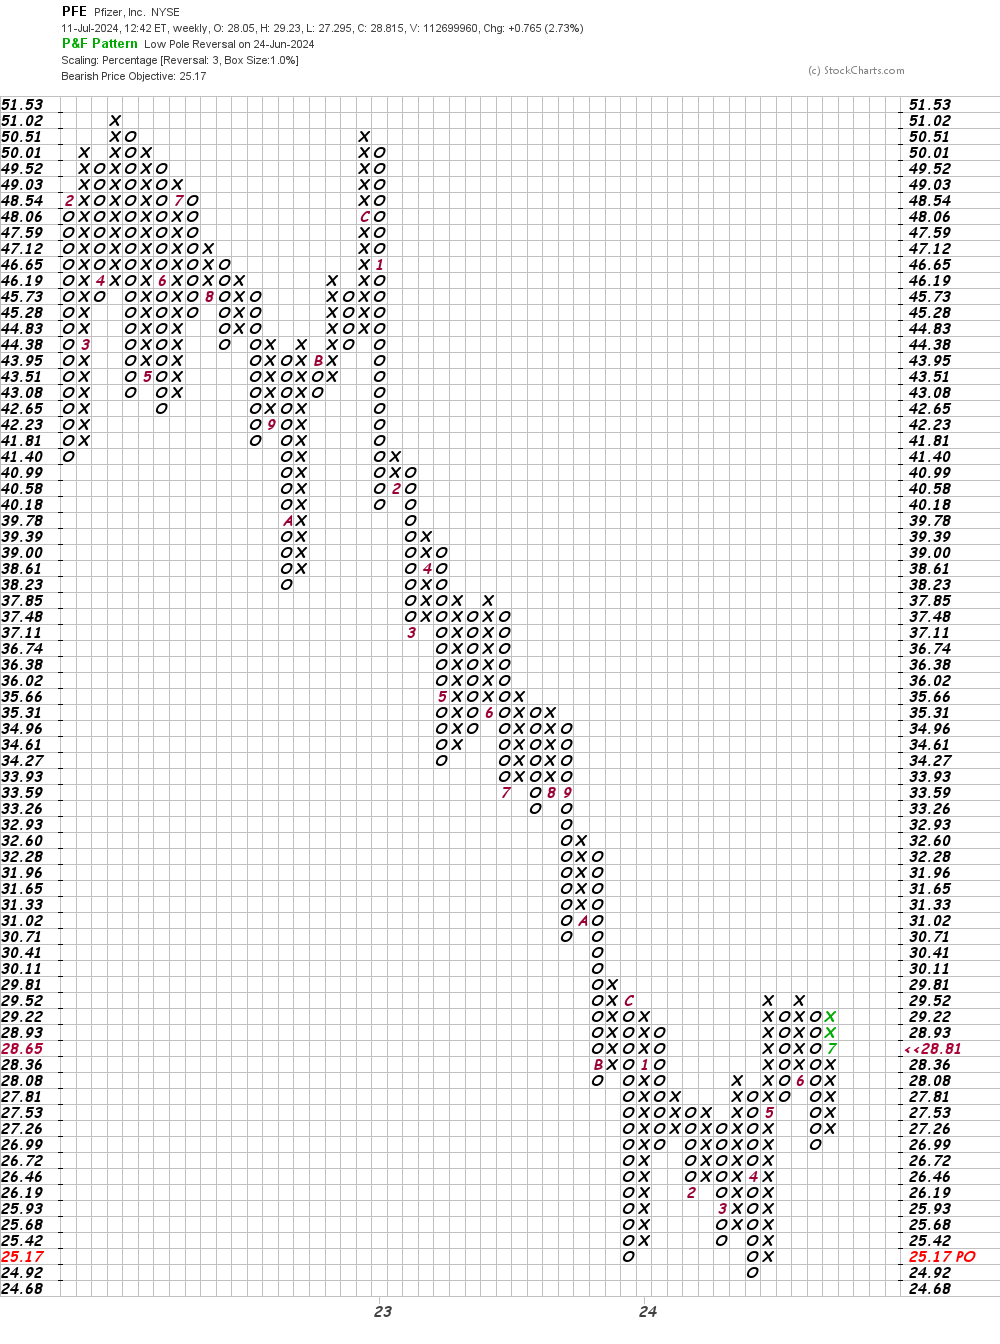
In this weekly Point and Figure chart of PFE, below, I can see a possible downside price target being projected but strength above $29.81 should spark further gains.
Bottom-line strategy: Step by step the charts of PFE continue to improve. Traders could soon get a trade at $29.81 or higher as my signal to go long.
Employees of TheStreet are prohibited from trading individual securities.