Pfizer Is Getting Healthier and There's a Key Level for Buyers to Watch
Here's our updated technical strategy for the pharmaceutical giant.
You've reached your free article limit
You've read 0 of 1 free Pro articles.
When I looked at the charts of Pfizer PFE on May 23 I wrote that "The technical setup of PFE has definitely improved in recent months. Is it ready to launch a sustained uptrend? Maybe not just yet. A broader base pattern would give more confidence."
Let's check out the charts of the pharmaceutical giant again.
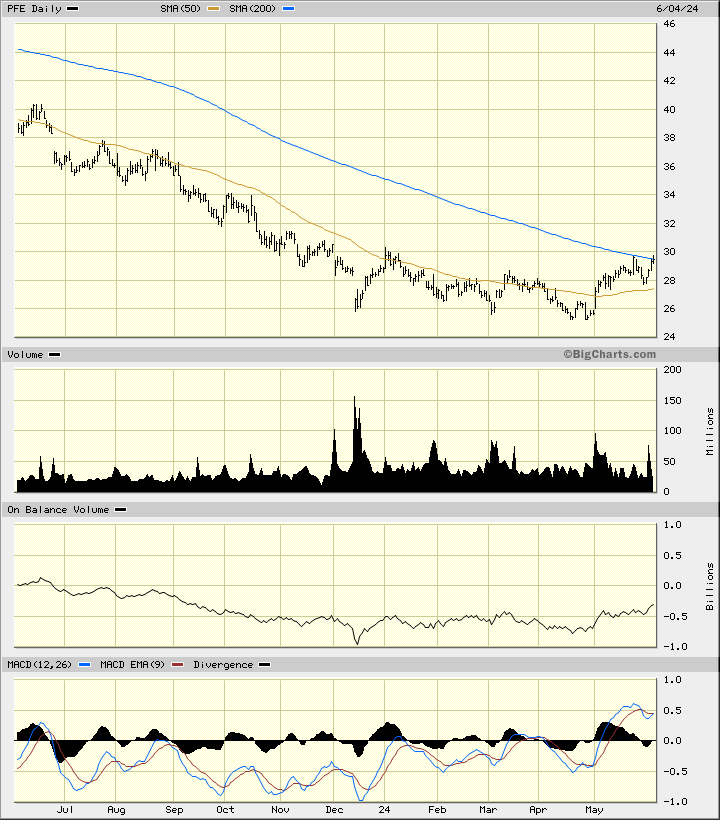
In the updated daily bar chart of PFE, below, I can see this is the second test of the 200-day moving average line in the past couple of weeks. Prices also made a successful pullback or correction to the rising 50-day moving average line.
The On-Balance-Volume (OBV) line has been positive since the middle of April and this is telling us that buyers of PFE are now being more aggressive than sellers. The trend-following Moving Average Convergence Divergence (MACD) oscillator is moving in the right direction.
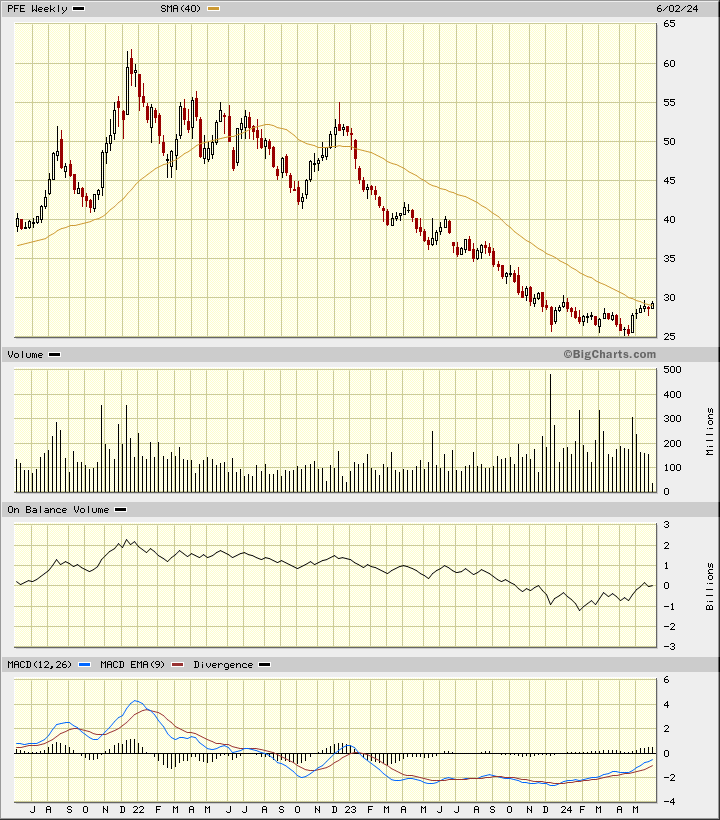
In this weekly Japanese candlestick chart of PFE, below, I can see that prices are testing the declining 40-week moving average line.
The weekly OBV line has improved the past four months. The MACD oscillator has improved all year but is still below the zero line.
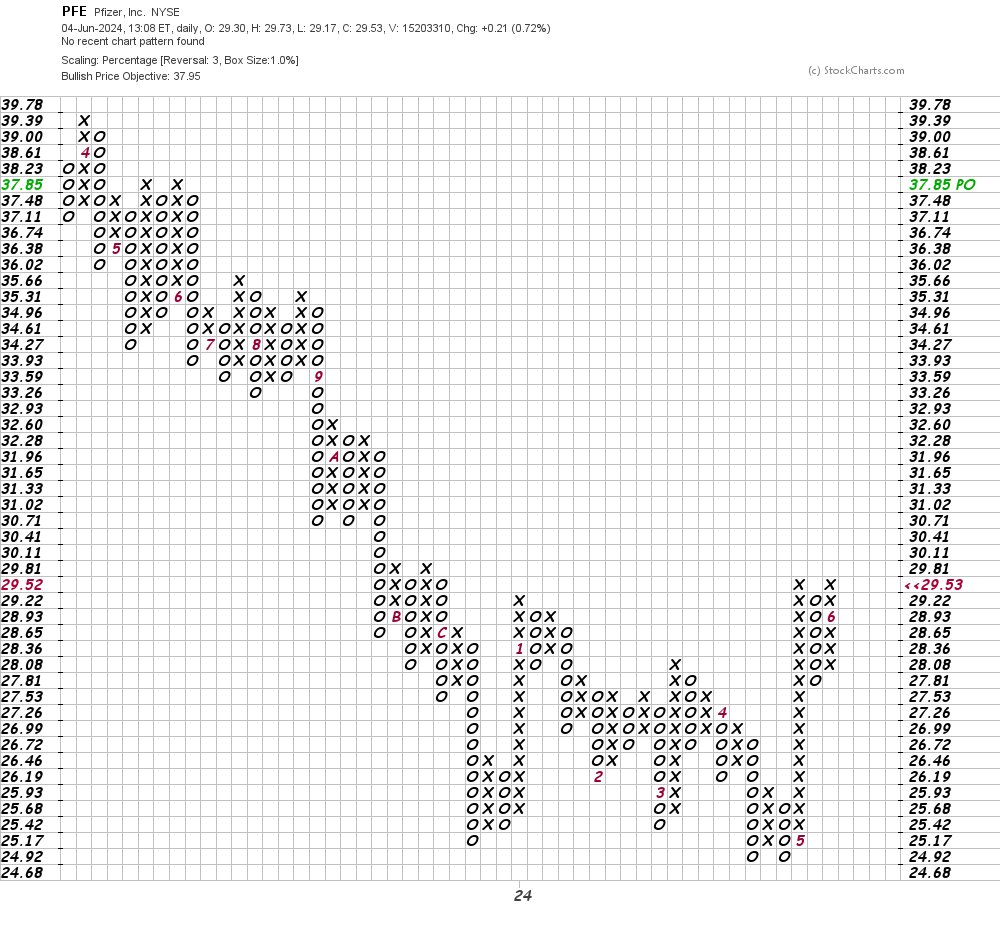
In this daily Point and Figure chart of PFE, below, I can see an upside price target in the $38 area. A trade at $29.81 or higher should refresh the uptrend.
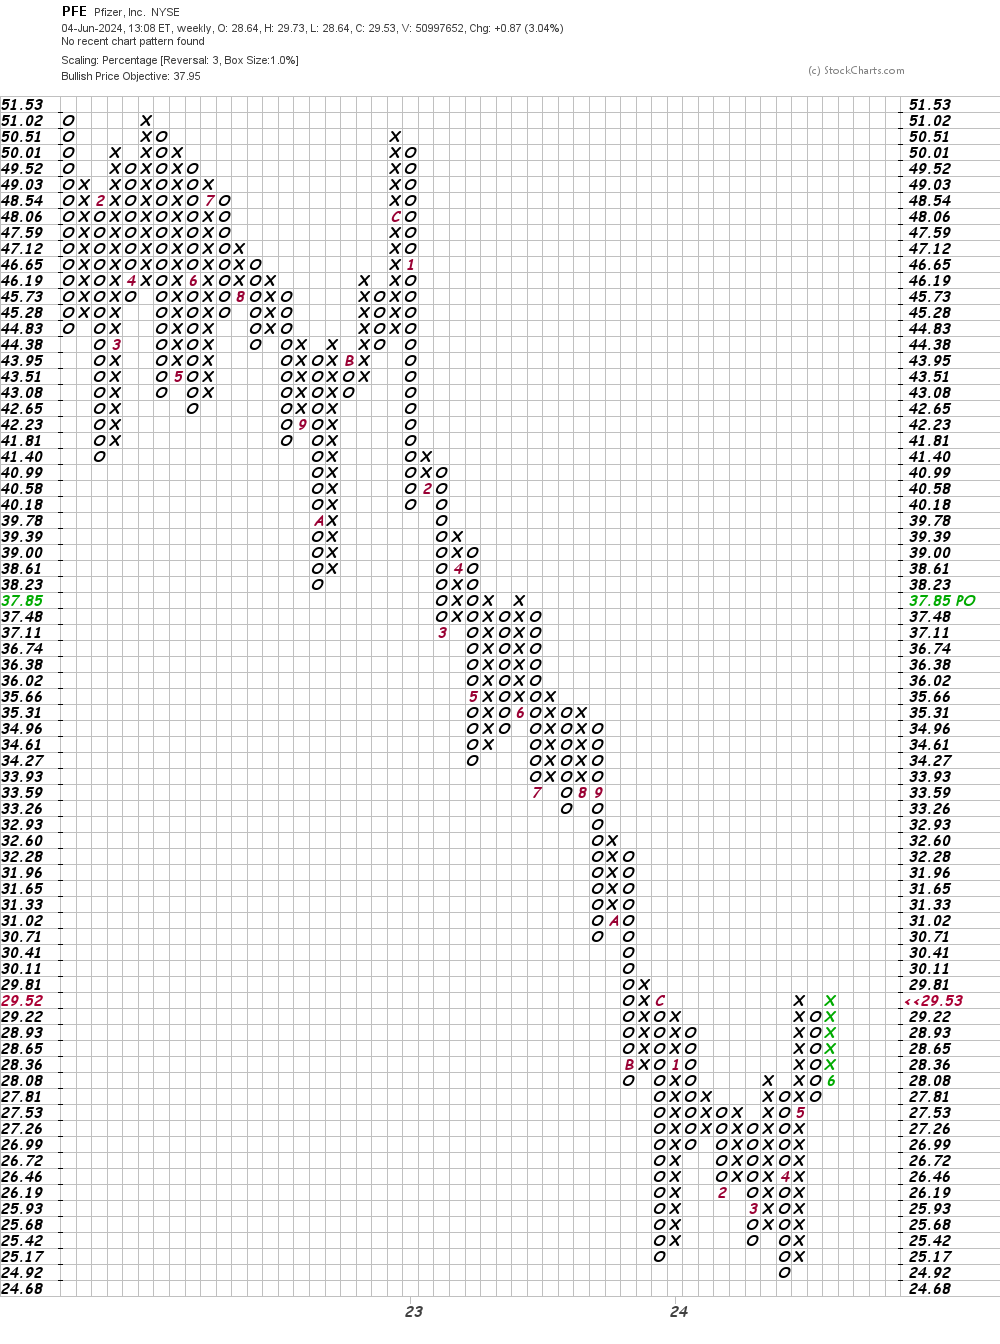
In this weekly Point and Figure chart of PFE, below, I can see the same pattern as there is on the daily chart above. A weekly trade at $29.81 is positive.
Bottom-line strategy: Aggressive traders could go long PFE on strength above $29.81. Risk a close below the 50-day moving average line. The $38 area is my price target for now.
Employees of TheStreet are prohibited from trading individual securities.