People Are Worried About the SOX. The Transports Might Be the Bigger Worry.
The SOX are tracing out a possible double top. Or a pennant. We don’t know yet. But Transports are following oil, which is down.
You've reached your free article limit
You've read 0 of 1 free Pro articles.

The Market
Oh, sure, the others got a chance to rally. The XLI didn’t gap down and crap out. In fact, it made a new high. But it still closed on the low of the day.
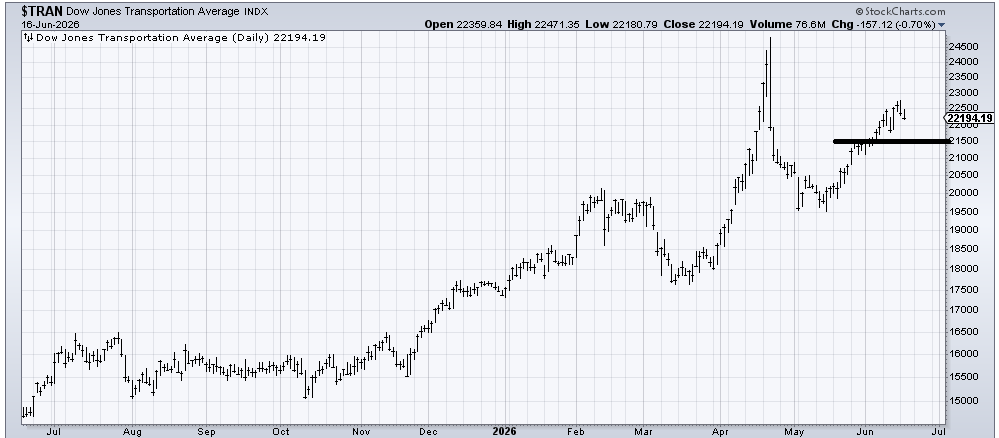
Despite the breadth being better, the number of stocks making new highs remains pathetic, as the NYSE had 100 new highs today, still well off peak readings. And once again, oil slid, but the Transports were down.
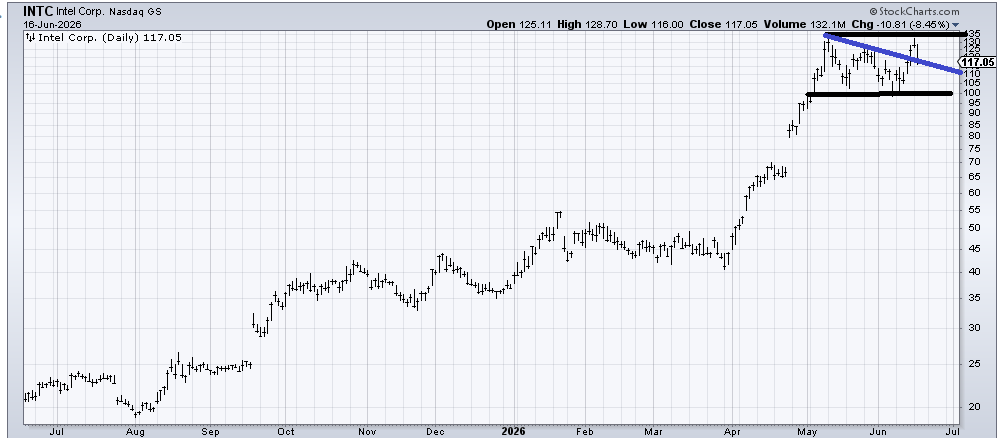
I realize everyone is going to fuss over the SOX, as they ought to. I mean, there is a potential double top there, but I tend to do my best to keep silent when there is so much chatter, and something is so obvious. In other words, I wouldn’t be shocked if the SOX fell more or if it rallied. Just about a week ago, I said I was now neutral on Intel, and I still am. I would point out that Intel did not make a higher high on Monday. If it can’t rally from this blue line, then I’d say that 100 level is in play.
But as is typical of me, I tend to go where the masses are not chattering. And right now, that is the Transports. Oil has collapsed in the last two days, and the Transports are down both days. I think they are vulnerable.
And sure, I like that the banks got saved today, but Goldman Sachs did not make a higher high enough that my (new!) eyes can see it. And neither did my favorite name in the group, Citigroup.
But let’s talk patterns for a minute. I’ve already noted the potential double top in the SOX. The textbook definition is that for it to be a double top, that 12k level would have to be breached.
When it comes to the indexes, I tend to rely on the indicators more than patterns, but last week I noted there was a minor head-and-shoulders pattern in the S&P and the other major indexes. They all had targets about one to two percent lower than where they got to.
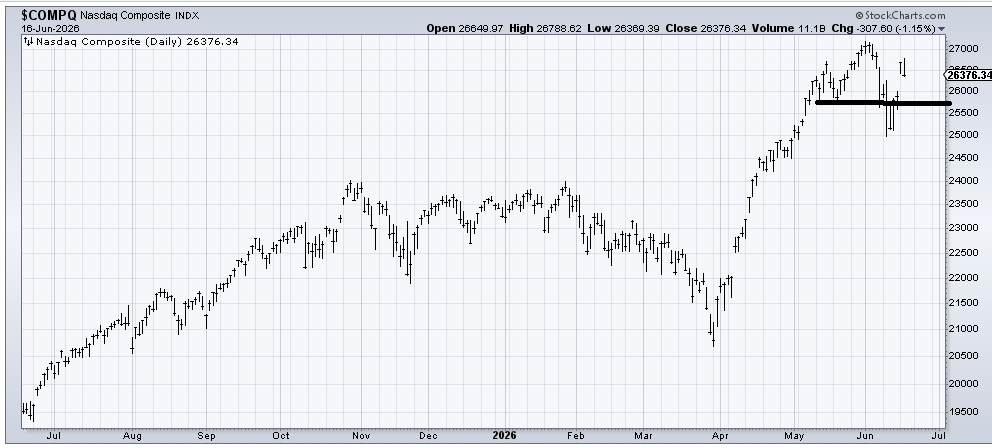
But let me say right now that if Nasdaq gaps down under 26,200 tomorrow and cannot recapture that level in a hurry, this chart is going to not only leave an island overhead but the potential for a very funky head and shoulders top.
The indicators say we should rally again before the end of the week, but I will allow for the possibility that my interpretation of the indicators can be wrong, especially with the VIX so low again (although the DSI on the VIX is back to 20 now).
New Ideas
Let me start by following up on the oil charts (WTI and USO) from yesterday by reporting the DSI for Oil is now 25. It’s getting late in the decline there.
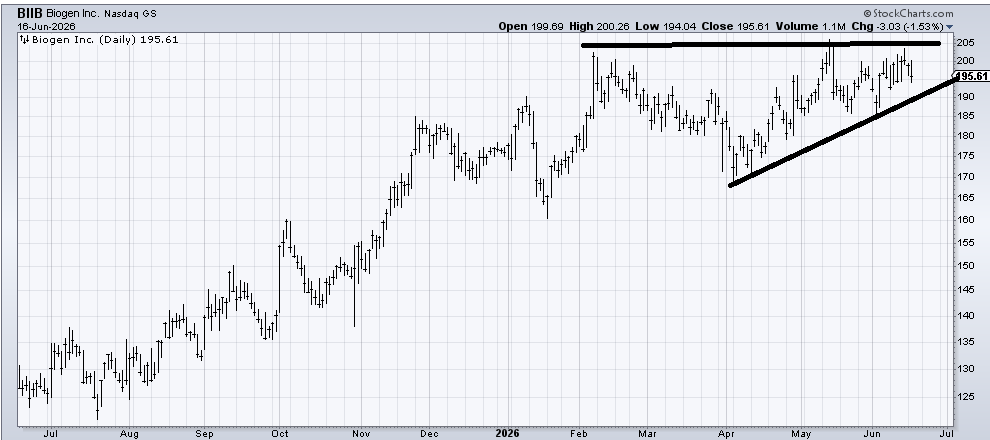
As a follow-up, a few weeks ago, I was asked about Biogen (BIIB), and I thought it could get through this 200-205 area. It has now tried to do so twice and has been unsuccessful. I’d be cautious on the stock now, especially if it breaks 190.
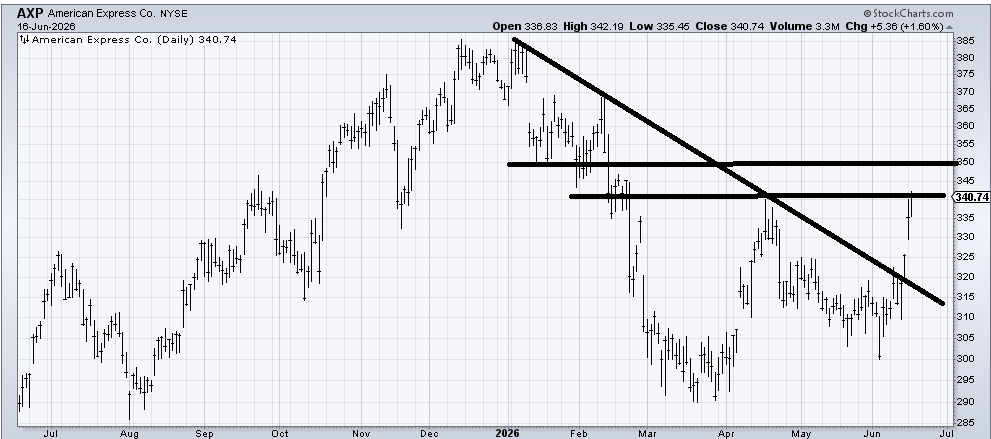
Another follow-up, last week I warmed back up to American Express (AXP), and while I still like the chart, it is heading into some resistance in the 340-350 area. I wouldn’t be opposed if traders wanted to take a little off the table.
Today’s Indicator
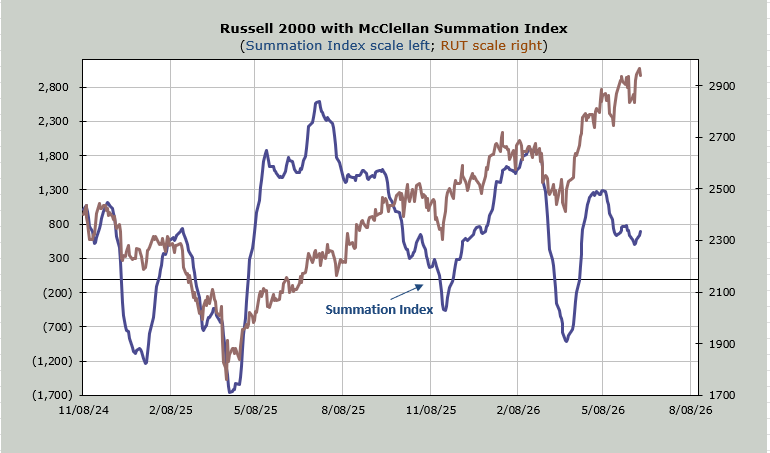
The McClellan Summation Index has ticked up. If we get a bad breadth day, the rise will be halted quickly. A net differential of -900 advancers minus decliners on the NYSE would do it.
Q&A/Reader’s Feedback
Helene welcomes your questions about Top Stocks and her charting strategy and techniques. Please send an email directly to Helene with your questions. However, please remember that TheStreet.com Top Stocks is not intended to provide personalized investment advice. Email Helene here.
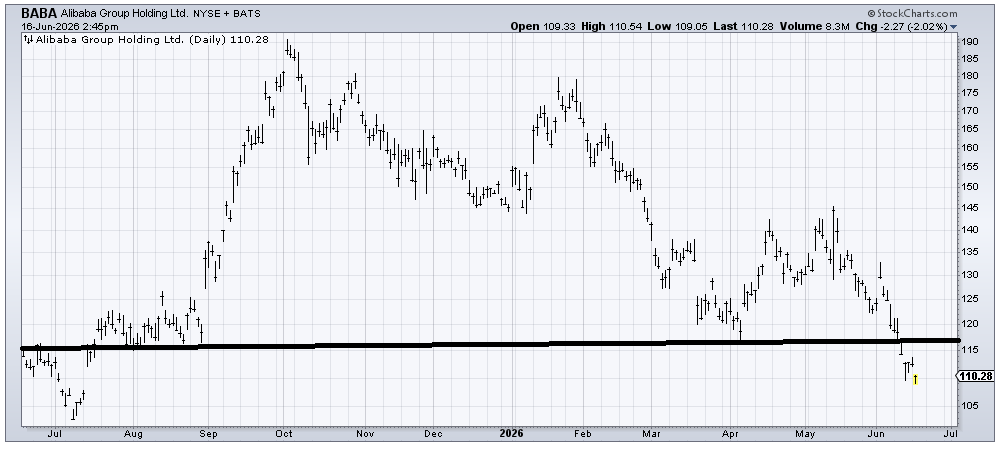
I don’t have much new to say on Alibaba (BABA) than I have in the last month or more: picking a bottom in this stock has been a nightmare. Can it rally? Yes, it can because it is oversold, having gone down 20% in nearly a straight line. But unless it can gap up over 117 and leave the last week of trading down here as an island, all I see is an oversold rally to resistance (117).
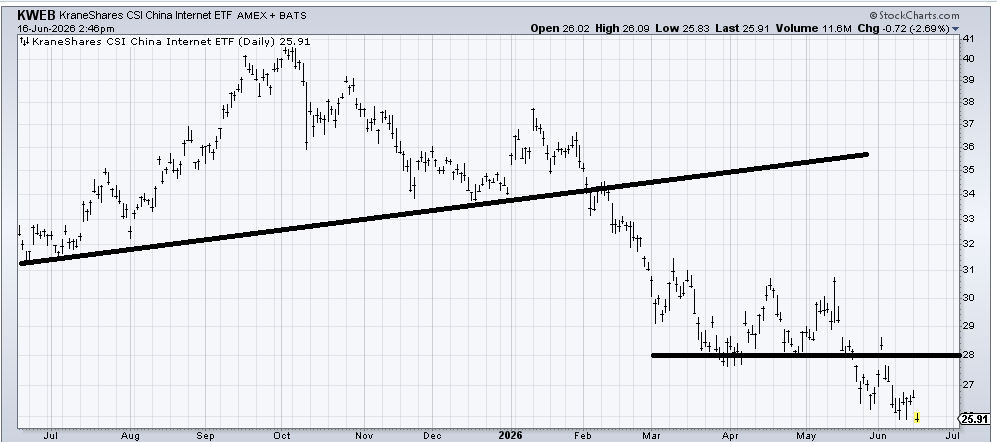
KWEB (KWEB) is in the same grouping as BABA (above) except that there is a next measured target in this 24-26 area so sure, an oversold bounce is possible. Maybe even likely. But that resistance at 28 and again just over 30 isn’t going to be easy to chew through.
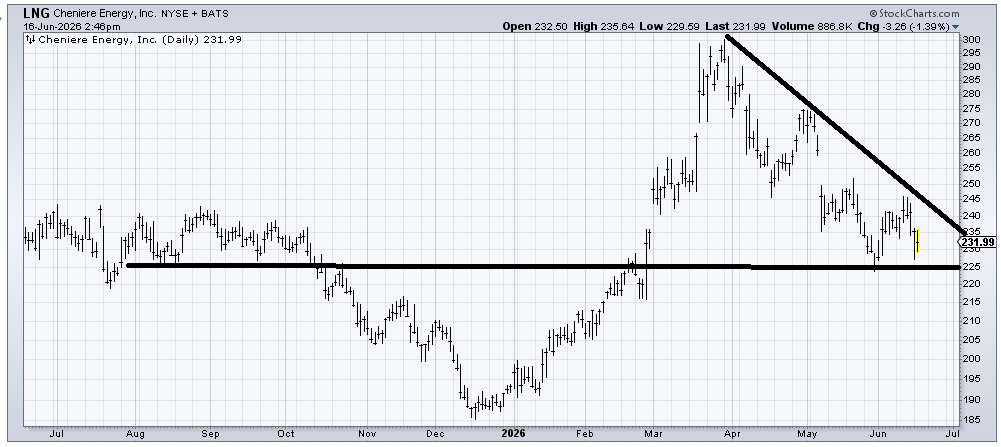
If Cheniere Energy (LNG) can spend some time holding over 225 and building some sort of base here, I might like it. Alternatively, a push over that 245 area (prior high and downtrend line) would get me interested. Right here it seems uncertain, but I would lean toward ‘starting to bottom,’ but it’s very early.
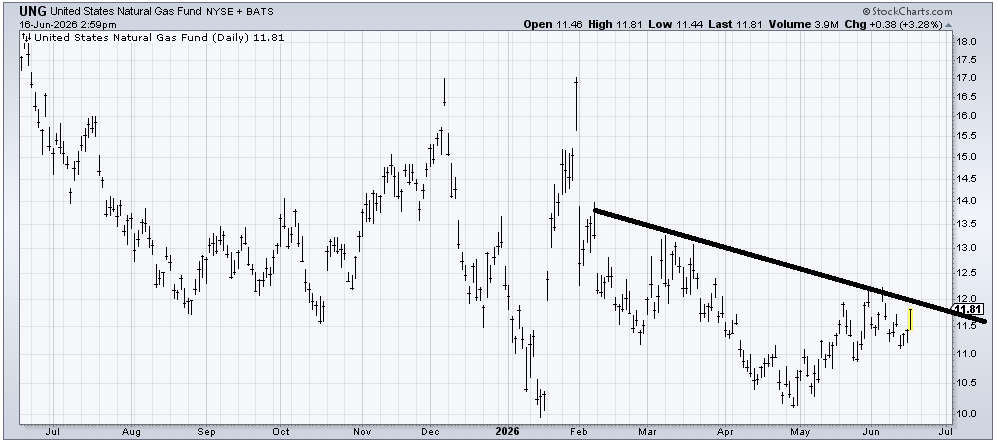
If you want an ‘NG’ that is further along, take a look at UNG (UNG), an ETF to be long Natural gas. Look how close it is to crossing that line, and the higher lows.
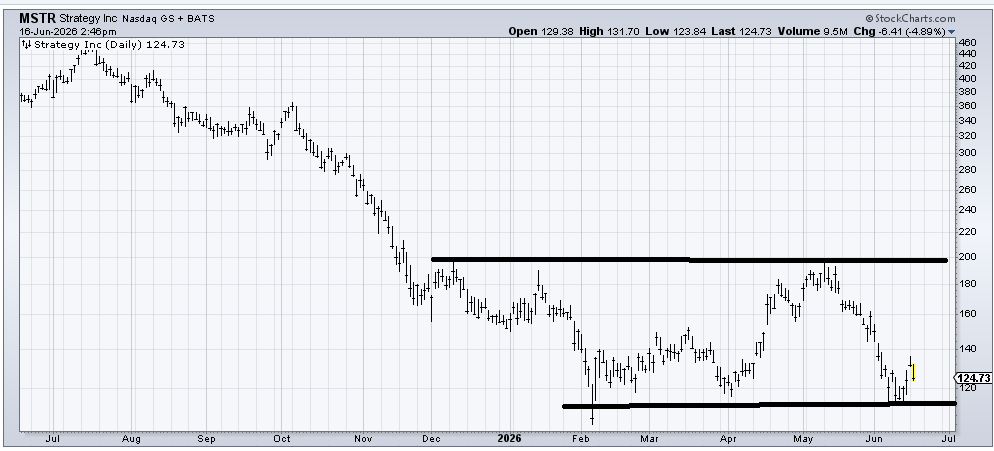
Strategy (MSTR) moves with Bitcoin, and recall a week or so ago, I said the DSI for BTC came down to single digits, thus it ought to rally. Now I will say (the DSI has pushed back to the 20+ area) that as long as it holds those lows, I will say it is bottoming. But there is a long way to go to make this a better chart. At least the risk/reward is decent here.