Palantir Gets Hit by Downgrade: Traders Beware or Opportunity?
Several warning flags have begun to appear in the AI darling's charts. Here's what to know and watch.
You've reached your free article limit
You've read 0 of 1 free Pro articles.
Defense contractor and data analytics firm Palantir Technologies PLTR has certainly benefited from the optimism around AI, rising more than 60% year to date in 2024. However, it has gained a bit too much, according to the sell-side firm Mizuho, which downgraded the stock Tuesday to "Underperform" from "Neutral."
Let's check out the charts and indicators to see what they say about Palantir.
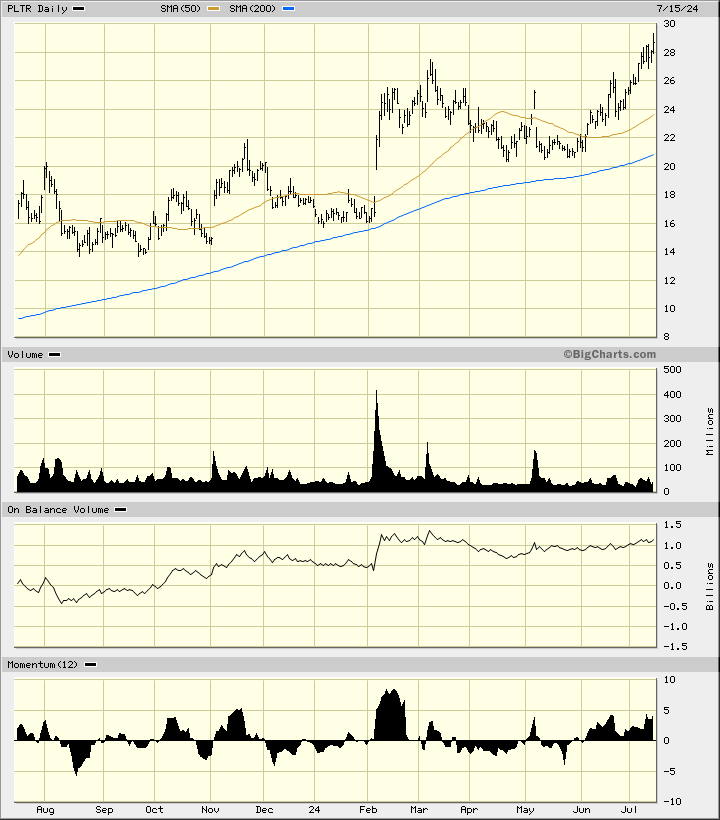
In the daily bar chart of PLTR, below, I can see a few warning flags. The shares are still in an uptrend and trade above the rising 50-day moving average line and above the rising 200-day moving average line. However, trading volume has not expanded with the uptrend and that is a potential problem for old-time chart watchers who want to see increased investor interest as a stock rallies. The On-Balance-Volume (OBV) line has weakened since March and is not confirming the price gains.
The 12-day price momentum study in the lower panel shows me equal highs in June and July even though prices made higher highs. This is a small bearish divergence but it could be very effective.
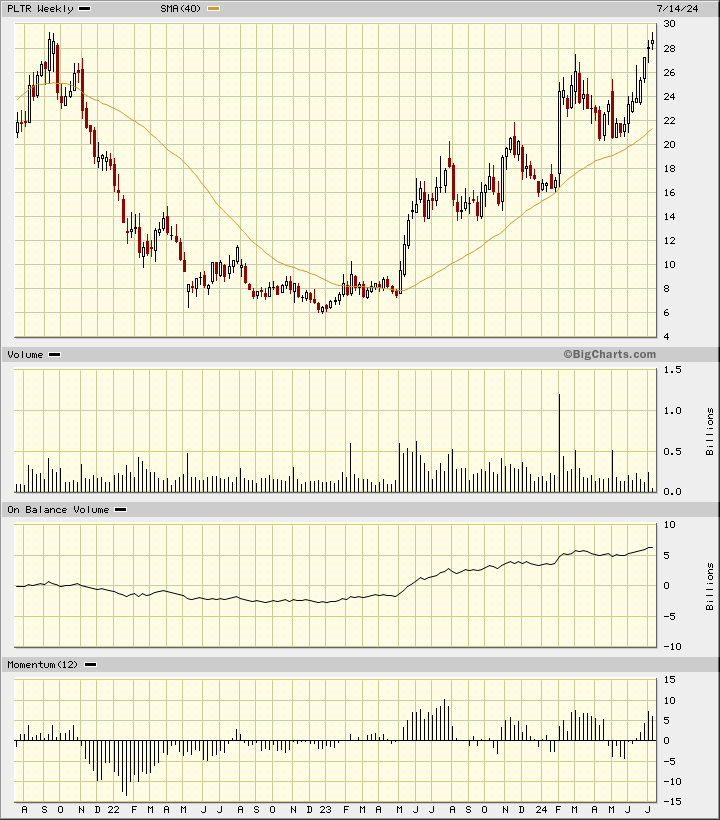
In the weekly Japanese candlestick chart of PLTR, below, the two most recent candle patterns suggest that prices are near a top reversal. The two candles have very small real bodies so we may consider them to be doji or spinning tops if you like. The label is not as important as the price action. The open and close are close together telling us that buyers and sellers are in balance and weakness this week could tip the scales to the downside.
The trading volume has been shrinking. The OBV line tells a different story and is pointed higher. The 12-week momentum study shows us a longer-term bearish divergence which could be foreshadowing a decline in the weeks ahead.
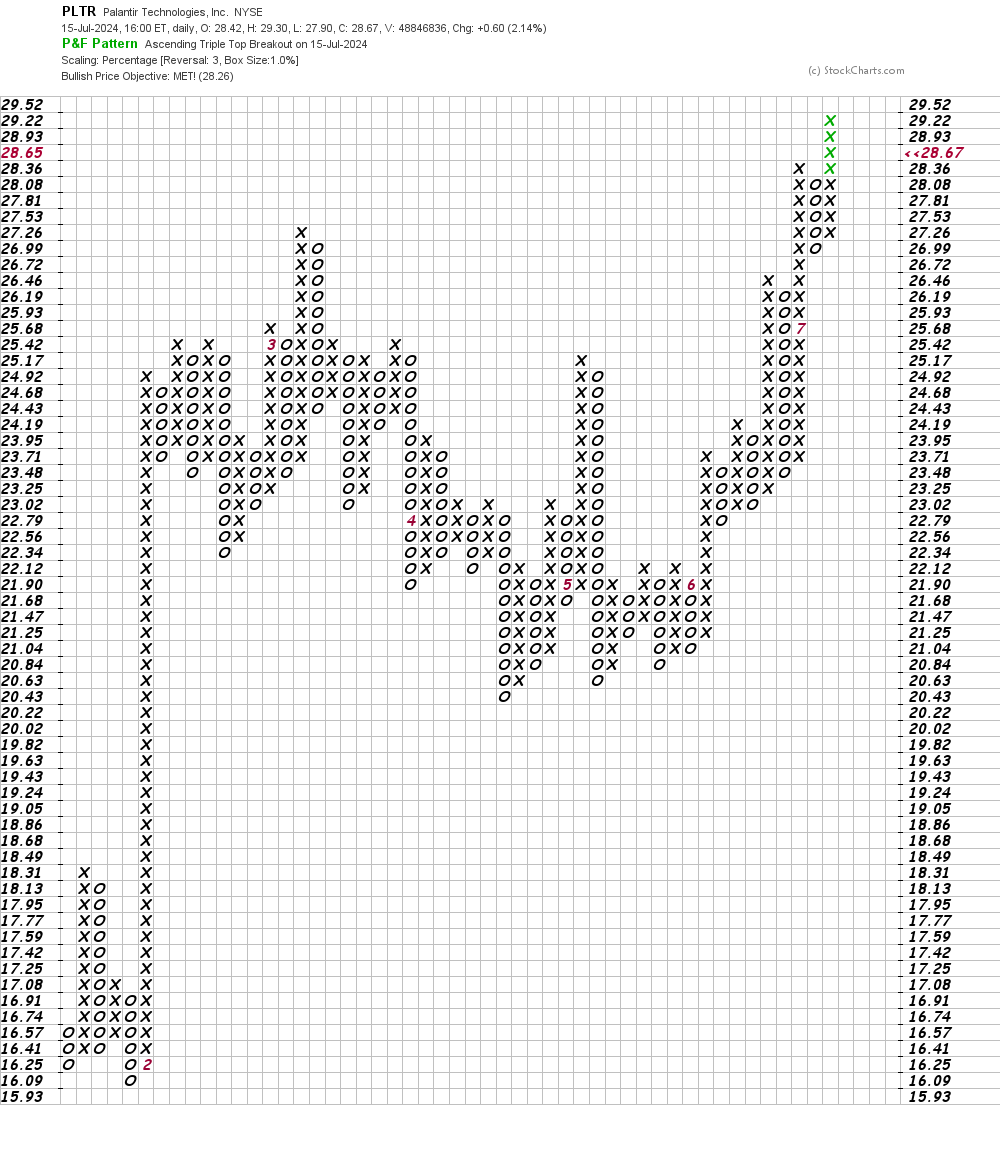
In this daily Point and Figure chart of PLTR, below, I can see that the shares have reached an upside price target in the $28 area.
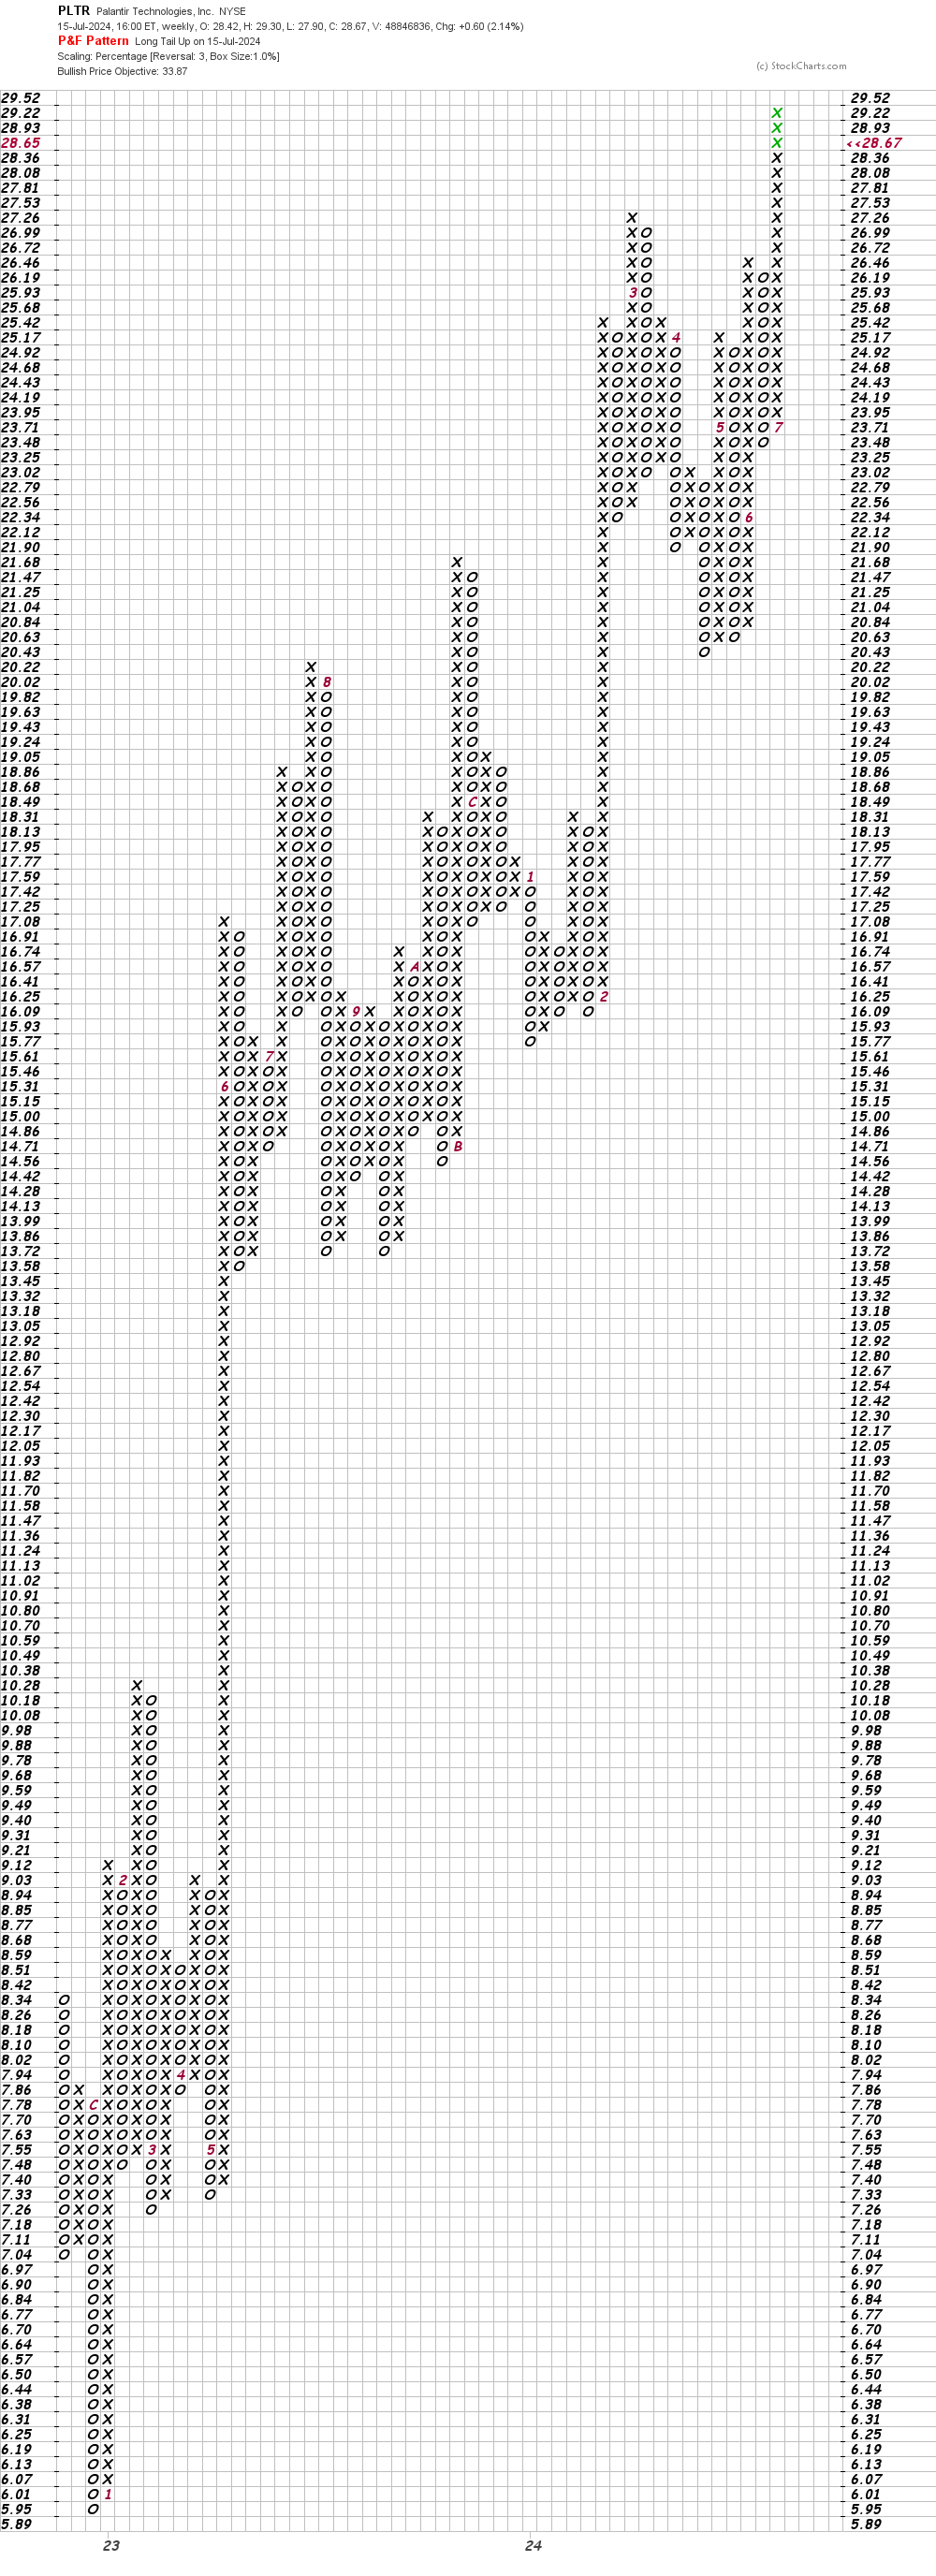
In this weekly Point and Figure chart of PLTR, below, I can see a price target in the $34 area.
Bottom-line strategy: I was bullish on PLTR in my April 4 review, but now traders should look to take profits and take a trading holiday.
Employees of TheStreet are prohibited from trading individual securities.