What's Palantir's Likely Path After Oracle Partnership News?
These are the key price levels traders need to watch now for this AI stock.
You've reached your free article limit
You've read 0 of 1 free Pro articles.
Oracle Corp. ORCL announced Thursday that it was partnering with Palantir Technologies PLTR to jointly sell cloud and AI services. Let's check to see how traders are reacting to the news.
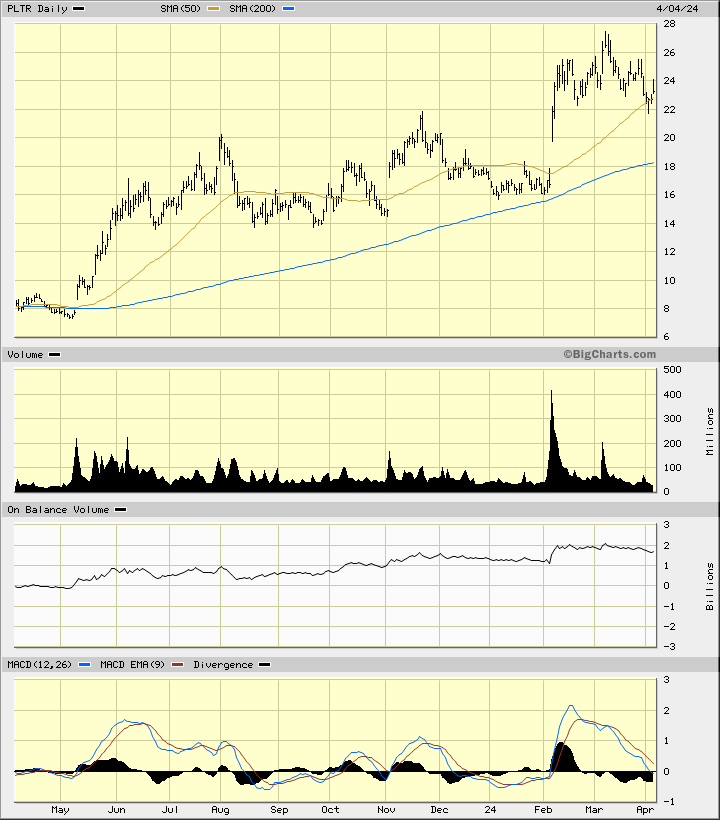
In the daily bar chart of PLTR, below, I can see that share prices have been in an upward-trading path the past 12 months. the shares made a high in early March and pulled back to the rising 50-day moving average line. The slower-to-reaction 200-day moving average has a positive slope and intersects down around $18.
The On-Balance-Volume (OBV) line is in a longer-term advance but has been stalled the past two months, suggesting a balance between bulls and bears. The Moving Average Convergence Divergence (MACD) stands just slightly above the zero line.
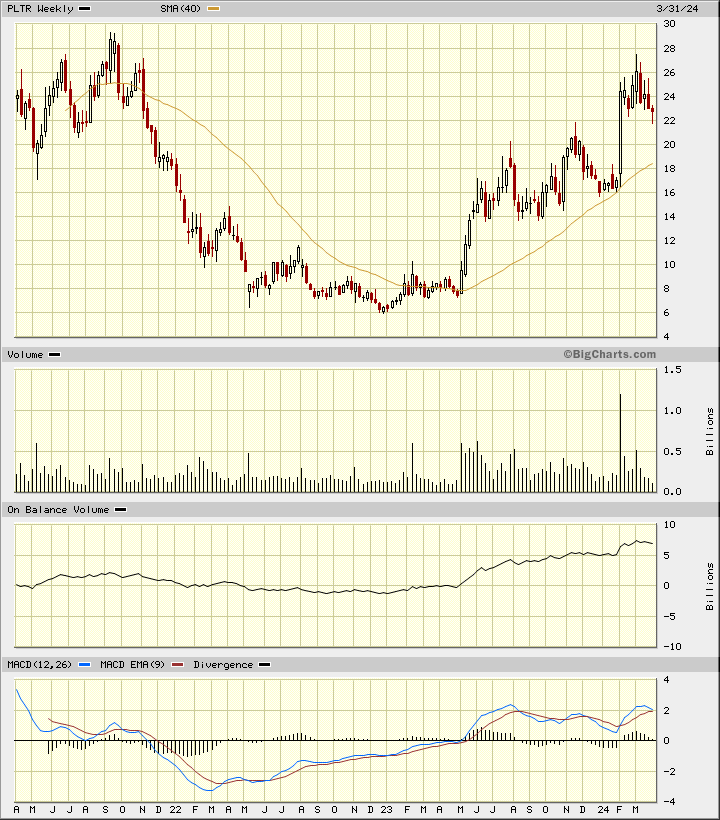
In the weekly Japanese candlestick chart of PLTR, below, I see a mixed picture. The shares made strong gains in February but corrected those gains in March. I can see a number of upper shadows around $26 that tell me that traders have rejected the highs.
The weekly OBV line "rolled over" in February and March, suggesting a shift from aggressive buying to aggressive selling. The MACD oscillator has not broken above its June/July highs and is crossing to the downside for a take profits sell signal.
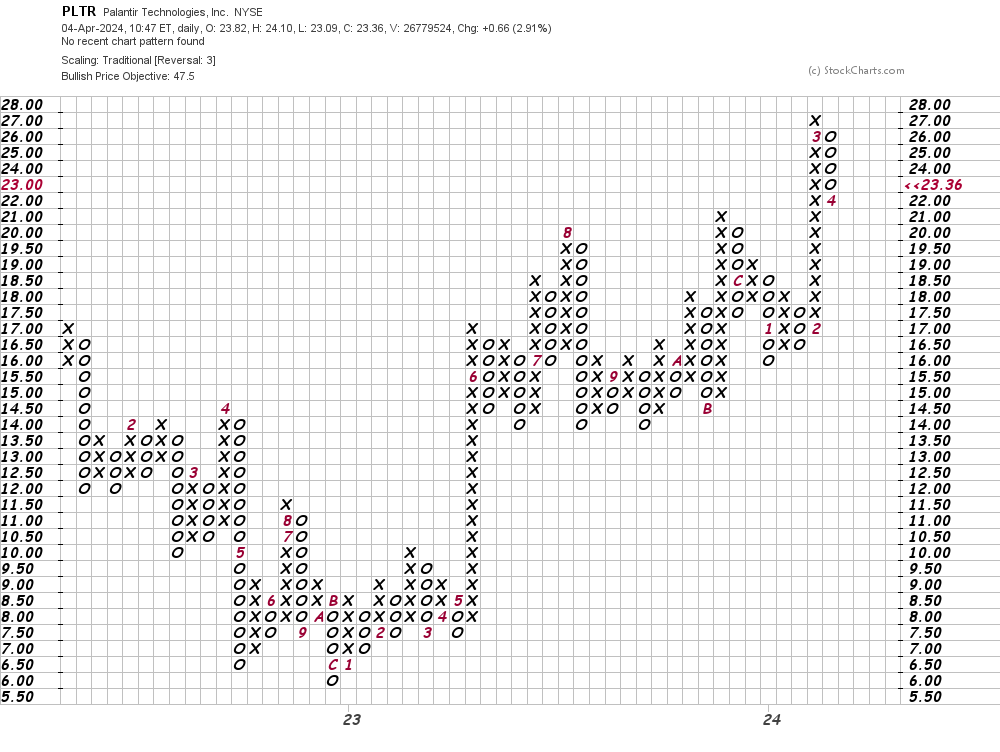
In this daily Point and Figure chart of PLTR, below, I can see a price target in the $48 area.
In this weekly Point and Figure chart of PLTR, below, I can see the same upside price target of $48 that shows on the daily chart above.
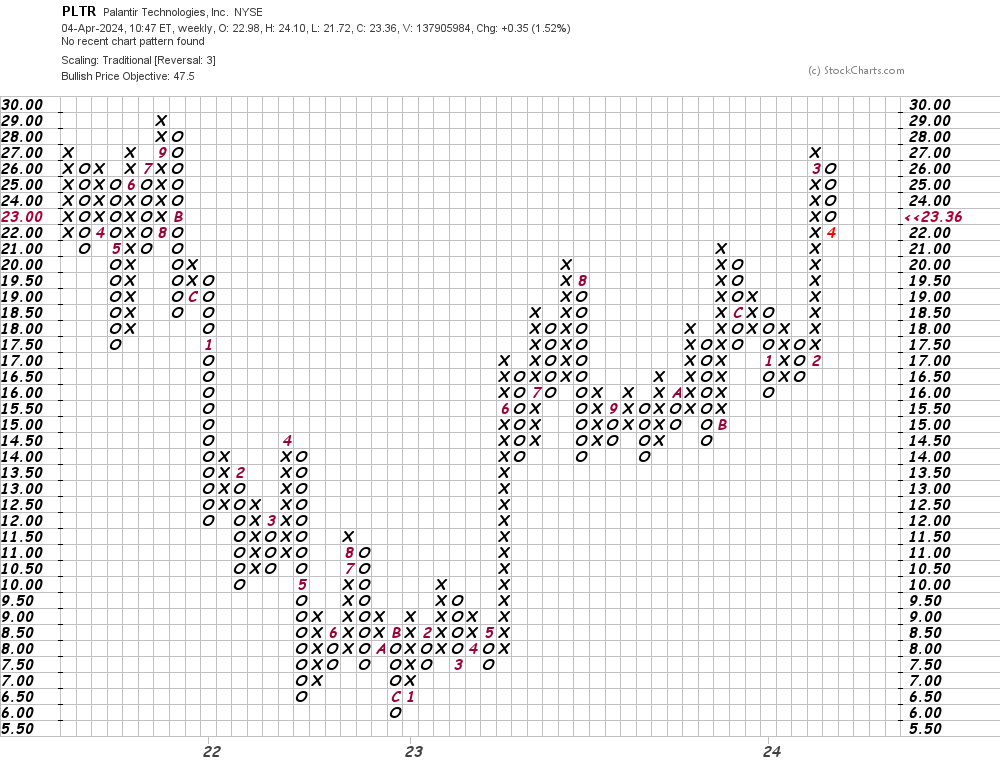
Bottom-line strategy: If PLTR continues to trade mostly above $22 it should look like it is building a base for another move higher. Buyers need to risk below $18 for now. The $48 area is my longer-term price objective.
Employees of TheStreet are prohibited from trading individual securities.