Footwear and Apparel Stock's Bullish Alignment Calls for Higher Price Target
On Holding's shares are running at a good pace and I've got an updated target.
You've reached your free article limit
You've read 0 of 1 free Pro articles.
In my last review of On Holding AG ONON, I updated my price targets to $43 and then $52. Now that prices have just about reached my first price target at $43, another look at the charts seems to be a good idea.
At the beginning of April, shares in the footwear and apparel maker seemed poised for price gains, quickly recovering from the previous month with very heavy trading volume and earning a fundamental "overweight" rating from Barclays.
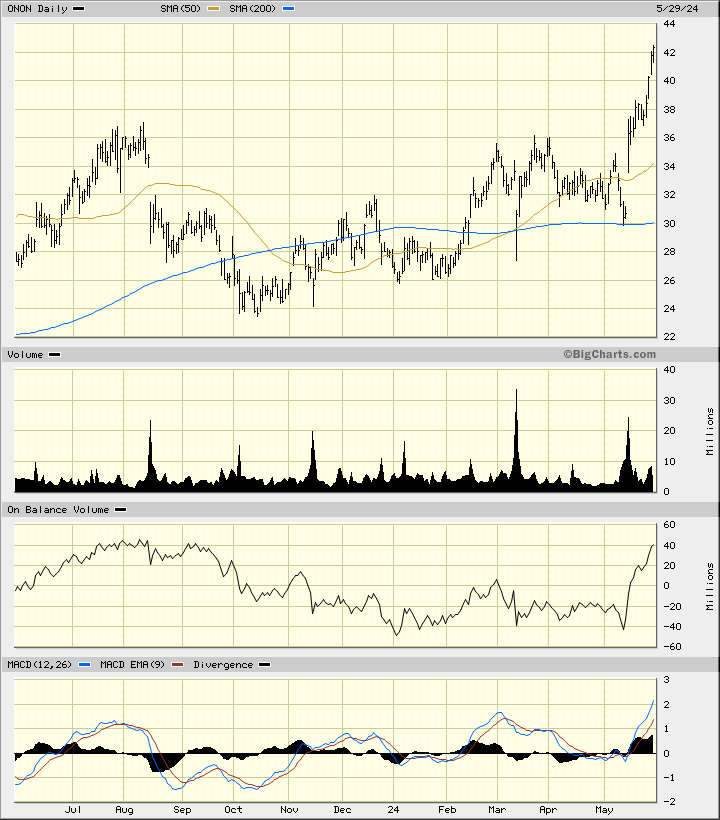
In this updated daily bar chart of ONON below, I can see that prices have sprinted higher in May. ONON trades above the rising 50-day moving average line and above the bottoming 200-day line.
Trading volume has jumped in May and the On-Balance-Volume (OBV) line has turned upward. The Moving Average Convergence Divergence (MACD) oscillator is in a bullish alignment above the zero line.
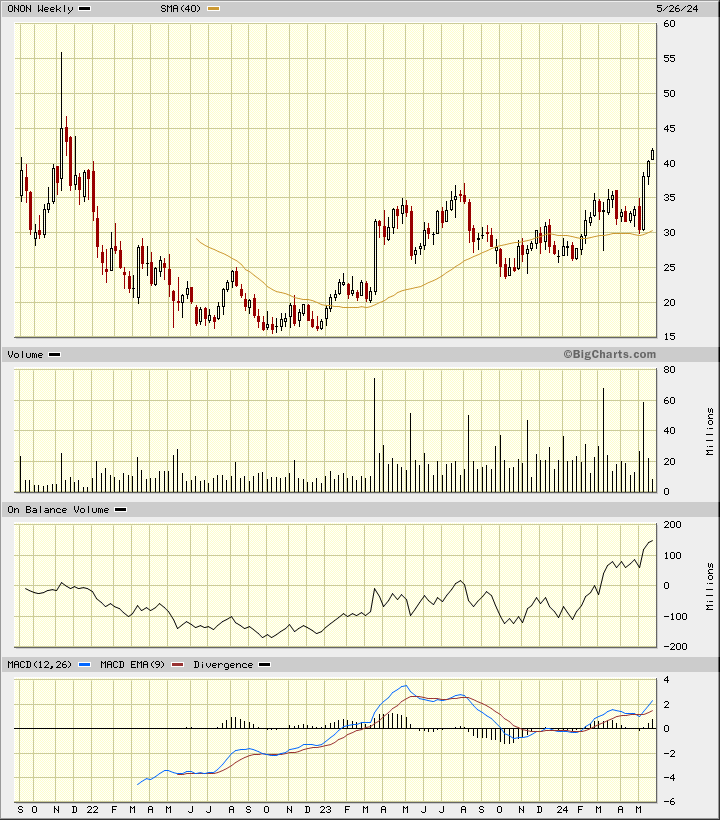
In the weekly Japanese candlestick chart of ONON below, I can see how prices have broken out from a large base formation. Prices trade above the rising 40-week moving average line.
The weekly OBV line has been strong the past five months. The MACD oscillator is bullish.
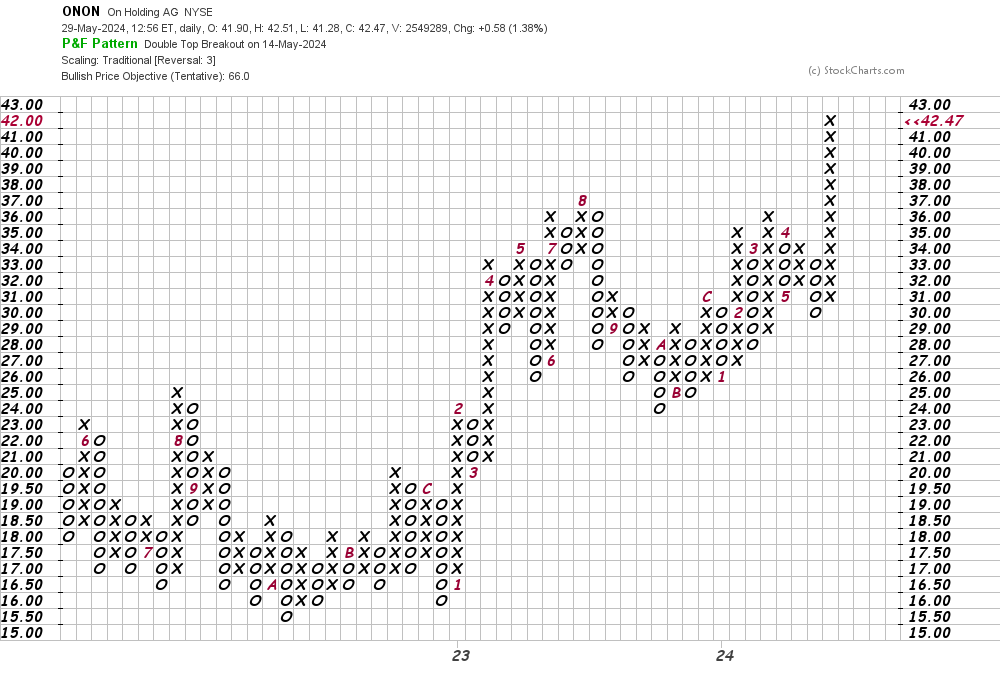
In this daily Point and Figure chart of ONON below, I can see a price target of $66.
In this weekly Point and Figure chart of ONON below, I can see a price target in the $66 area as well.
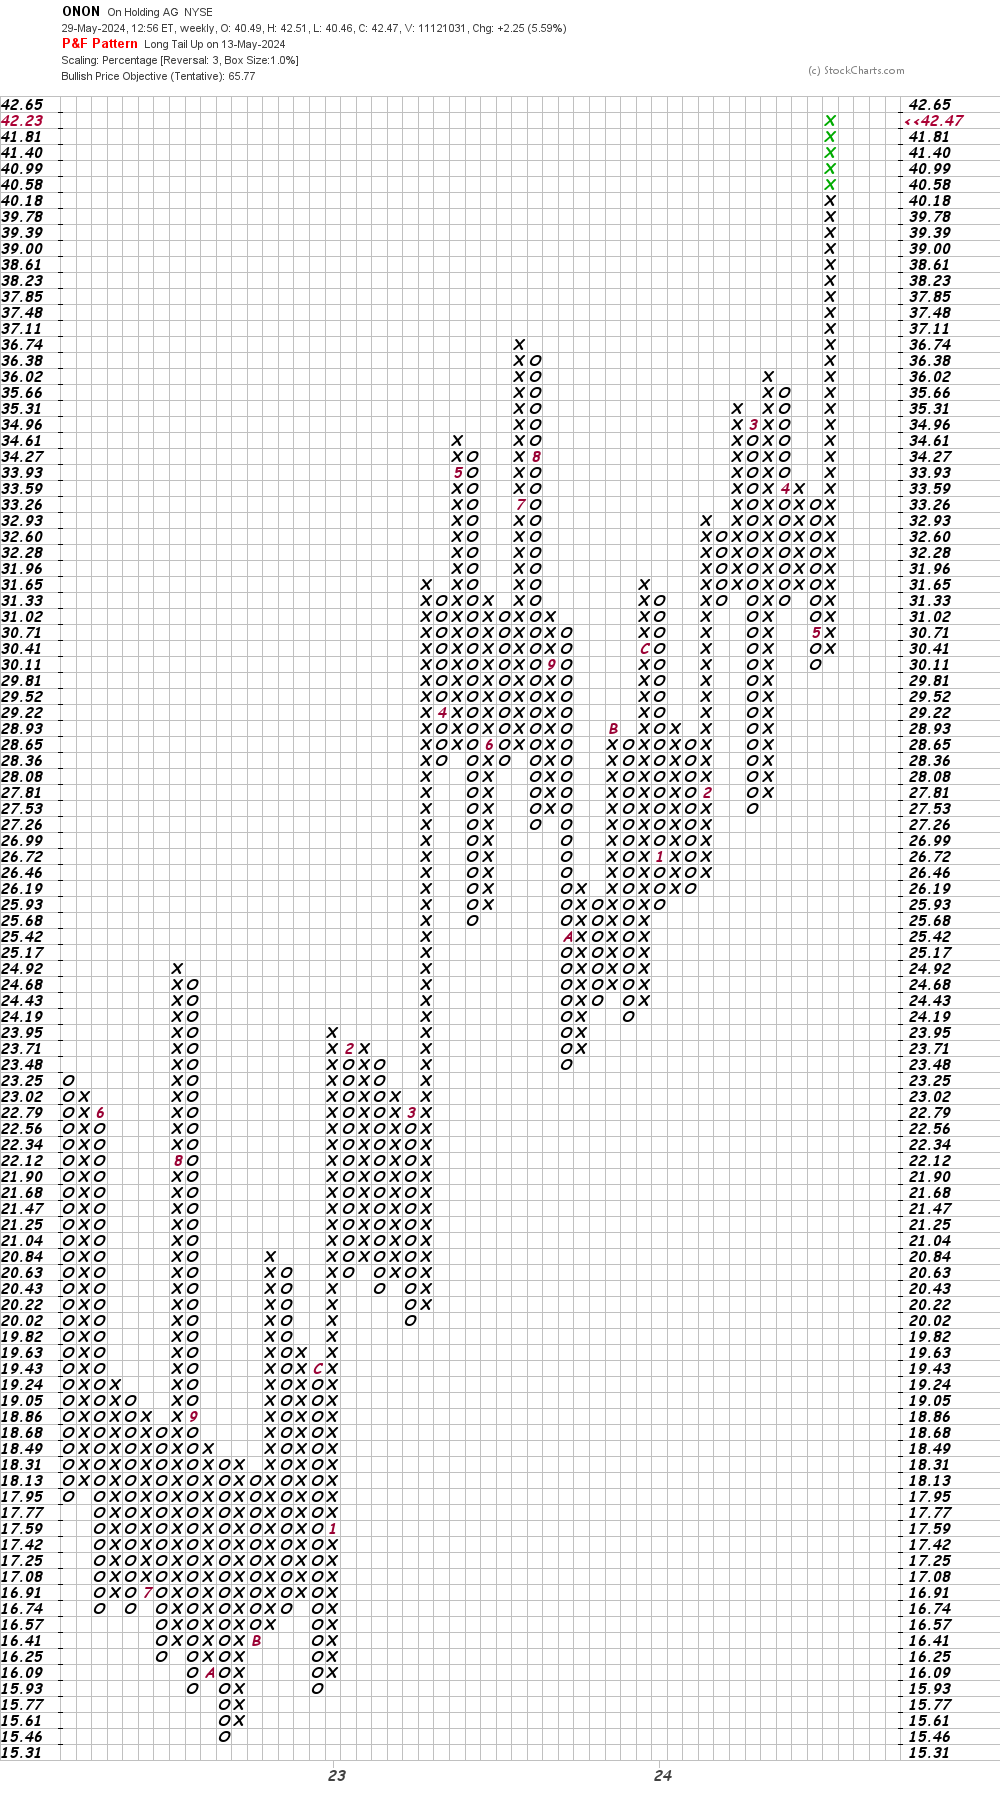
Bottom-line strategy: Traders who are long ONON should continue to hold. The $66 area is my new price target above $52.
Employees of TheStreet are prohibited from trading individual securities.