Ollie's Bargain Out Breaks Out: Is It Sustainable or a Bull Trap?
There are two key price levels to watch that will likely determine the stock's path.
You've reached your free article limit
You've read 0 of 1 free Pro articles.
Ollie's Bargain Outlet Holdings OLLI recently pushed up to make a new 52-week high on the charts.
Let's check out the indicators to see if this move by the shares is sustainable or perhaps what old-time chart readers call a bull trap.
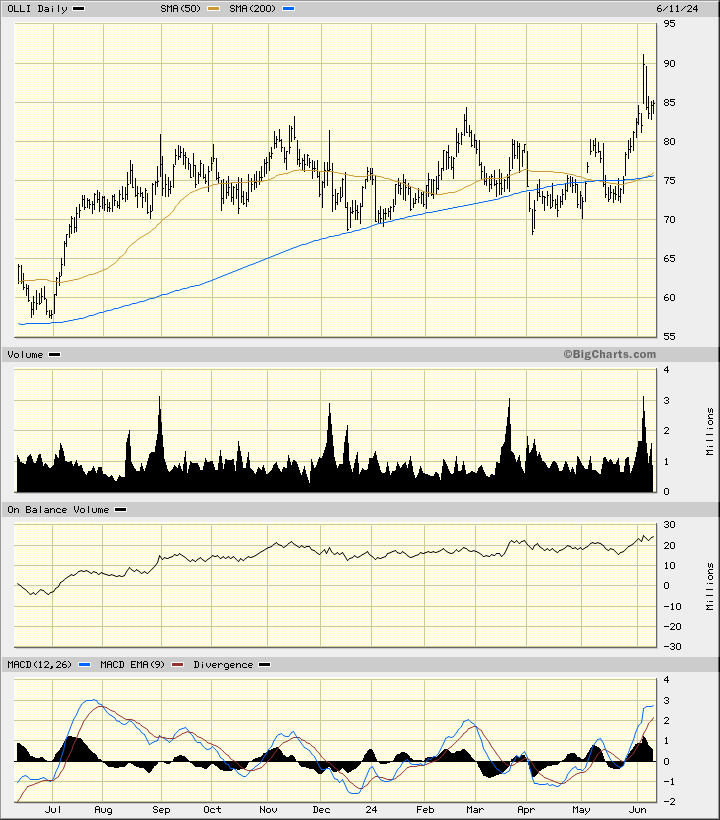
In this daily bar chart of OLLI, below, I can see that the shares traded sideways for 10 months before rallying to a new high. Prices are trading above the rising 50-day moving average line and above the rising 200-day line.
The trading volume has been surprisingly active the past year. The On-Balance-Volume (OBV) line has moved sideways since November but looks like it is strengthening from the middle of May.
The Moving Average Convergence Divergence (MACD) oscillator is in a bullish alignment above the zero line. A close back below $80 could mean that prices made a bull trap and we are likely to see further declines in the days and weeks ahead.
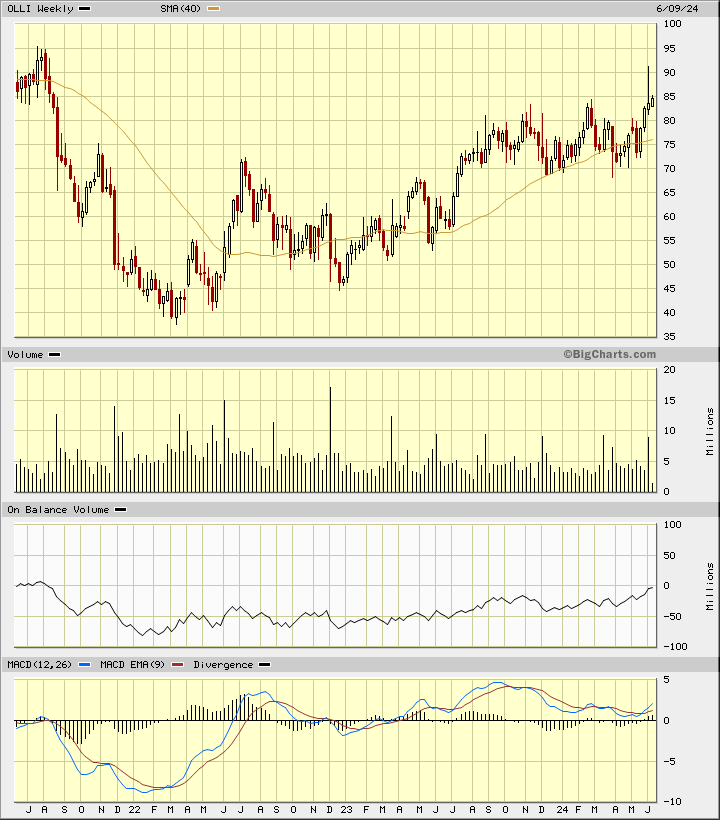
In this weekly Japanese candlestick chart of OLLI, below, I see a mostly positive picture. Prices are in a longer-term uptrend and trade above the rising 40-week moving average line.
The weekly OBV line has been in an uptrend since the beginning of 2023. The MACD oscillator is above the zero line and turning upwards for a fresh buy signal.
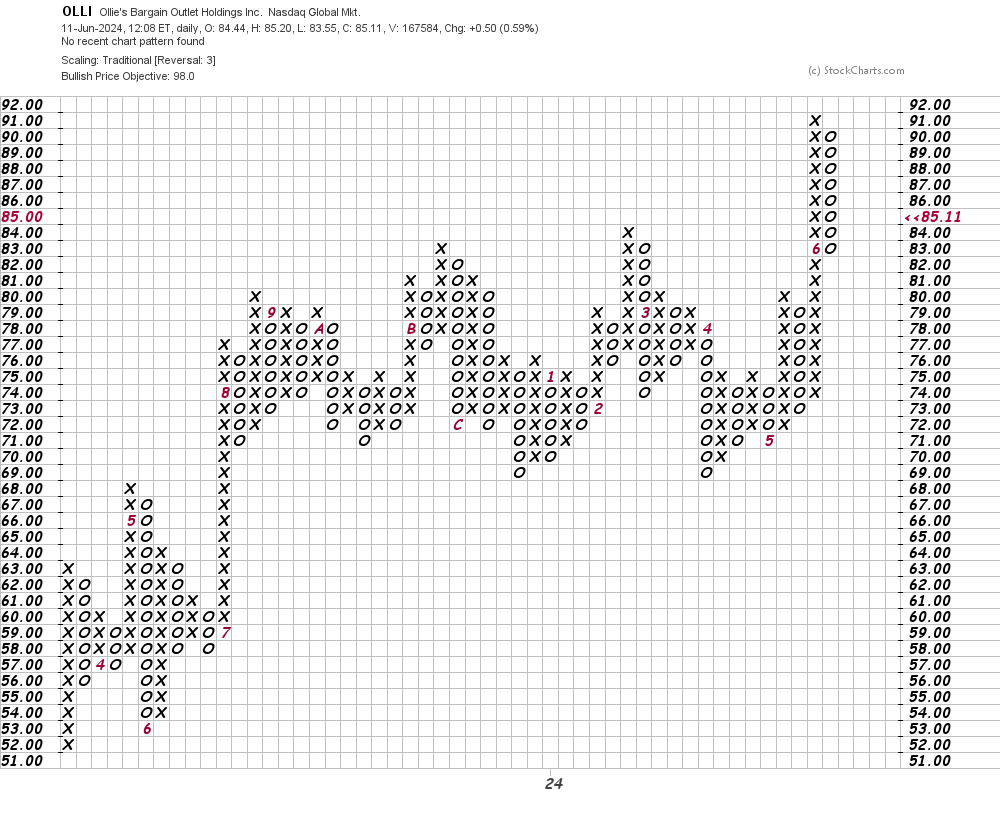
In this daily Point and Figure chart of OLLI, below, I can see a potential upside price target in the $98 area.
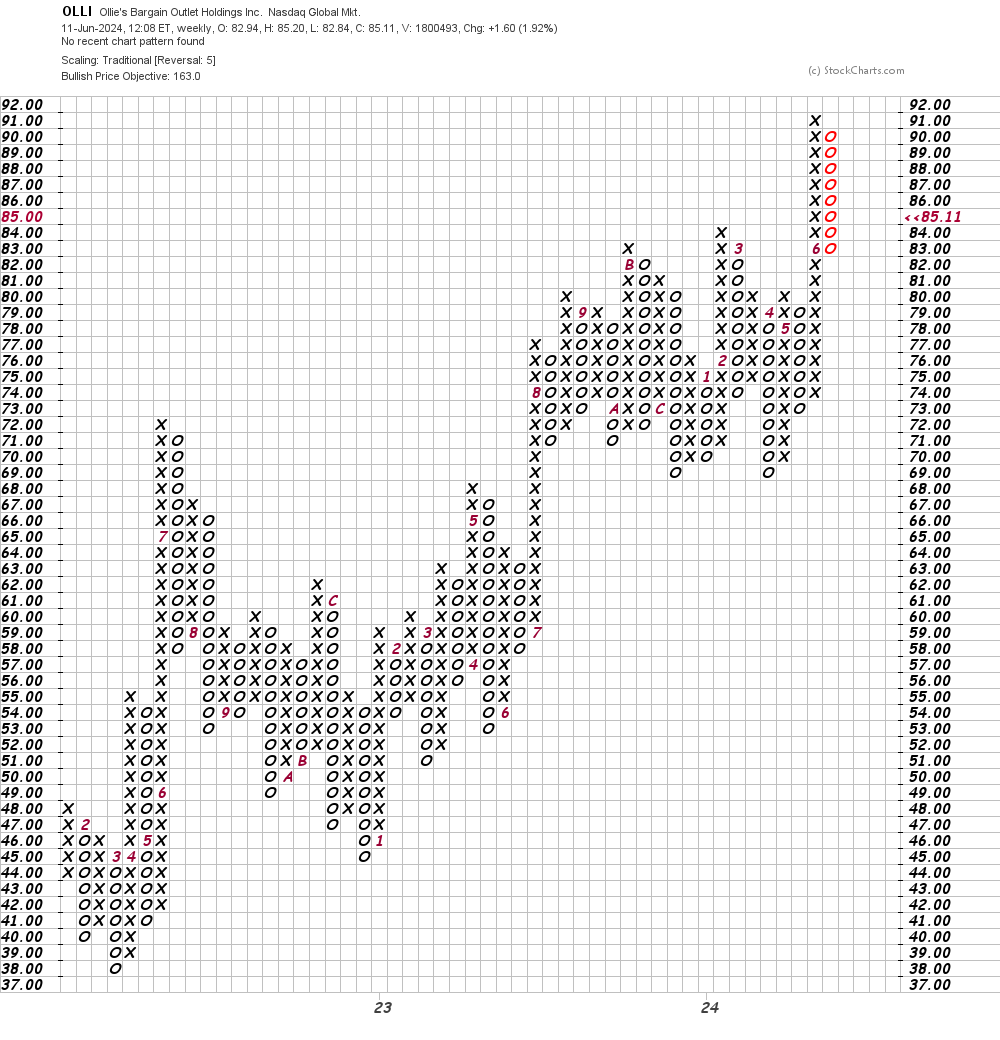
In this second Point and Figure chart of OLLI, below, I used weekly price data with a five-box reversal filter. Here the software is projecting a price target in the $163 area.
Bottom-line strategy: Let's watch the price action of OLLI closer the next several days. Strength above $86 could mean that prices are headed higher while weakness under $80 is a sign that a downside reversal is underway.
Employees of TheStreet are prohibited from trading individual securities.