Nvidia Bounces, Netflix Roars and Gold Reverses as Markets Swing Wildly
Markets are off to a wild start this week so we're taking a closer look at the charts.
You've reached your free article limit
You've read 0 of 1 free Pro articles.
The week is off to a wild start. On Monday, charts marked key turning points in Nvidia (NVDA) , Netflix (NFLX) , gold and elsewhere. Let’s get into it!
Netflix Hits the Target.
On Thursday morning, we presented our trading strategy for Netflix. The streaming giant’s attempt to buy certain assets of Warner Brothers Discovery (WBD) fell apart, thanks to a superior bid from Paramount Skydance (PSKY) .
Early on Monday morning, our preliminary target of $98 was reached (T1). That target is the approximate 38.2% Fibonacci retracement of the stock’s decline from its June high (point A) to its February low (point B).
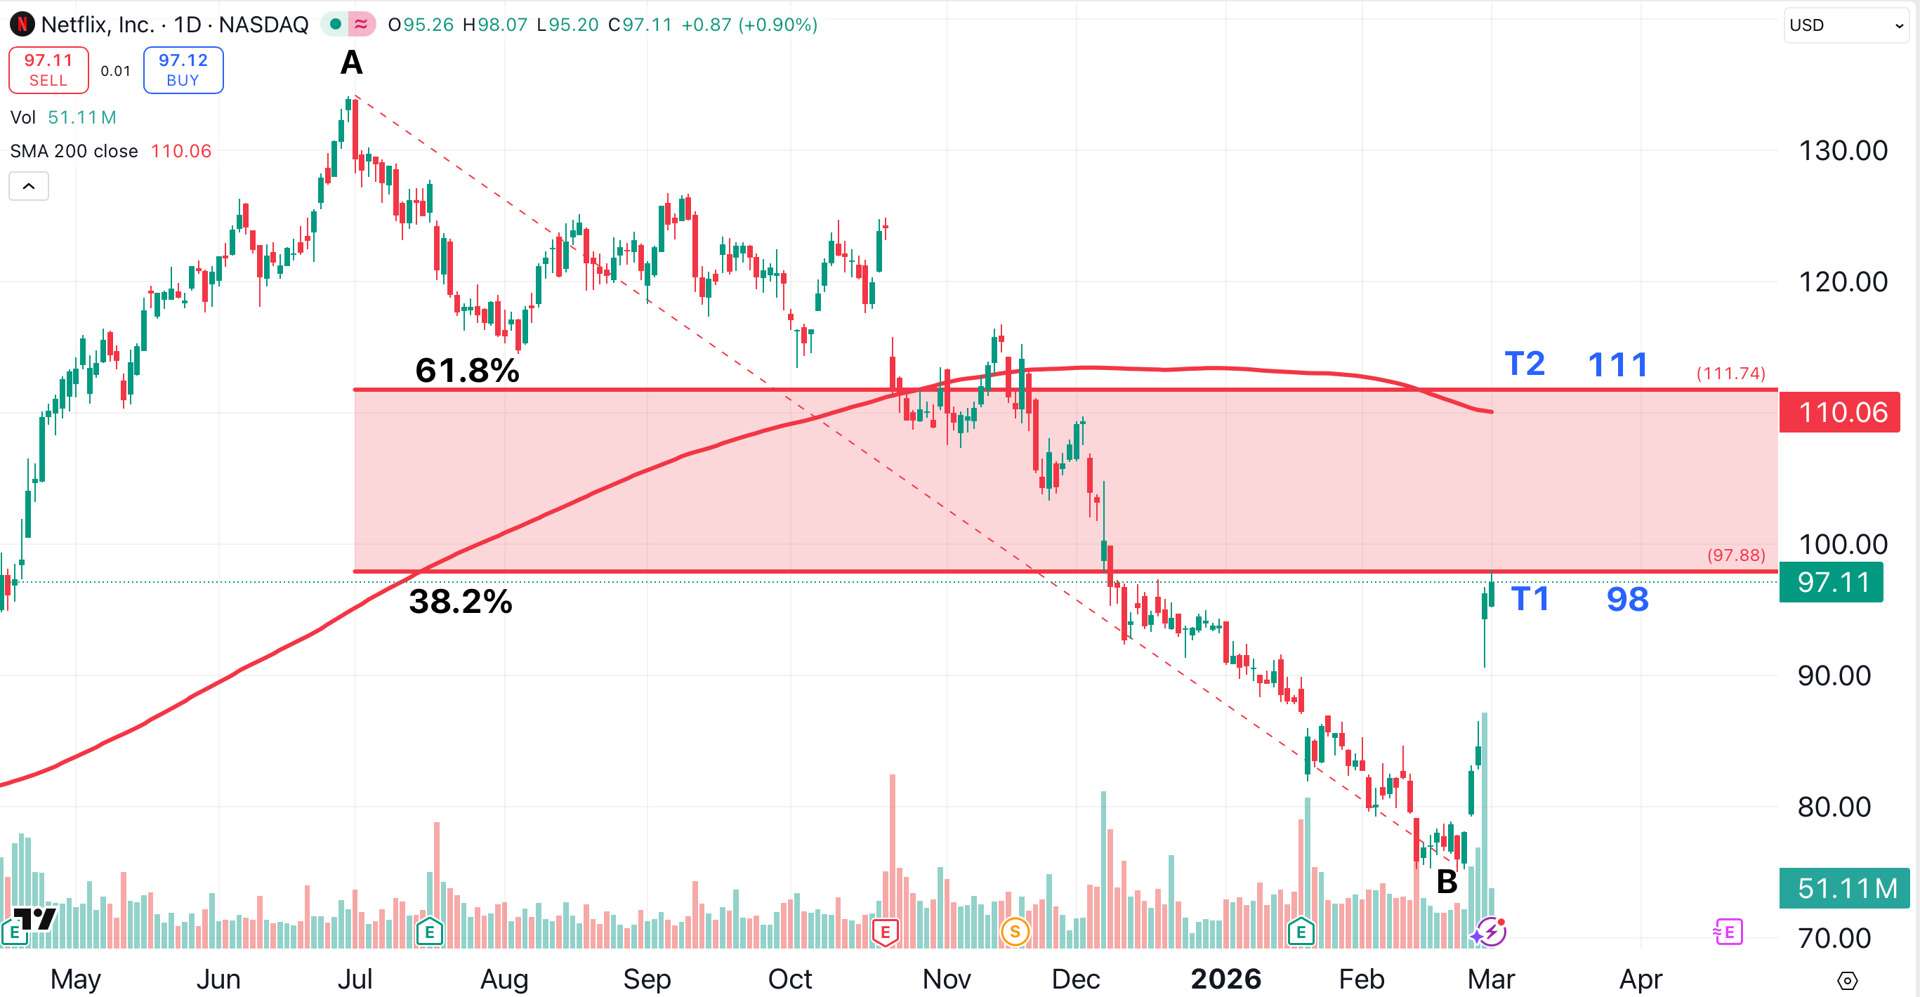
Our secondary target is $111, the 61.8% retracement of that same decline (T2). In the meantime, we're going to manage risk by raising our initial stop from $75 to $79.15, just below Wednesday’s low of $79.25.
30% Gain for Paramount Skydance
While we caught a quick profit on Netflix, we missed the move on Paramount Skydance, which also ripped higher. This move came as a surprise, as Paramount is widely considered to have overpaid for Warner Brothers Discovery. Paramount is also acquiring about $38 billion of Warner Brothers’ debt.
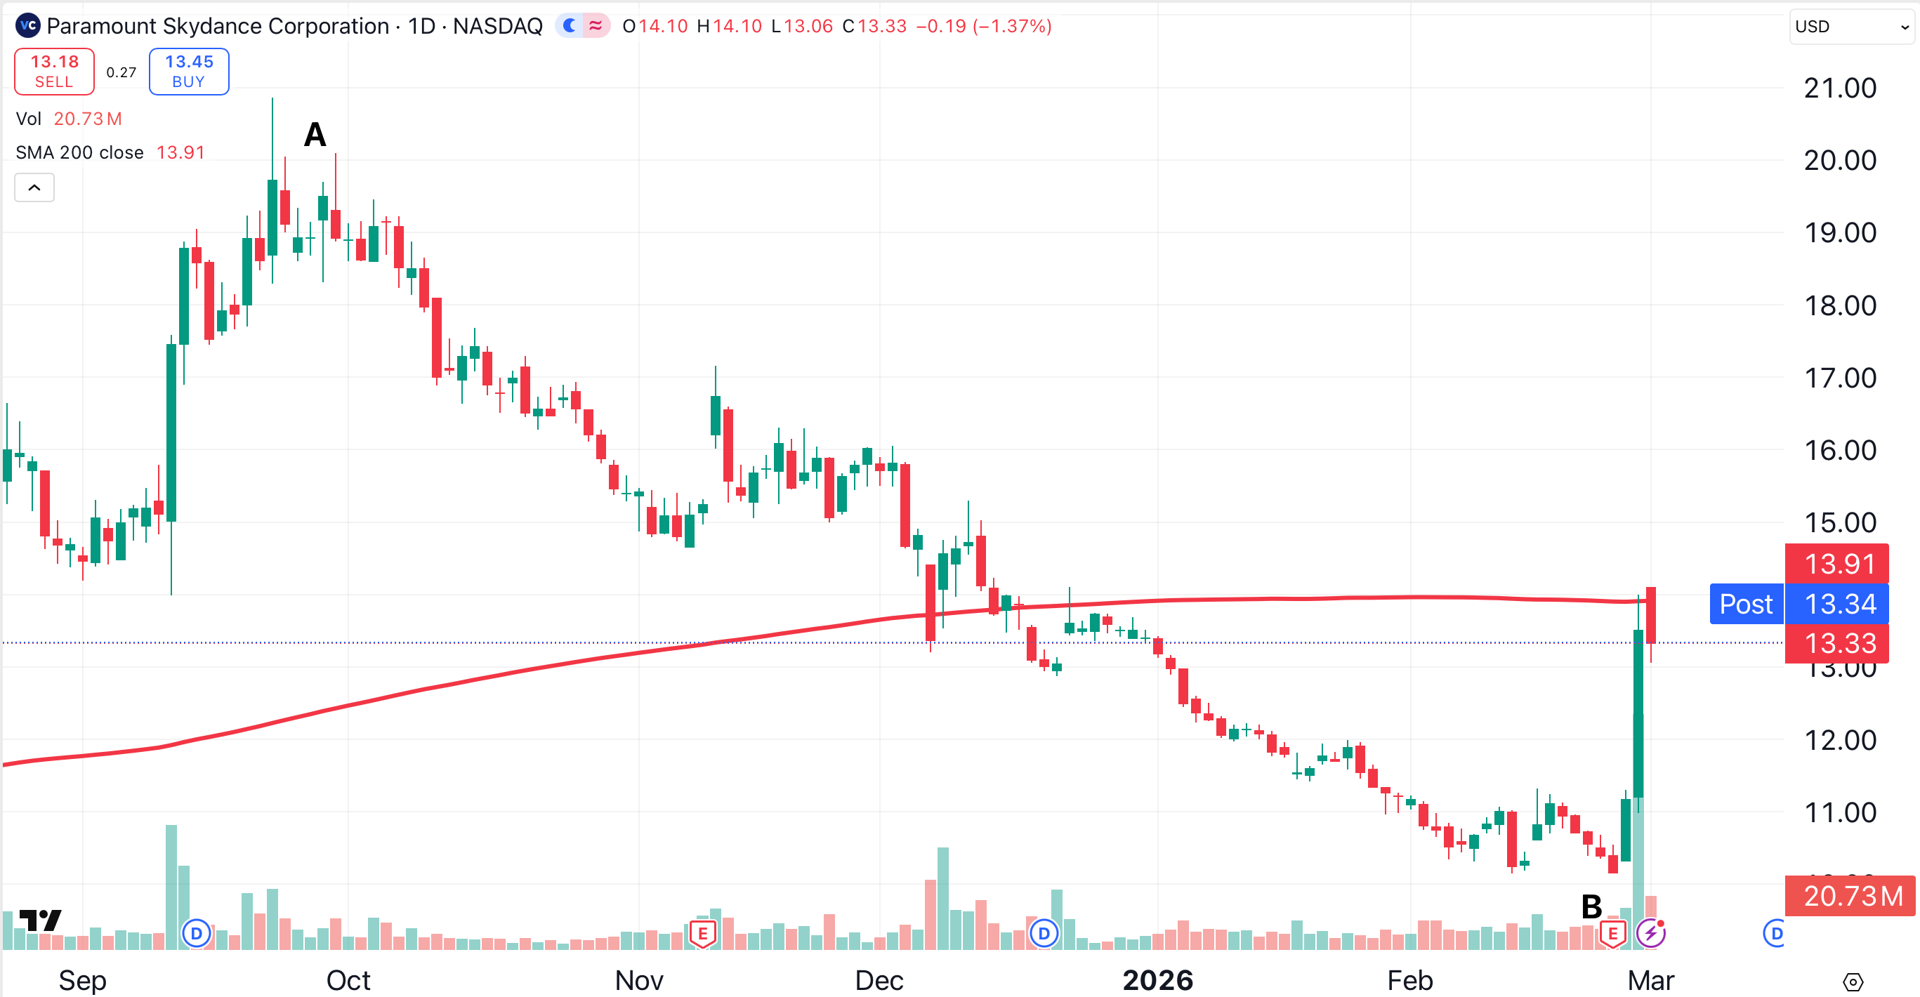
Paramount Skydance shares were halved over a six-month period as the bidding wore on.
Since the bidding war ended, Paramount has roared to a 30% gain in less than a week. The stock’s rally was capped by its 200-day moving average (red).
Nvidia Bounce to Continue?
Speaking of 200-day moving averages (red), Nvidia made contact with that key indicator on Monday morning for the first time in nine months. It sure looks like someone was waiting for that moment to buy, as the AI chip maker bounced sharply from its intraday low of $174.
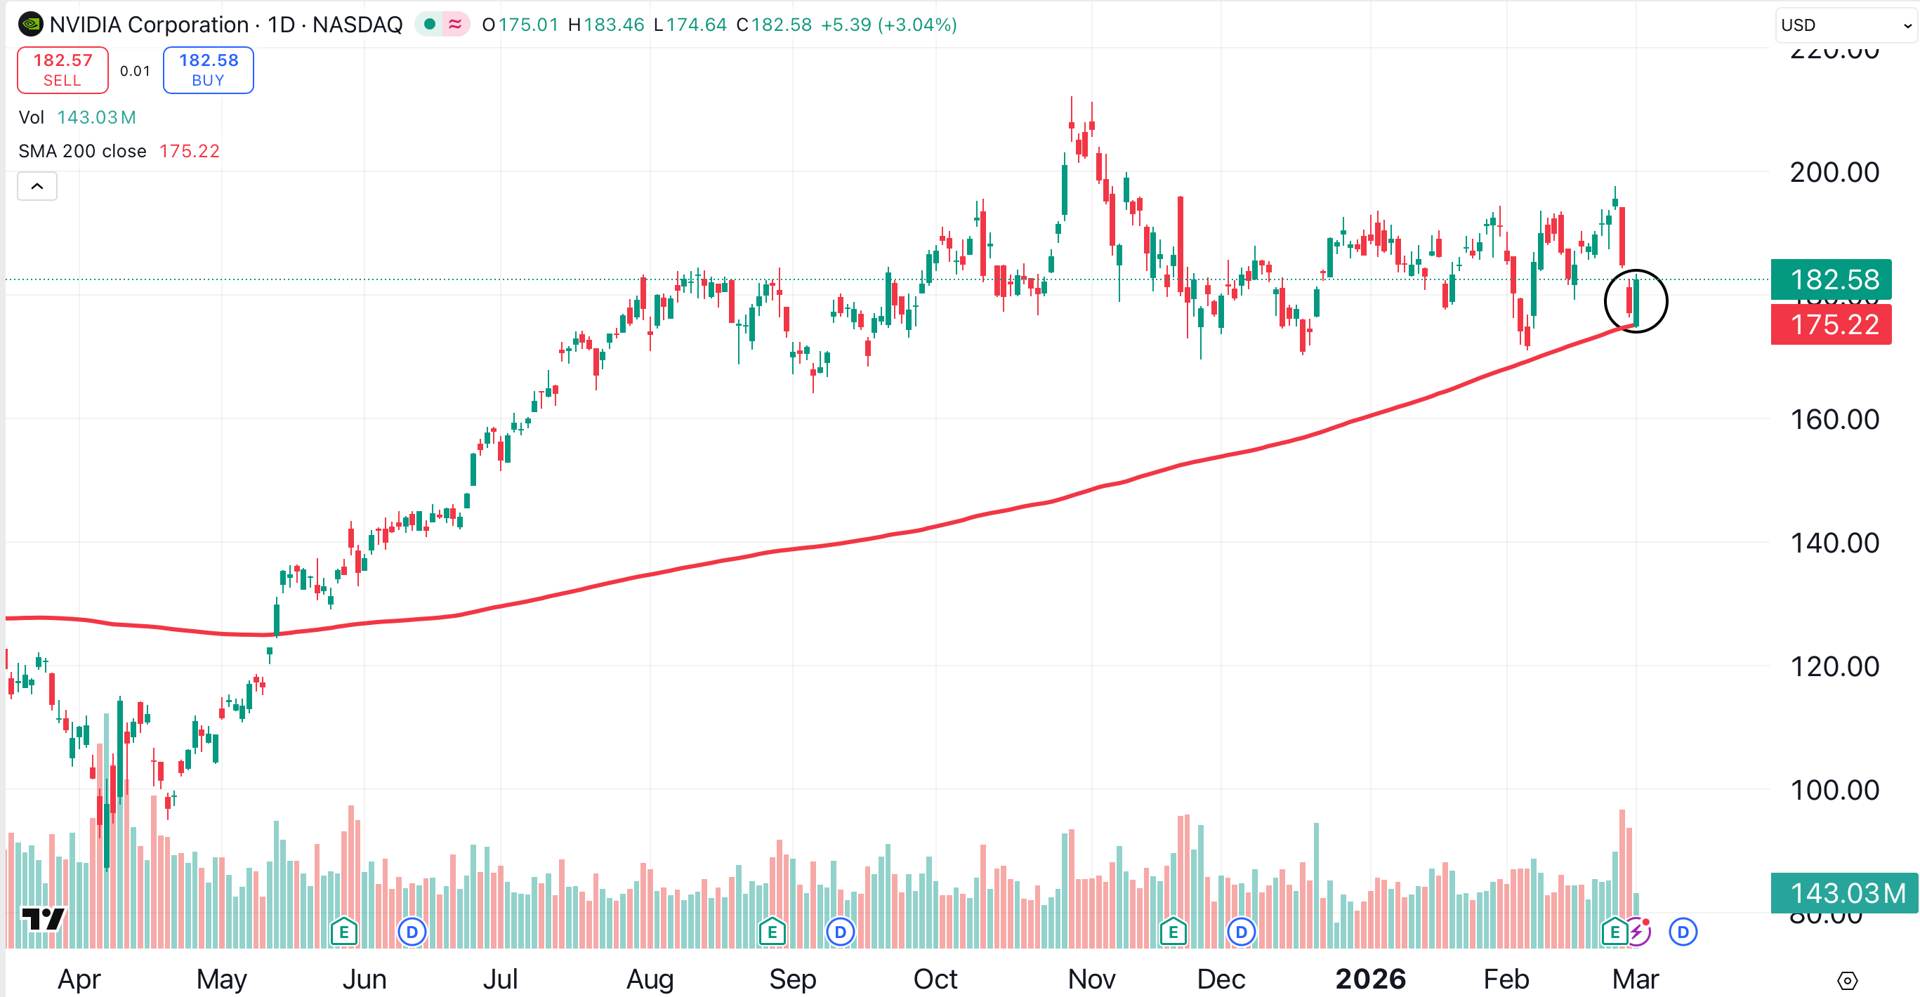
Nvidia’s sharp bounce created a bullish engulfing candle formation (circled), an indication that the stock’s bullish move is likely to continue.
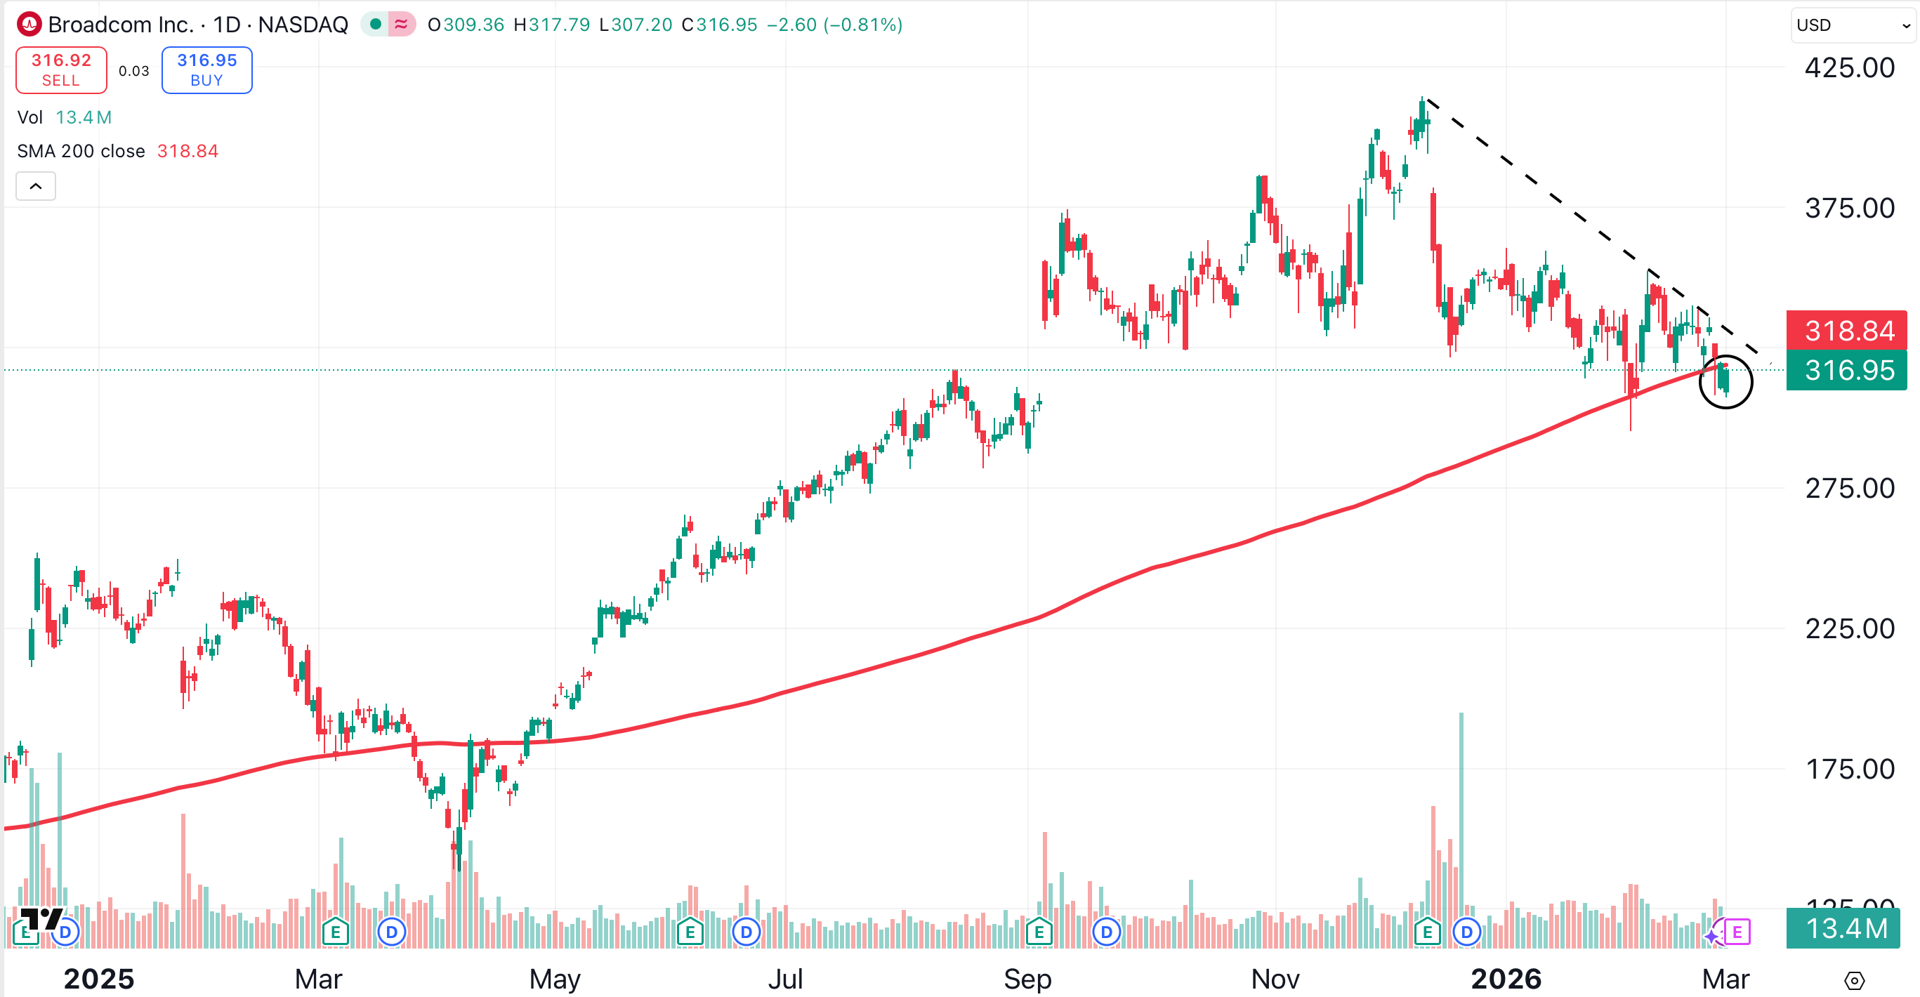
No Hitchhikers Allowed
If you’re thinking that Nvidia’s strength pulled other AI chip makers along for the ride, you’d be mistaken. Competitor Broadcom (AVGO) closed beneath its 200-day moving average for the first time in nearly a year (circled).
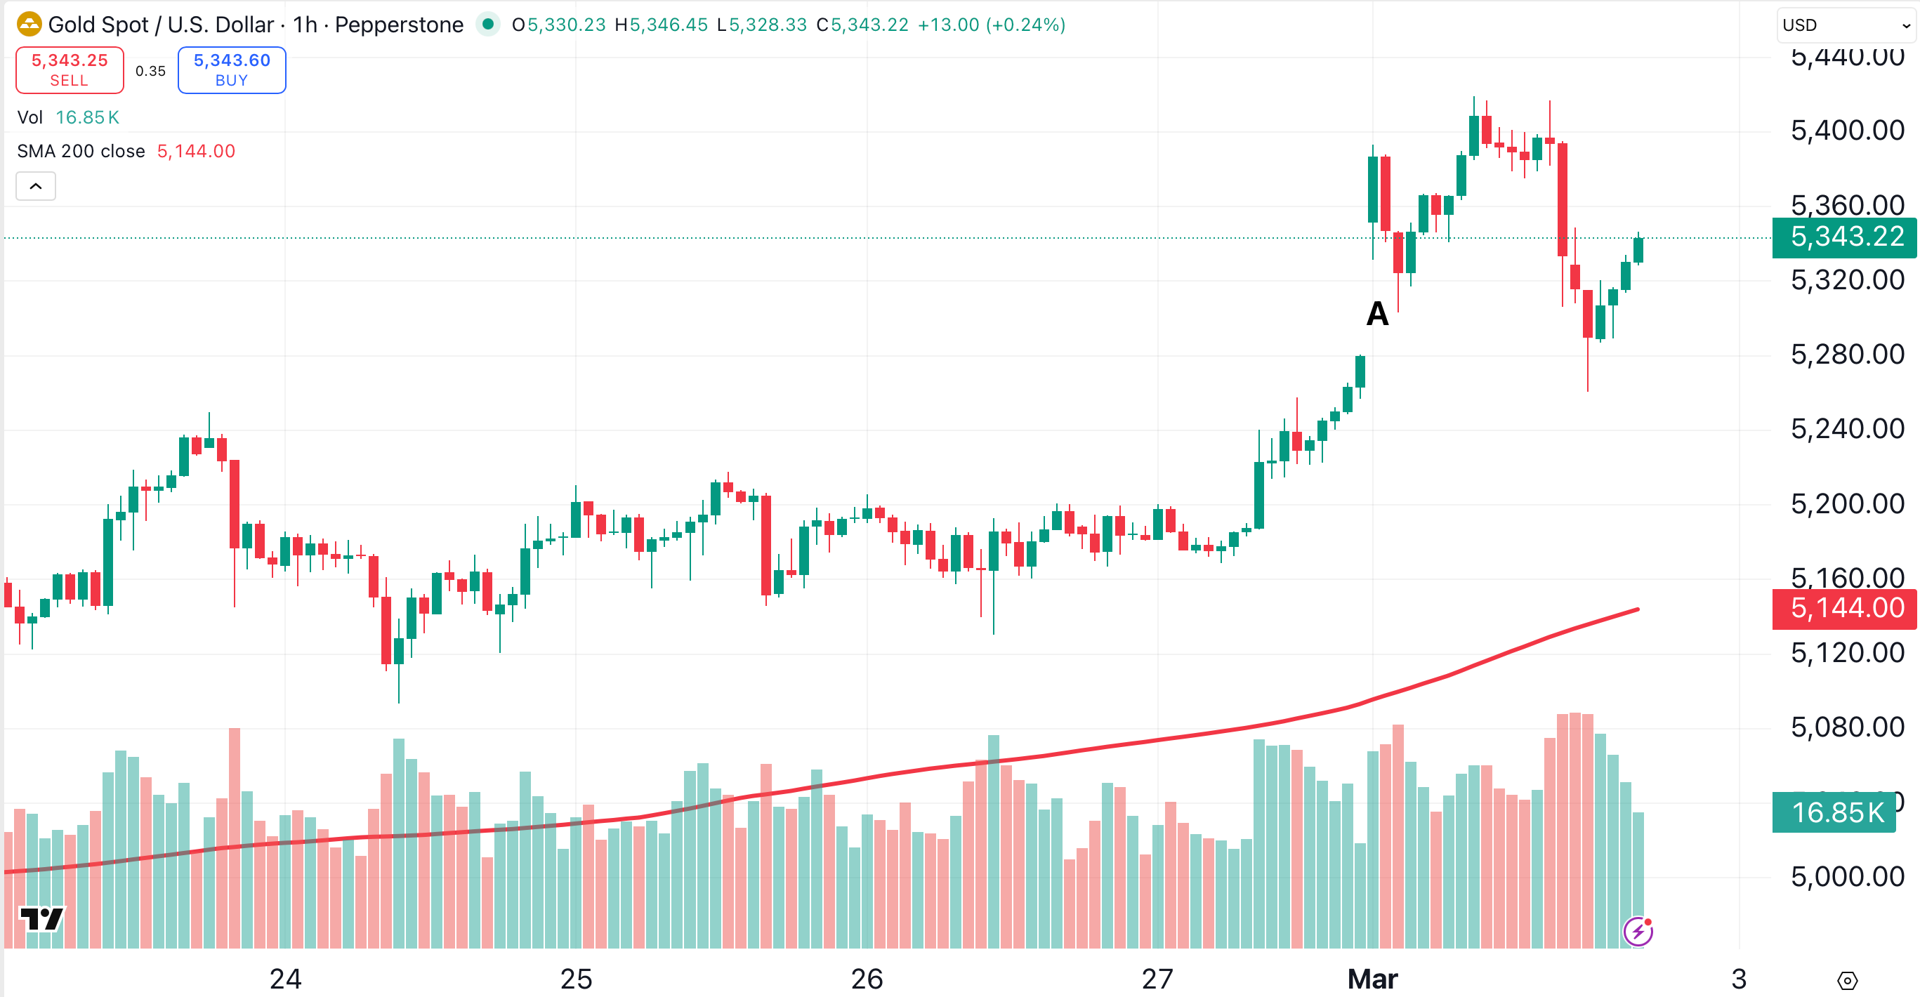
Gold Reversal Stuns Investors
Spot gold, seen here on the hourly chart, gapped higher as the trading week began (point A). However, some traders were perplexed when the yellow metal reversed to fill the gap.
Why did gold fail to hold its gains? Check out the daily chart of the U.S. Dollar Index (DXY). The greenback shot higher from a symmetrical triangle pattern (black dotted lines) to close above its 200-day moving average for the first time in over a month.
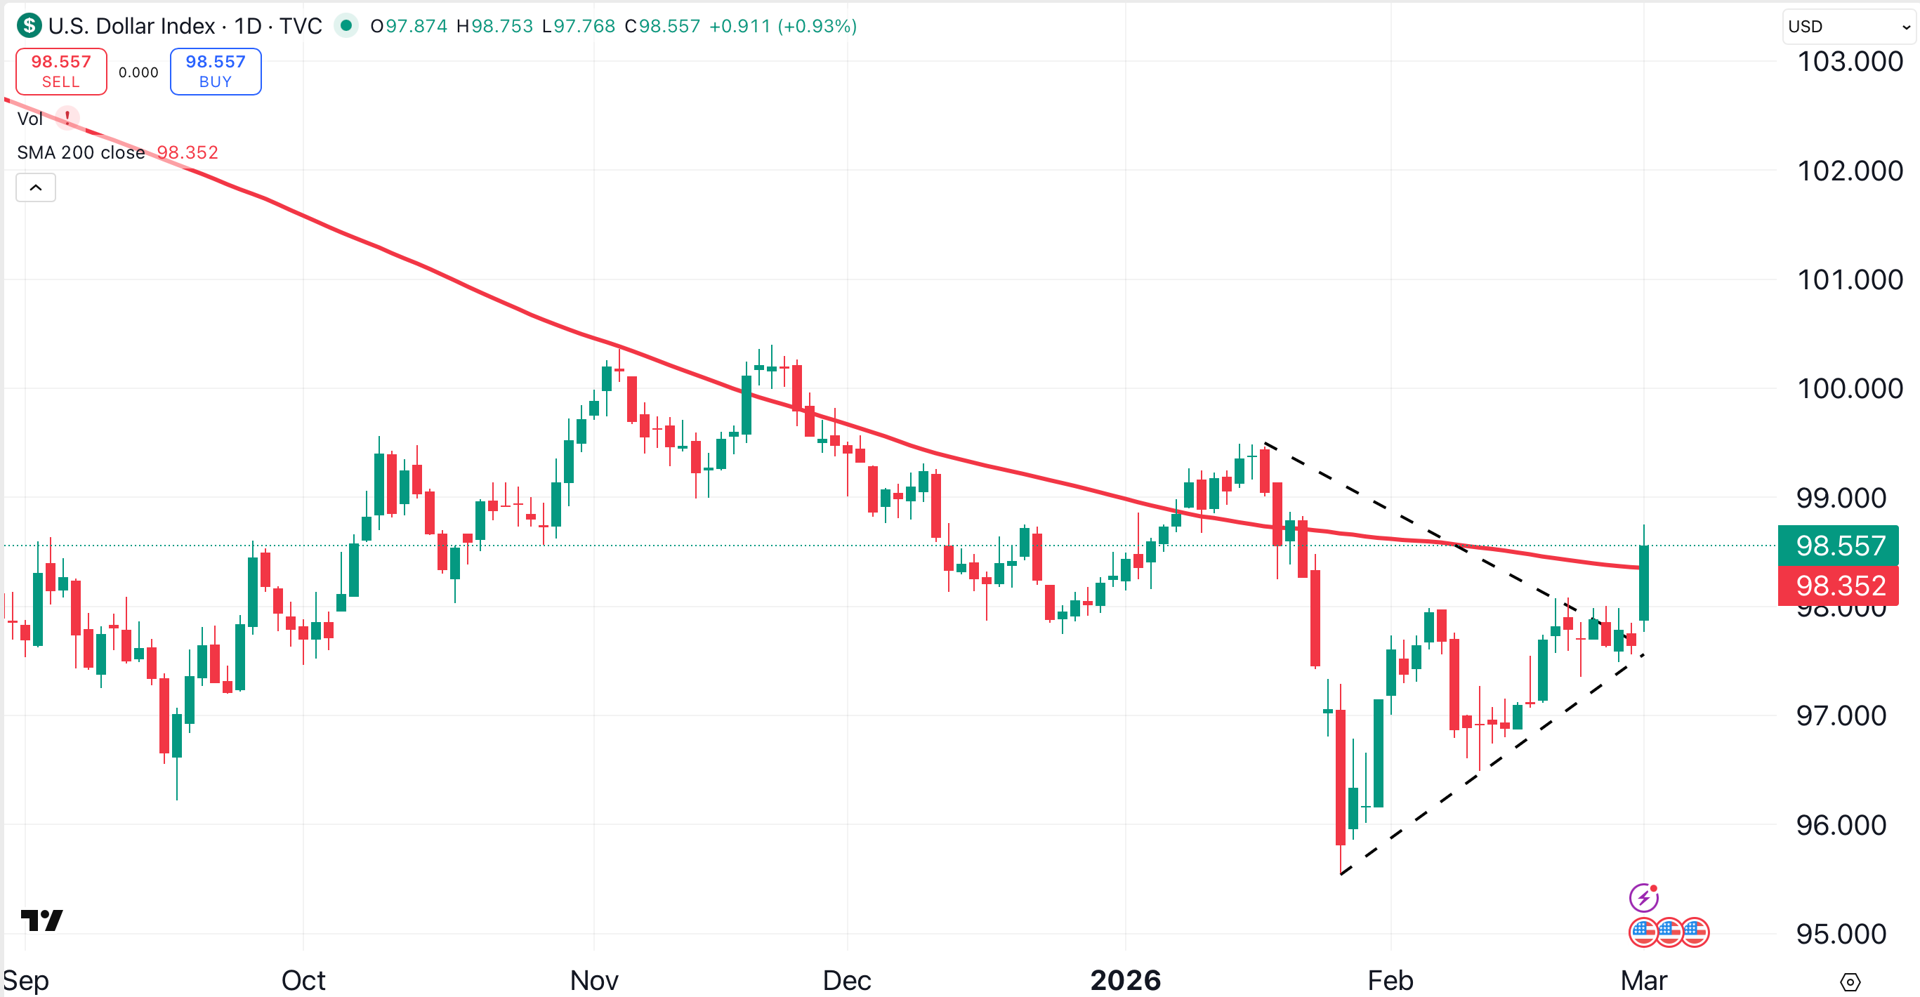
Since gold and the U.S. dollar have a strong negative correlation, it’s not surprising that the yellow metal surrendered its gains. Keep an eye on the dollar as the week unfolds, as continued strength in the greenback could help contain energy prices.
At the time of publication, Ponsi was long NVDA, NFLX and AVGO.
